Typical Kd values for protein complexes
What sets the range, and why measurements of one complex disagree

Matic Broz, PhD15 min
What is a typical Kd for a protein complex?
For protein complexes, the dissociation constant (Kd) runs from about 10 µM down to about 10 fM, and most measured complexes sit between 0.1 nM and 1 µM.[1] Antibodies cluster near 0.1 to 70 nM, enzyme inhibitors reach into the picomolar and femtomolar range, and receptors that pass signals between cells are often micromolar. A smaller Kd means a tighter complex.
Barnase and barstar show both the top of that range and how fragile a single value is. At pH 8 and 25 °C the pair has a Kd of 1.3 × 10⁻¹⁴ M, and the formed complex has a half-life of about a day. Add 500 mM NaCl and the Kd rises about 1,800-fold, to 2.4 × 10⁻¹¹ M, because salt screens the opposite charges that pull the two proteins together.[2]
Three things decide the number a paper reports: what the complex does, which method measured it, and the conditions and record keeping behind it. Even when all three are sound, the same complex measured by two methods usually differs by a factor of two or so.[1]

What does a Kd measure?
Take a protein P and a partner L that form a complex PL. At equilibrium, binding and unbinding balance, and the dissociation constant is
where the square brackets mean concentration in mol/L. When the free partner is at a concentration equal to , exactly half the protein is in the complex. A Kd of 1 nM therefore says that nanomolar concentrations of the partner are enough to occupy most binding sites, while a Kd of 10 µM says that you need ten thousand times more.
Kd is also a ratio of two speeds, the rate at which the complex falls apart and the rate at which the partners find each other:
The ratio is why tight complexes are slow to measure. The barnase and barstar value above comes from an association rate of M−1 s−1 and a dissociation rate of s−1.[2] That dissociation rate is a half-life of about 24 hours, from .
Kd converts directly into a binding free energy. With the standard concentration of 1 M,[3]
At 25 °C, is 0.592 kcal/mol (2.48 kJ/mol), so every tenfold change in Kd moves by 1.364 kcal/mol (5.71 kJ/mol). Table 1 shows the scale used in the rest of this article. The same conversion is often applied to computed values, although a docking score is not a binding affinity, and many assays report an IC50 or Ki rather than a Kd.
| Kd | ΔG° (kcal/mol) | ΔG° (kJ/mol) |
|---|---|---|
| 100 µM | −5.5 | −22.8 |
| 10 µM | −6.8 | −28.5 |
| 1 µM | −8.2 | −34.2 |
| 100 nM | −9.5 | −40.0 |
| 10 nM | −10.9 | −45.7 |
| 1 nM | −12.3 | −51.4 |
| 100 pM | −13.6 | −57.1 |
| 10 pM | −15.0 | −62.8 |
| 1 pM | −16.4 | −68.5 |
| 10 fM | −19.1 | −79.9 |
| 1 fM | −20.5 | −85.6 |
Typical Kd for each kind of complex
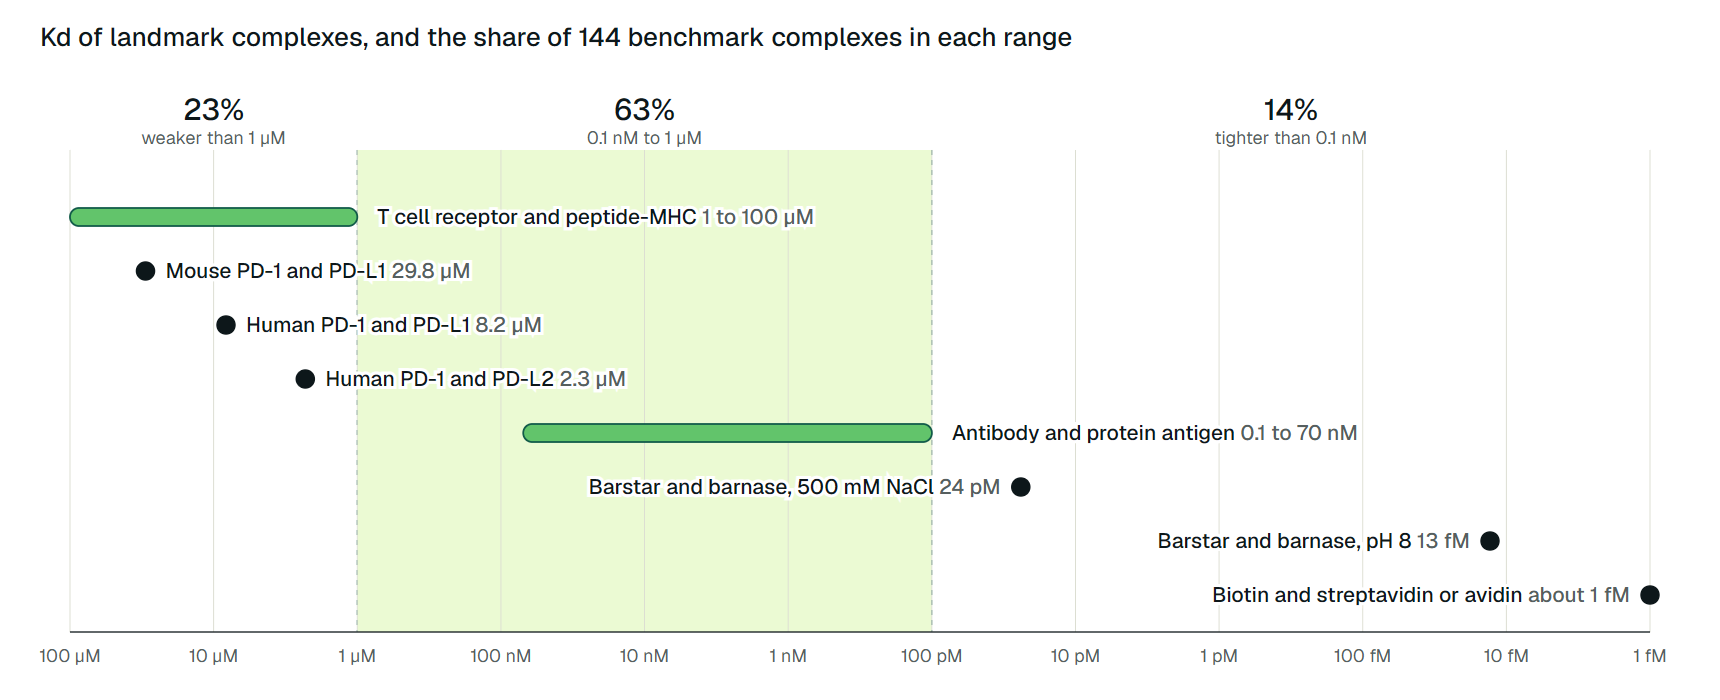
The widest survey is the affinity benchmark of Kastritis and colleagues: 144 protein-protein complexes with crystal structures and Kd values measured by biophysical methods, ranging from to M.[1] In their three bands, 14% bind tighter than 0.1 nM, 63% fall between 0.1 nM and 1 µM, and 23% bind more weakly than 1 µM.[1]
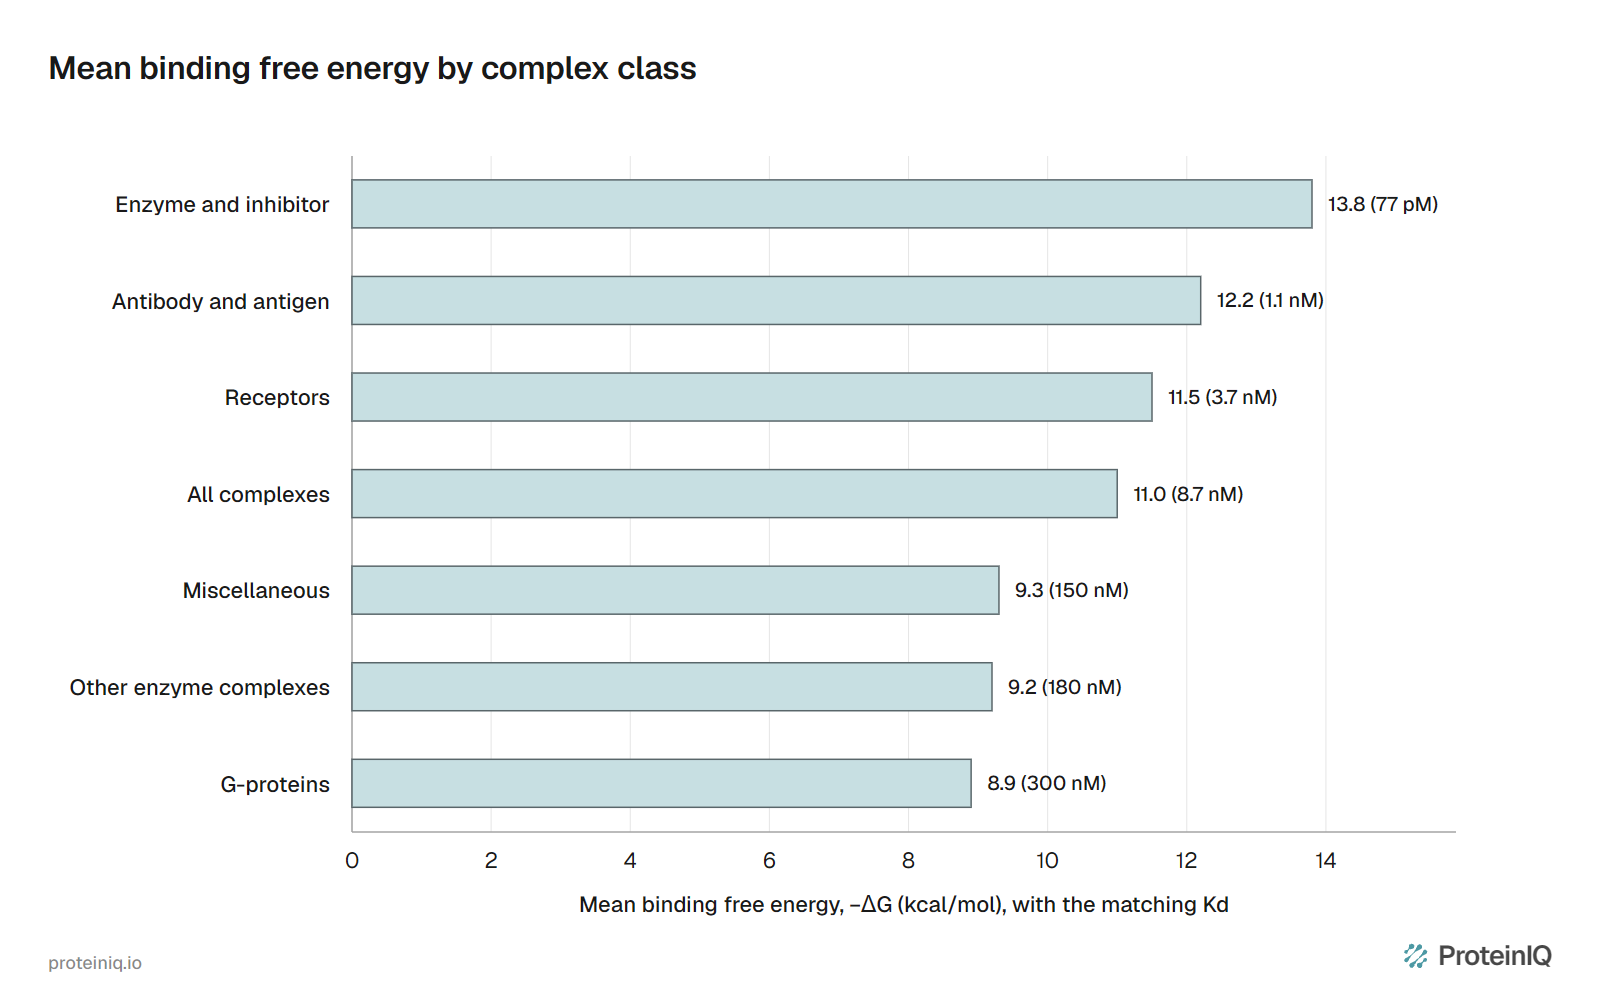
The mean binding free energy across the set is 11.0 kcal/mol with a standard deviation of 2.9, which we convert to a Kd of roughly 9 nM. The typical value depends strongly on what the complex does. Figure 1 ranks the benchmark's classes by mean free energy, and Table 2 adds the complex counts and the three bands.
| Class | Complexes | Mean ΔG (kcal/mol) | Kd at mean ΔG | Kd below 0.1 nM | 0.1 nM to 1 µM | Above 1 µM |
|---|---|---|---|---|---|---|
| Antibody and antigen | 19 | −12.2 | 1.1 nM | 2 | 16 | 1 |
| Enzyme and inhibitor | 40 | −13.8 | 77 pM | 17 | 22 | 1 |
| Other enzyme complexes | 21 | −9.2 | 180 nM | 0 | 12 | 9 |
| G-proteins | 17 | −8.9 | 300 nM | 1 | 6 | 10 |
| Receptors | 13 | −11.5 | 3.7 nM | 1 | 11 | 1 |
| Miscellaneous | 34 | −9.3 | 150 nM | 0 | 22 | 12 |
| All complexes | 144 | −11.0 | 8.7 nM | 20 | 90 | 34 |
Antibodies
Sixteen of the 19 antibody and antigen complexes in the benchmark have Kd values between 0.1 and 70 nM.[1] One exception is BO2C11, which binds blood clotting factor VIII with a picomolar Kd and, unlike the hybridoma antibodies around it, came from the memory B cells of a patient with haemophilia A.[1]
Natural maturation seems to stop short of the tightest binders. In lysozyme-specific B cell transfectants, Batista and Neuberger found that the response to antigen stopped improving once the association constant passed about M−1, a Kd of about 100 pM, which they took as support for a ceiling on affinity maturation.[4]
Enzymes and their inhibitors
Enzyme and inhibitor complexes are the tightest class, with a mean free energy of 13.8 kcal/mol and 17 of 40 complexes below 0.1 nM.[1] Bovine pancreatic trypsin inhibitor binds trypsin with a femtomolar Kd, and barstar binds barnase at about 13 fM.[1][2]
These inhibitors are tuned to one partner. Barstar binds a related ribonuclease with only nanomolar affinity, and the trypsin inhibitor binds trypsinogen and chymotrypsin five to eight orders of magnitude more weakly than trypsin.[1]
Receptors and signalling proteins
At the other end, proteins that pass signals bind weakly on purpose. The benchmark's G-protein class has a mean free energy of 8.9 kcal/mol, and 10 of its 17 complexes are weaker than 1 µM.[1] Human PD-1 binds its ligand PD-L1 with a Kd of about 8 µM and PD-L2 with about 2 µM, measured by surface plasmon resonance at 37 °C.[5]
T cell receptors bind a peptide held by an MHC molecule with physiological Kd values of 1 to 100 µM.[6] Affinities this weak go with fast kinetics. In a comparison of human receptors, Cole and colleagues found off-rates within a narrow window and read this as support for binding half-life being the main kinetic feature that controls T cell activation.[7]
Weak binding is not a defect. Proteins inside cells are usually present at micromolar to nanomolar concentrations, and a complex with a Kd near its partner's local concentration can switch on and off as that concentration changes. Holding two proteins together on a membrane or scaffold raises their effective concentration and can turn a negligible interaction into a substantial one.[8]
Small molecules
Drug-sized ligands follow different rules, because a small molecule can make only so many protein-ligand interactions. Kuntz and colleagues found that, across the strongest-binding ligands, free energy grows by about 1.5 kcal/mol per heavy atom at first and then flattens beyond roughly 15 atoms, with biotin and avidin among the few outliers.[9]
That cap is why drug-target Kd values sit in the nanomolar range far more often than the femtomolar one, while a protein partner, with a whole interface to work with, can go much further.
Kd values for well-known complexes
Table 3 collects landmark complexes from the primary papers, with the method, the conditions and the source. Where a value is a range, the source reports a range.
| Complex | Kd | Method | Conditions |
|---|---|---|---|
| Biotin and streptavidin or avidin | about 10−15 M | Kinetic estimate | Stopped-flow association measured at 10 to 25 °C |
| Barstar and barnase | 1.3 × 10⁻¹⁴ M | Ratio of dissociation and association rate constants | pH 8, 25 °C |
| Barstar and barnase, high salt | 2.4 × 10⁻¹¹ M | Ratio of rate constants | 500 mM NaCl |
| Monoclonal antibody and protein antigen | 0.1 to 70 nM | Various biophysical methods | 16 of 19 benchmark complexes, 18 to 35 °C |
| Human PD-1 and PD-L2 | 2.3 µM | SPR, equilibrium analysis | 37 °C, HBS-EP buffer |
| Human PD-1 and PD-L1 | 8.2 µM | SPR, equilibrium analysis | 37 °C, HBS-EP buffer |
| Mouse PD-1 and PD-L1 | 29.8 µM | SPR, equilibrium analysis | 37 °C, HBS-EP buffer |
| T cell receptor and peptide-MHC | 1 to 100 µM | SPR, as summarized by a review | Physiological receptors |
The two barnase rows are the salt effect from the start of this page, worth 4.5 kcal/mol of binding free energy.[2] The PD-1 rows show a species effect: measured in one study under identical conditions, the mouse receptor and ligand bind about four times more weakly than the human pair.[5] Figure 2 places the same values on one logarithmic axis, next to the share of benchmark complexes in each range.
How Kd is measured
Every method reads a signal that changes as the complex forms, and each fails somewhere. Surface plasmon resonance (SPR), isothermal titration calorimetry (ITC) and fluorescence titrations all work when Kd lies in the micromolar to nanomolar range, and together they supplied three quarters of the data in the Kastritis benchmark. Enzyme inhibition studies supplied another 14%.[1]
ITC measures the heat released as one partner is titrated into the other. Krainer and Keller put the reliable range of a single titration at Kd values between 100 µM and 1 nM; tighter complexes need a competition experiment with a weaker ligand.[11]
SPR immobilizes one partner on a chip and flows the other across it. It is the most common source of reported protein-protein Kd values and reads rates as well as equilibrium. But immobilization changes the measured association rate, and below nanomolar Kd the slow kinetics make results less reliable.[8][1] Fluorescence methods need a label, and they respond in proportion to binding rather than counting it directly.[8]
All equilibrium methods share two requirements, which Jarmoskaite and colleagues found missing from many published studies. The concentration of the limiting component has to sit well below the Kd, or the experiment measures that concentration and not the affinity. And the mixture must reach equilibrium, which takes longer as Kd falls.[12]
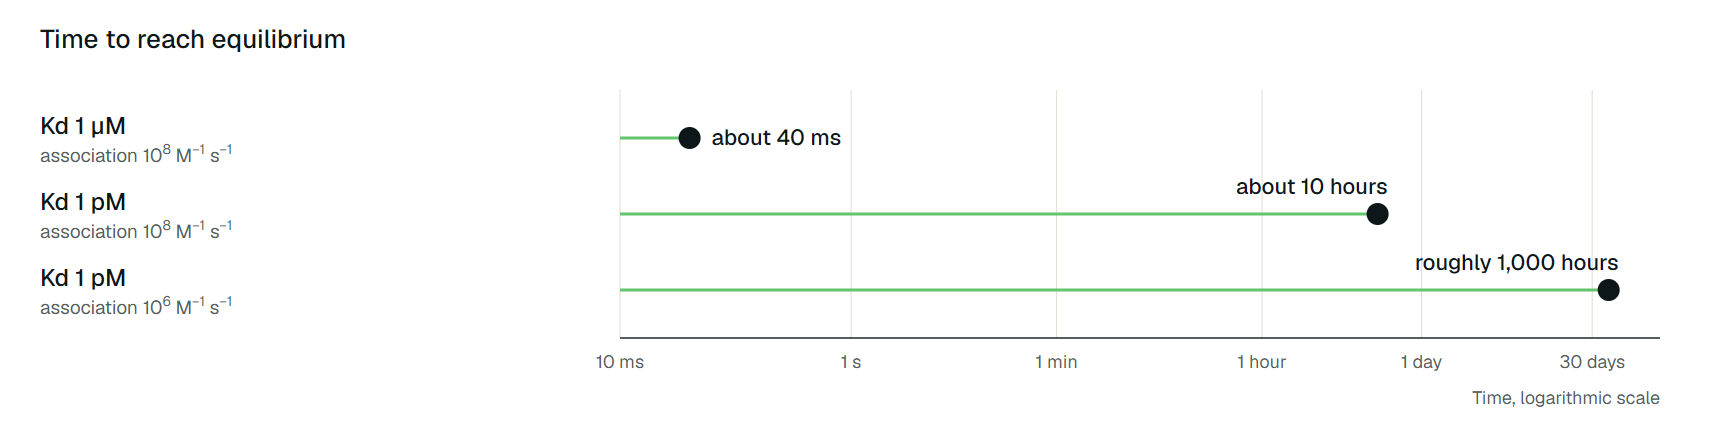
With a diffusion-limited association rate of M−1 s−1, a complex with a Kd of 1 µM equilibrates in about 40 ms, while one with a Kd of 1 pM needs about 10 hours. A slower association rate of M−1 s−1 stretches that to roughly 1,000 hours.[12] An incubation of an hour is ample for the first complex and nowhere near enough for the others.
Why published Kd values disagree
Conditions come first. Kd depends on temperature, ionic strength and pH, as the barnase example shows. The Kastritis benchmark includes measurements from 18 to 35 °C, and its authors say discrepancies can be much greater when conditions differ.[1]
Method comes second. About half of the benchmark's entries have values from two or more methods under similar conditions, and those commonly differ by a factor of 2, or 0.4 kcal/mol. Published Kd values usually carry standard errors of 20% to 50%.[1]
Across laboratories and assay types the gap widens. Ross and colleagues put the reproducibility of experimental relative affinities at an RMSE of 0.91 kcal/mol, a factor of about 4.6 in Kd.[13] Their survey covers small-molecule series, so it shows the scale of the problem rather than a protein-protein figure.
Then there are measurements made outside a method's range or before equilibrium. Jarmoskaite and colleagues reviewed 100 studies of RNA and protein binding and found that 70 never varied the incubation time, and that nearly 90% of the incubation times they recorded were an hour or less.[12]
The tightest complexes are calculated rather than titrated, from rate constants, so any error in either rate carries straight into the Kd. For streptavidin and avidin, published association rate constants range from to M−1 s−1, and Kd values reported for avidin with biotin and with biocytin differ by 100-fold.[10]
The last source is the record. Databases such as PDBbind (10,776 complexes in release 2013) and SKEMPI 2.0 (7,085 mutations with binding data) copy values from papers, and copying introduces mistakes.[14][15] Gans and colleagues checked 262 protein-protein records in PDBbind version 2020 by hand and found that about 19% had Kd values the primary paper did not support.[16]
One record listed M where the paper reported M, a thousandfold unit error.[16] Before using a value from a table, follow it back to the paper it came from.
Valency is a separate trap. A whole IgG has two binding sites and can report an apparent Kd tighter than its single-site constant, which is why antibody affinities are usually measured on monovalent Fab fragments.
What tools can predict about Kd
A prediction is judged against measurements, and the spread above sets the ceiling. If two assays agree only within about 1 kcal/mol, a predictor cannot be shown to do better than that.
PPAP estimates protein-protein affinity from an assembled complex structure and returns a −ΔG score in kcal/mol and a Kd at a fixed 25 °C. It does not dock partners, and its documentation presents the result as a ranking aid to confirm with SPR, ITC or another assay. PRODIGY predicts the same quantity from interface contacts.

Vangone and Bonvin tested the contacts-based model behind PRODIGY on 81 benchmark complexes whose Kd came from methods they judged reliable. It reached a correlation of 0.73 in magnitude and an error of 1.89 kcal/mol, a factor of about 24 in Kd, and the authors noted that the experimental method behind each value strongly affects the result.[17]
Binding free energy from molecular dynamics answers a different question. gmx_MMPBSA returns ΔG components for a complex you have simulated, and its documentation says the results should guide prioritization, not predict absolute binding constants. Genheden and Ryde note that MM/PBSA and MM/GBSA omit conformational entropy and the free energy of binding-site waters, so performance varies strongly with the system.[18]
How to read a Kd value
A Kd is useful when three things come with it: the conditions (buffer, salt, pH, temperature), a method that can reach that value, and whether the number came from equilibrium or from rate constants. Without them, a factor of five is within the noise and a factor of a thousand may be a unit error.
With them, the ranges hold. Signalling complexes sit in the micromolar range and release quickly. Antibodies and most enzyme and receptor complexes fall between about 0.1 nM and 1 µM, and the few complexes evolved to resist separation, such as an inhibitor and its target enzyme, reach picomolar and below. A Kd is one number about a complex, but it rules a whole class of behaviour in or out.