What is PPAP?
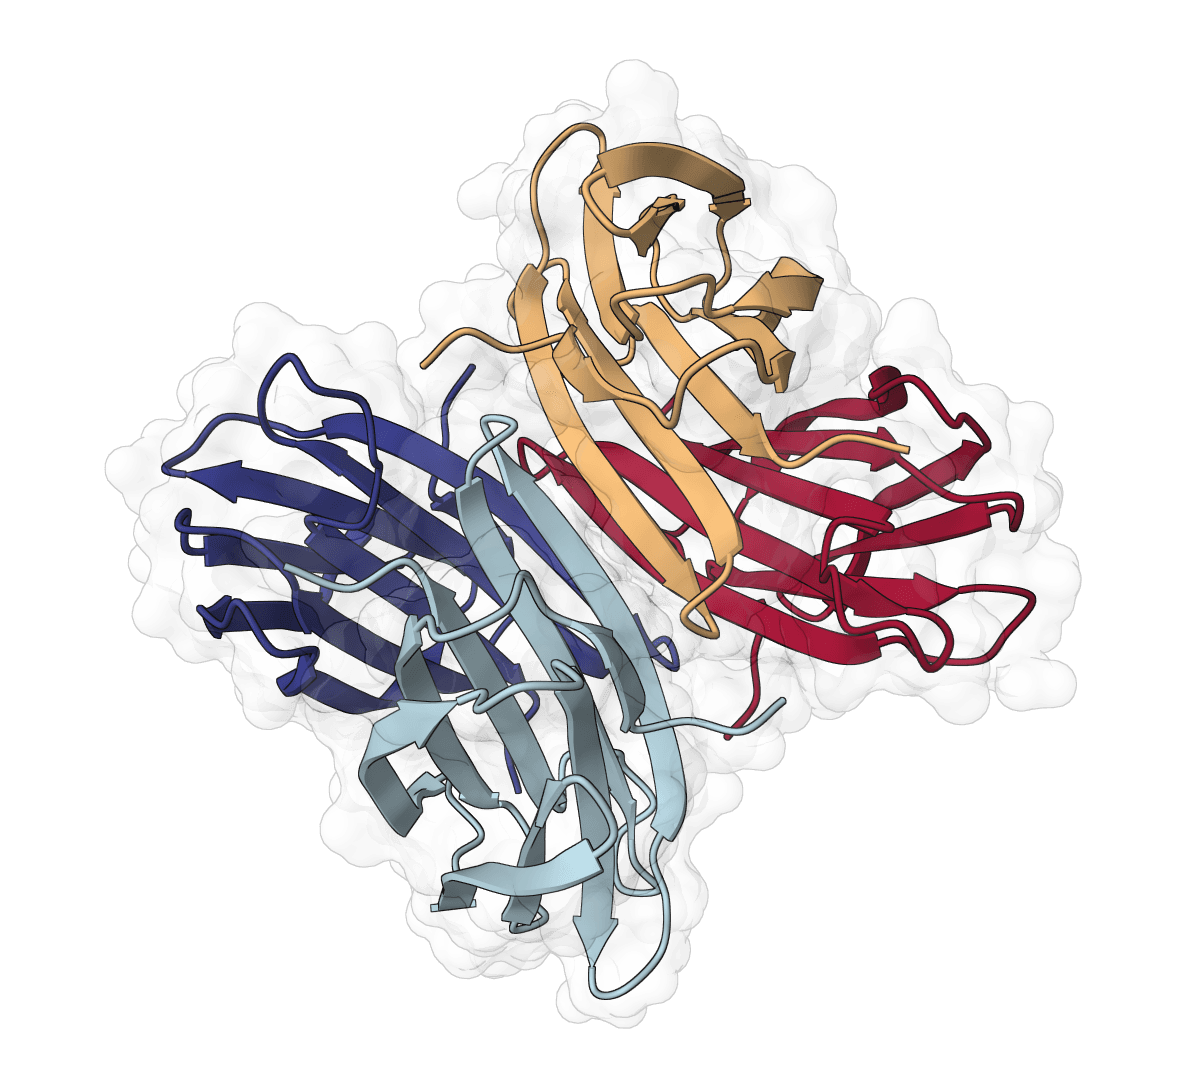
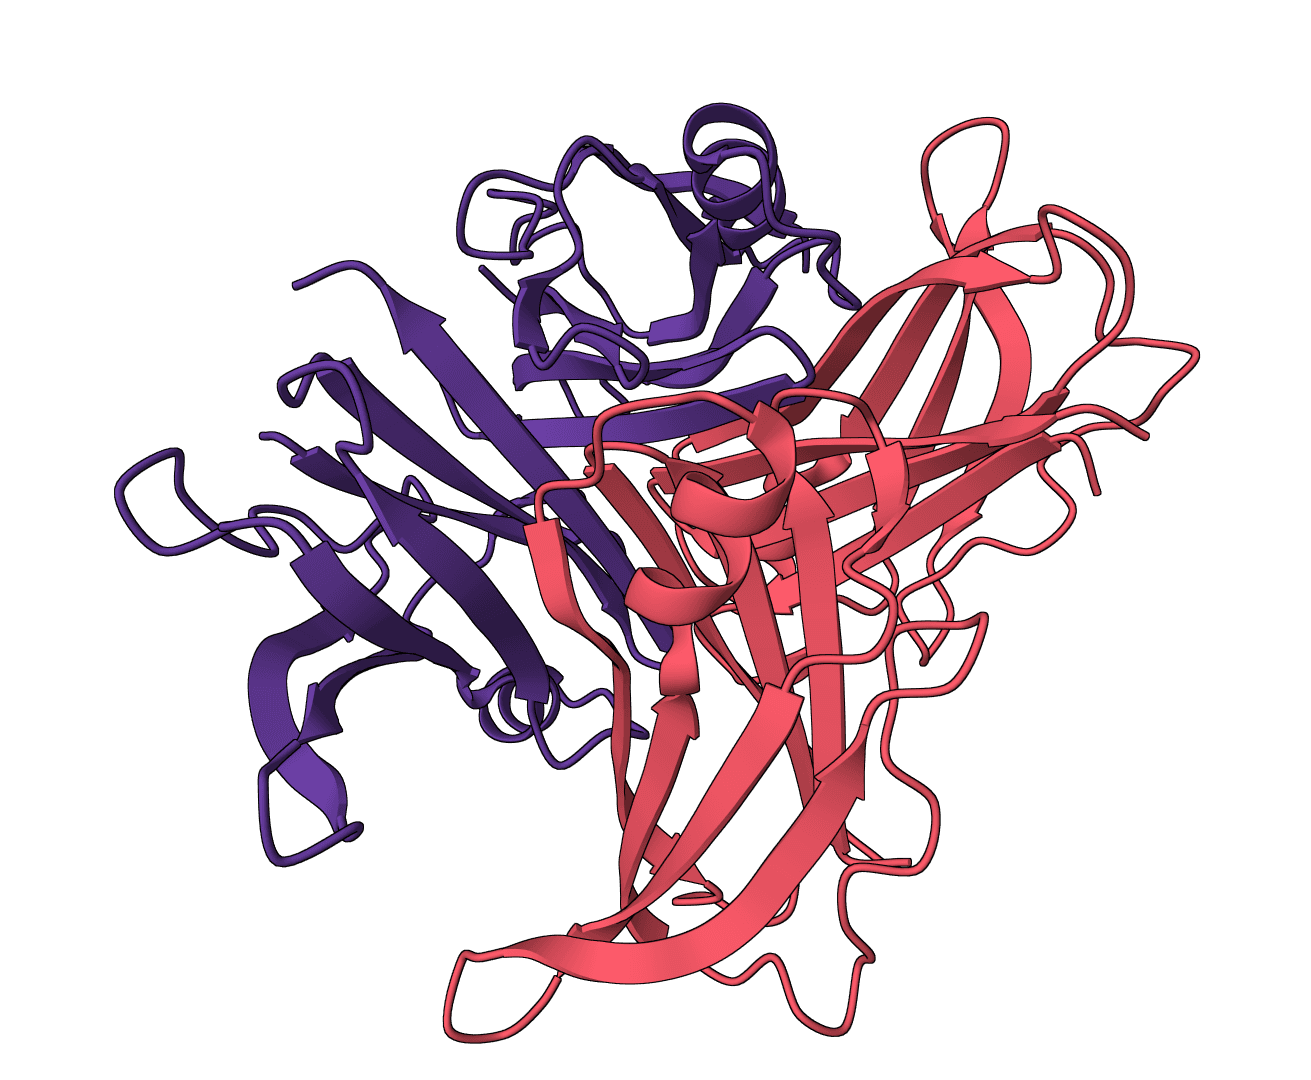
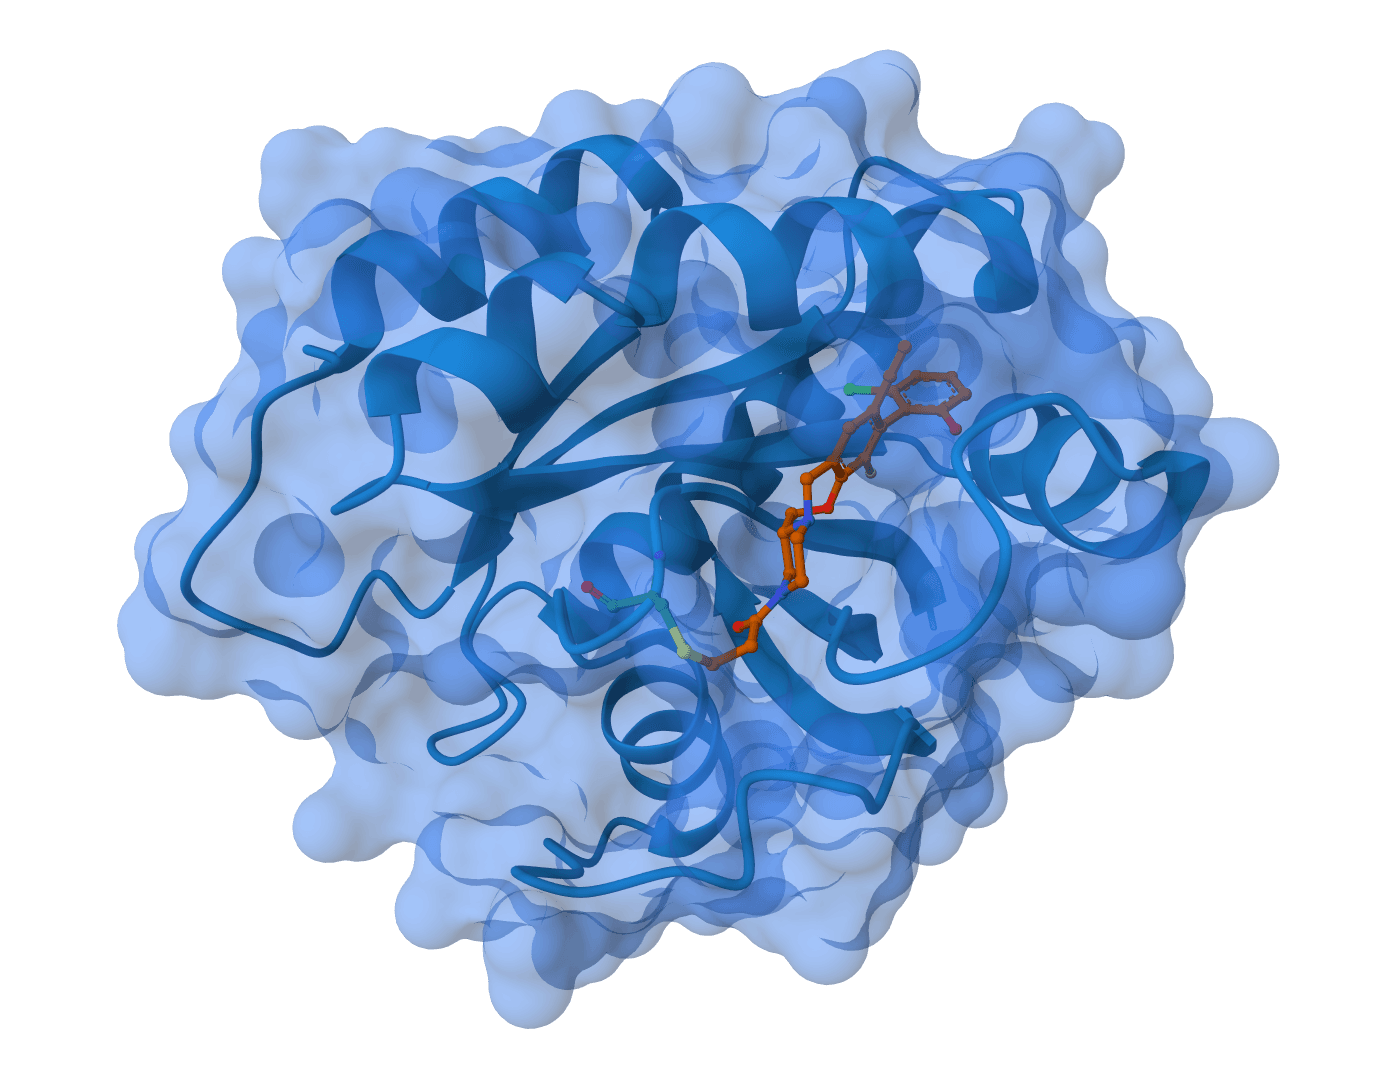
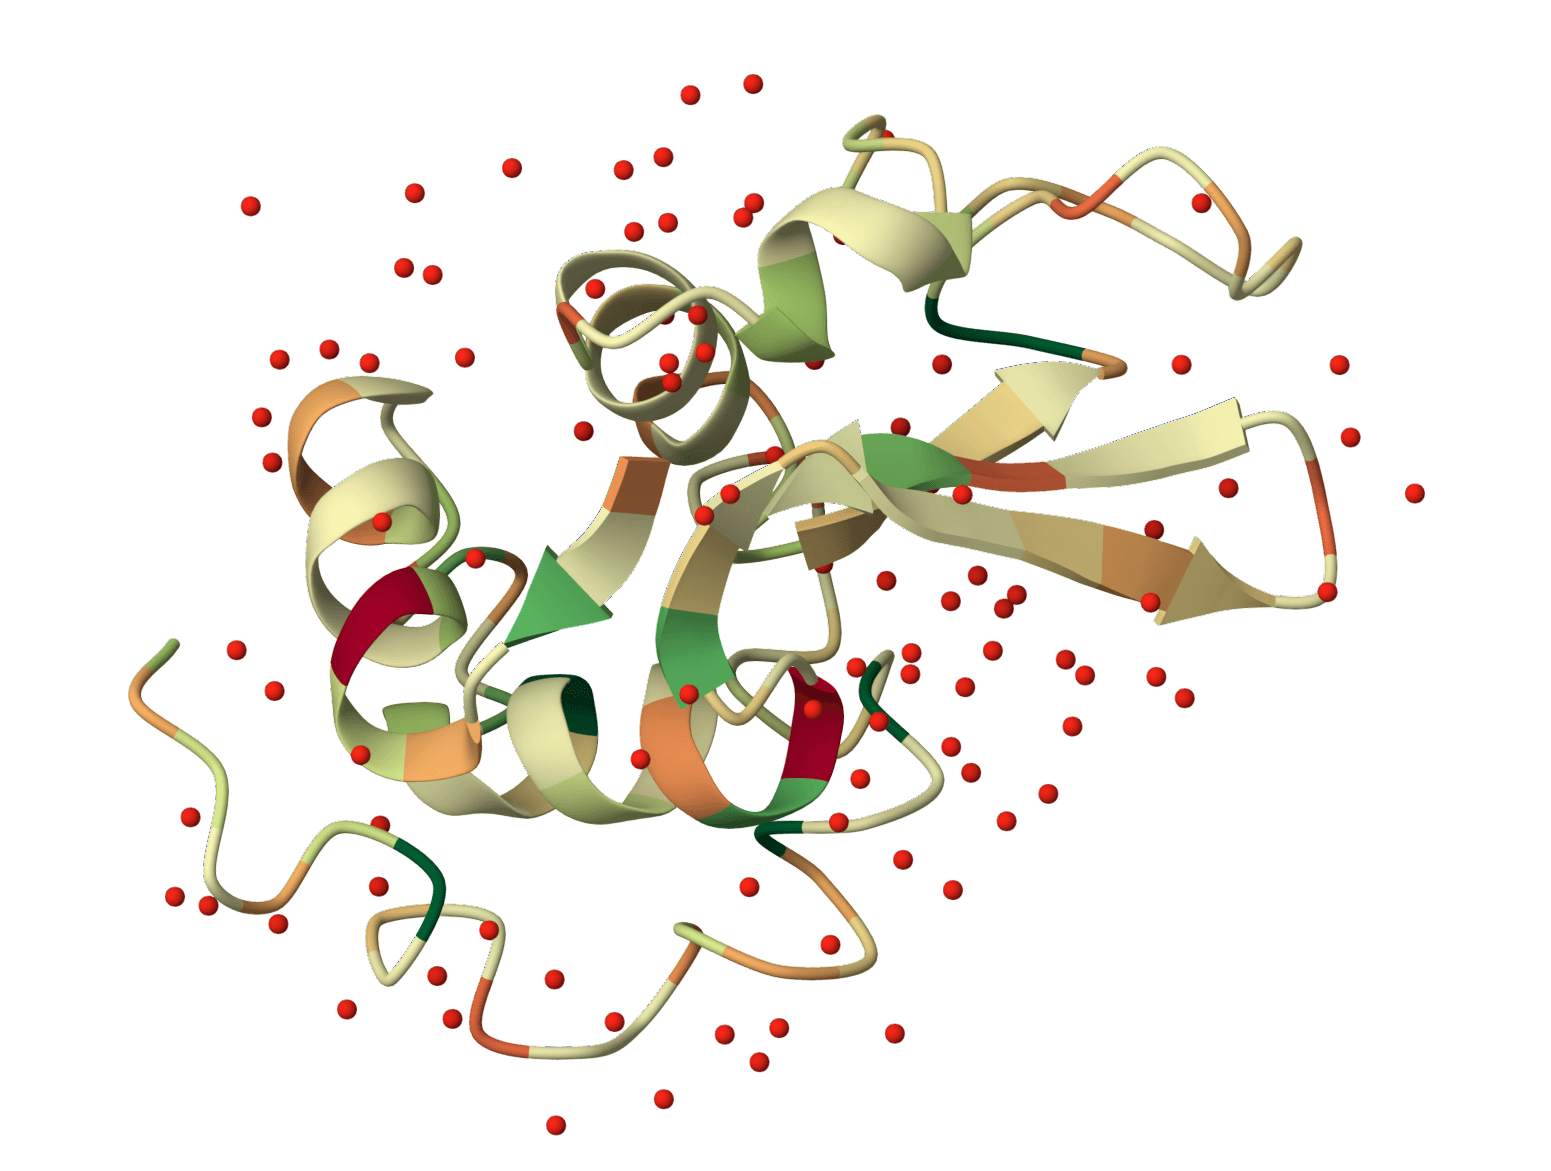
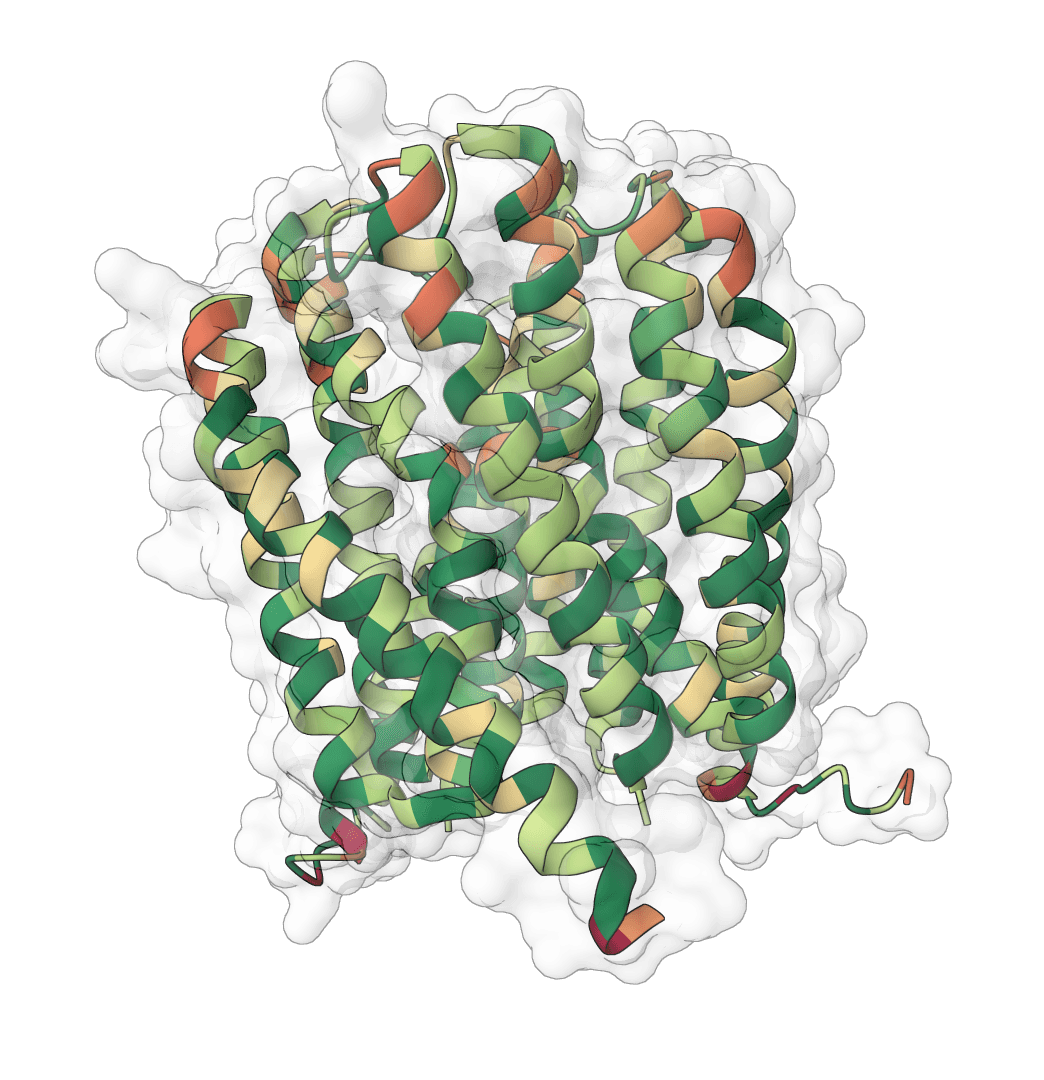
PPAP (Protein-Protein Affinity Predictor) is a deep learning model that predicts binding affinity between protein chains in a complex. Given a PDB structure with two or more protein chains, it estimates the free energy of binding (ΔG) and dissociation constant (Kd) for each pair of interacting chains.
The model combines structural features extracted from the protein interface with sequence representations from ESM2-3B, a large protein language model. An interfacial contact-aware attention mechanism focuses on residue pairs at the binding interface, where interaction strength is primarily determined.
PPAP is designed specifically for protein-protein interactions. For small molecule binding, see molecular docking tools like AutoDock Vina or GNINA.
How does PPAP work?
PPAP integrates two complementary information sources:
- Structural features: The model analyzes contact patterns at the protein-protein interface, including inter-residue distances, surface complementarity, and geometric properties of the binding site.
- Sequence embeddings: ESM2-3B generates contextual representations for each residue based on evolutionary patterns learned from millions of protein sequences. These embeddings capture information about residue function and conservation that pure structure-based methods miss.
The interfacial contact-aware attention mechanism weights residue pairs by their relevance to binding, prioritizing contacts at the interface over distant residues. This architecture allows PPAP to focus on the regions most critical for affinity determination.
On benchmark datasets, PPAP achieved a Pearson correlation of 0.63 on an external test set, outperforming sequence-only language models and comparable structure-based approaches.
How to use PPAP online
ProteinIQ provides GPU-accelerated PPAP predictions directly in the browser. No software installation or command-line experience needed.
Input
| Input | Description |
|---|---|
Protein Complex Structure | PDB file containing at least 2 protein chains. Upload a file or fetch directly from RCSB using a PDB ID (e.g., 1BRS). |
The structure must contain multiple protein chains. Ligands, small molecules, and single-chain structures are not supported.
Settings
Chain analysis
| Setting | Description |
|---|---|
Analyze all chain pairs | When enabled (default), PPAP calculates affinity for every possible pair of chains in the structure. |
Chain pairs to analyze | Manually specify which pairs to analyze. Format: A_B, A_C where the first chain is the receptor and the second is the ligand. For multi-chain partners, concatenate IDs: HL_Y means chains H+L together binding to chain Y. |
Output
Results are returned as a table with one row per chain pair:
| Column | Description |
|---|---|
Chain Pair | The analyzed receptor-ligand pair (e.g., A_B). |
ΔG (kcal/mol) | Predicted Gibbs free energy of binding. More negative values indicate stronger binding. |
Kd | Predicted dissociation constant, derived from ΔG. Lower Kd indicates tighter binding. |
Interpreting results
ΔG (Gibbs free energy)
The binding free energy describes how favorable the interaction is thermodynamically. At physiological conditions:
| ΔG (kcal/mol) | Binding strength |
|---|---|
| < −12 | Very strong (sub-nanomolar) |
| −10 to −12 | Strong (low nanomolar) |
| −7 to −10 | Moderate (nanomolar to micromolar) |
| −5 to −7 | Weak (micromolar) |
| > −5 | Very weak or non-binding |
Kd (dissociation constant)
Kd represents the concentration at which half of the protein is bound. Lower Kd means tighter binding:
| Kd range | Interpretation | Typical examples |
|---|---|---|
| pM (10⁻¹²) | Extremely tight | High-affinity antibodies |
| nM (10⁻⁹) | Strong | Therapeutic antibodies, enzyme inhibitors |
| μM (10⁻⁶) | Moderate | Transient signaling interactions |
| mM (10⁻³) | Weak | Non-specific or transient contacts |
The relationship between ΔG and Kd follows: , where R is the gas constant and T is temperature.
Practical considerations
Predicted affinities are estimates, not experimental measurements. Use them for:
- Ranking: Comparing relative affinities between different chain pairs or mutant complexes
- Screening: Filtering candidates before experimental validation
- Hypothesis generation: Identifying potentially strong or weak interactions for further study
Experimental validation with surface plasmon resonance (SPR), isothermal titration calorimetry (ITC), or similar techniques is recommended for quantitative applications.
Limitations
- Protein-protein only: PPAP does not predict protein-ligand or protein-nucleic acid binding affinities
- Structure required: Predictions require a pre-existing structure; PPAP does not dock proteins
- Static structures: The model uses the input conformation and does not account for conformational changes upon binding
- Training data bias: Performance may vary for interaction types underrepresented in training data (e.g., membrane proteins, intrinsically disordered regions)
Related tools
CleaveNet
Official CleaveNet tool for matrix metalloproteinase cleavage prediction and peptide generation. Predict cleavage z-scores plus uncertainty across 17 MMP variants, evaluate against truth z-scores, or generate candidate peptides unconditionally or from MMP z-score profiles.
OpenFE
Run alchemical free energy calculations for drug discovery using Open Free Energy. Supports Absolute Hydration Free Energy (AHFE) and Relative Binding Free Energy (RBFE) calculations with GPU-accelerated OpenMM simulations.
Aggrescan3D
Faithful static-mode Aggrescan3D tool for per-residue aggregation propensity analysis from a single protein structure.
Boltz-2
Boltz-2 is a biomolecular foundation model for structure and binding affinity prediction. Supports proteins, ligands, DNA, and RNA in multi-component complexes. Automatically scales GPU resources for large complexes. Predicts binding affinity with near-FEP accuracy at 1000x faster speed.
Protein charge plot
Plot net charge vs pH for protein sequences. Visualize how protein charge changes across pH 0-14 and identify the isoelectric point (pI) where the net charge crosses zero.
Chou-Fasman
Predict protein secondary structure using the classic Chou-Fasman algorithm based on amino acid propensities
FindPept
Match experimental peptide masses against theoretical digest fragments of a protein sequence. Identify peptides from mass spectrometry data by peptide mass fingerprinting.
FlowDock
FlowDock predicts protein-ligand complex structures and binding-affinity scores using geometric flow matching.
Hydropathy plot
Generate Kyte-Doolittle hydropathy plots to visualize hydrophobic and hydrophilic regions along protein sequences. Identify transmembrane domains and surface-exposed regions.
Hydrophobicity plot
Generate hydrophobicity plots using 24 different amino acid scales. Visualize hydrophobic and hydrophilic regions for protein analysis, epitope prediction, and membrane protein studies.