Input
5 credits
Output
Configure input settings on the left, then click "Submit job"
PoseBusters validates generated or docked molecular poses with chemically and structurally grounded quality checks for molecular geometry, intermolecular interactions, and optional reference-pose agreement.
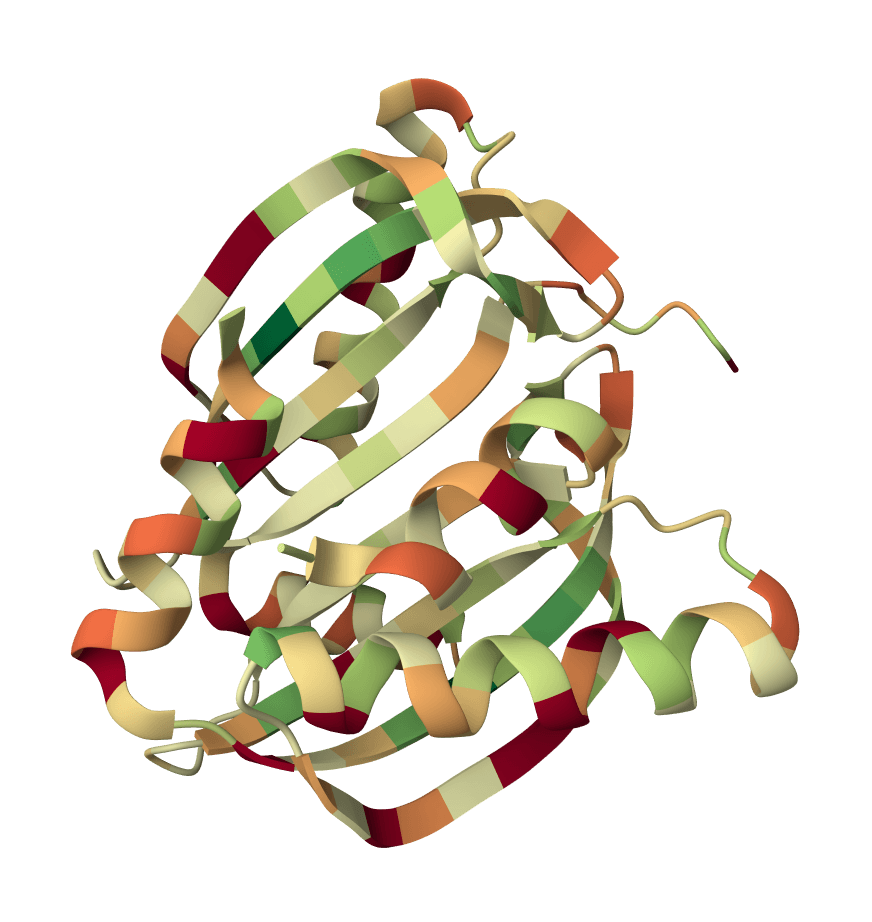
Validate protein structure quality with all-atom contact analysis, Ramachandran plots, rotamer assessment, and geometry checks.
Scoring function for interprotein interactions in AlphaFold2, AlphaFold3 and Boltz predictions. Calculates ipSAE, ipTM, pDockQ, pDockQ2, and LIS scores to assess protein-protein interface quality.
Generate a downloadable PDBsum structural summary report archive for a single protein structure.
Calculate Root Mean Square Deviation (RMSD) between protein structures. Compare a reference PDB against multiple structures with automatic Kabsch alignment.
Calculate GC content, GC/AT skew, melting temperature, and CpG islands for DNA/RNA sequences, with a sliding-window GC plot. Analyze individual sequences or get combined statistics.
Find all Open Reading Frames (ORFs) in DNA sequences. Searches all six reading frames and supports multiple genetic codes.
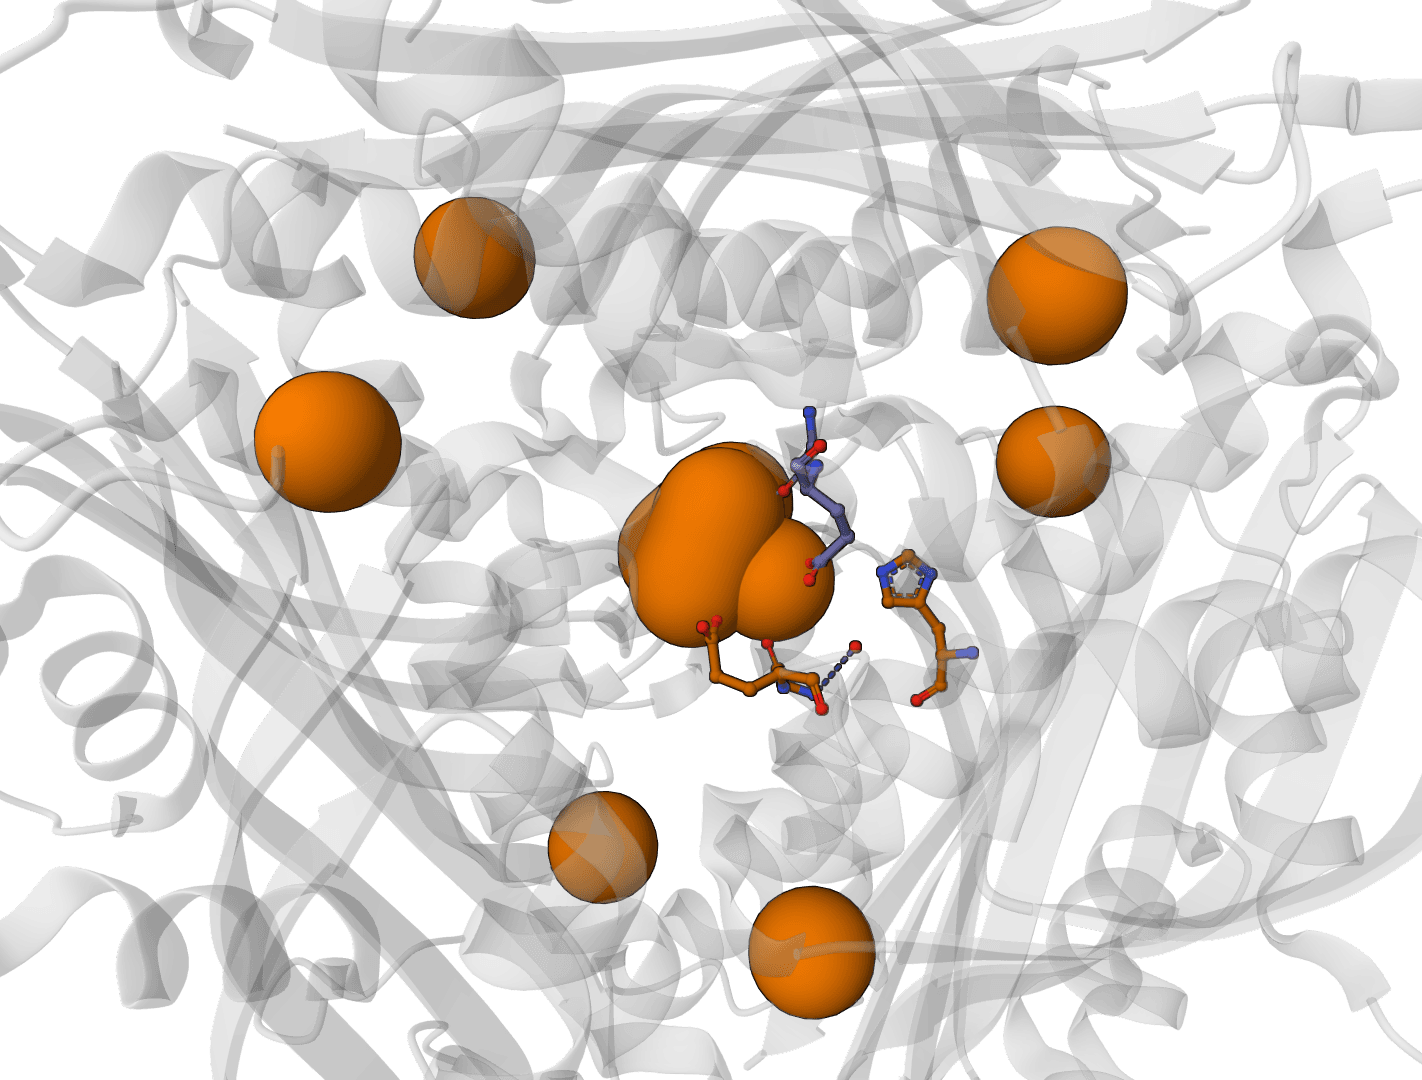
Predict metal and water binding sites in protein structures using 3D convolutional neural networks (AllMetal3D + Water3D).
Assign protein secondary structure using the DSSP algorithm. The gold standard for hydrogen bond-based structure assignment from coordinates.
Calculate the radius of gyration (Rg) for protein structures from PDB files. Supports multiple chains and atom selection options.
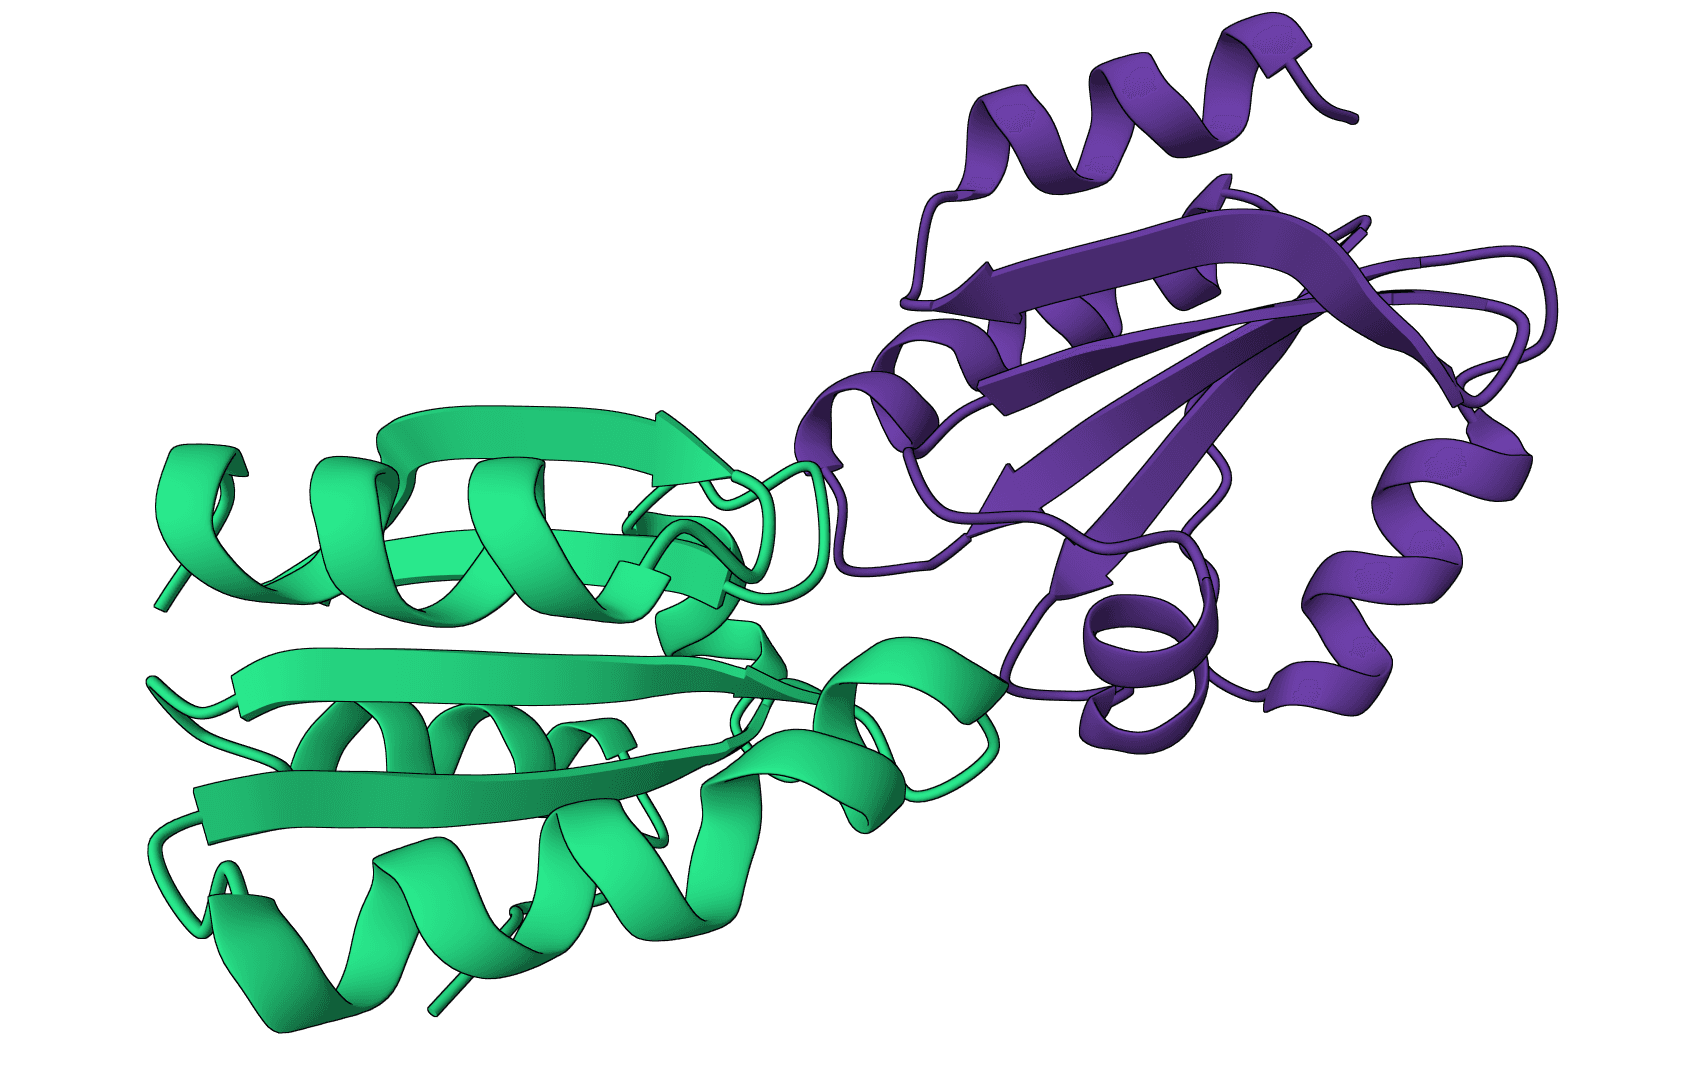
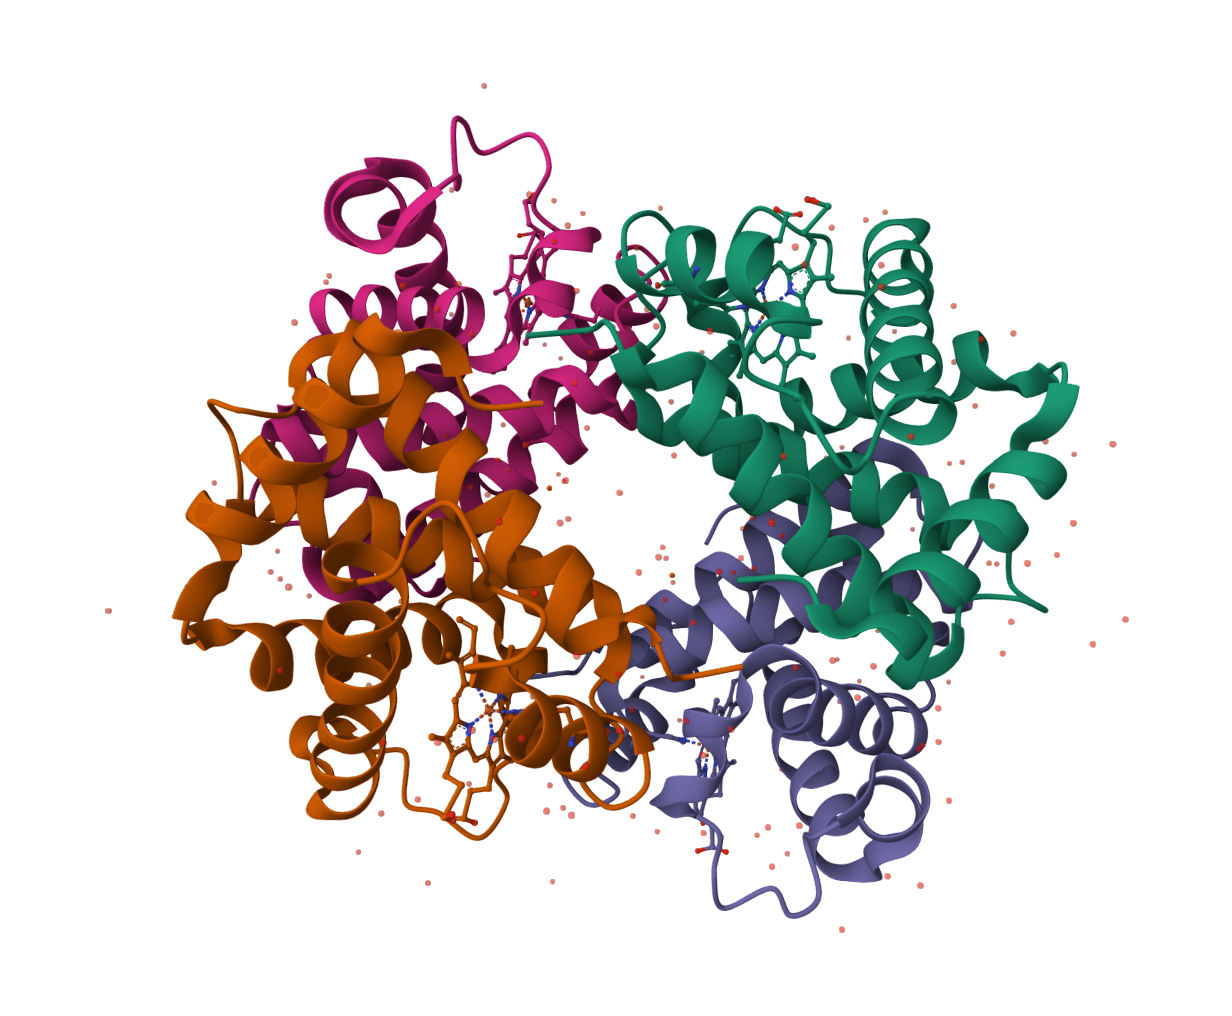
DockQ is a continuous quality measure for evaluating docking models against a native reference structure. It was introduced for protein-protein docking and DockQ v2 extends the same framework to protein-nucleic acid, nucleic-acid, and supported small-molecule interfaces. When you predict how biomolecules interact using tools like AutoDock Vina or DiffDock, DockQ provides a faithful native assessment of how closely the model matches the reference complex.
The key advantage of DockQ over traditional CAPRI criteria is its continuous scale. Instead of coarse classifications like "acceptable" or "medium," DockQ produces a precise score that allows you to rank models, train machine learning algorithms, and track incremental improvements in docking quality.
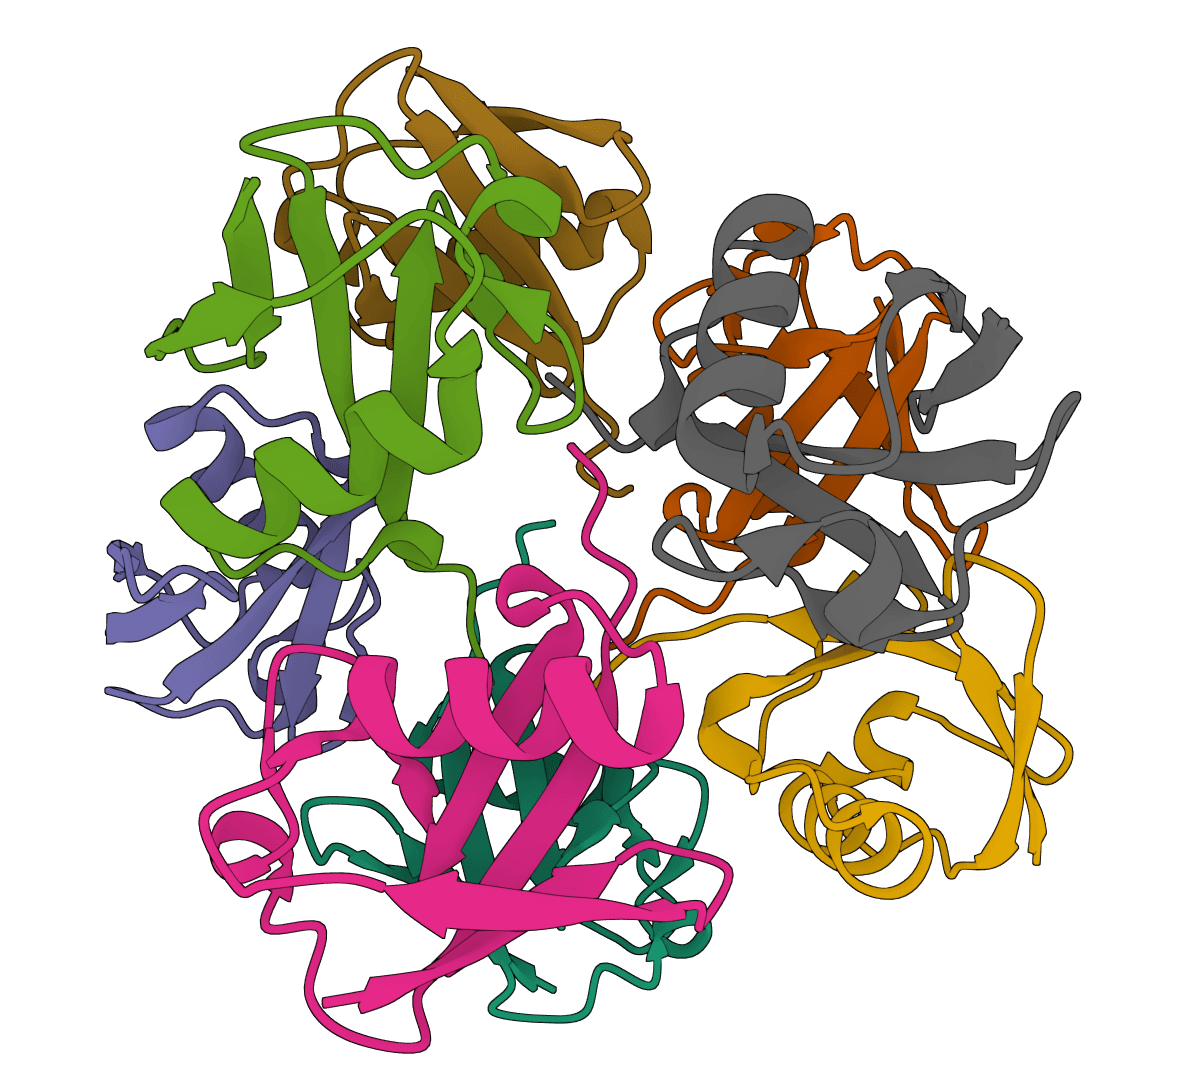
DockQ evaluates all interfaces in your complex simultaneously, making it suitable for multi-chain assemblies, not just binary protein-protein interactions. DockQ v2 also supports protein-nucleic-acid, nucleic-acid, and supported small-molecule interfaces.
DockQ combines three established CAPRI quality measures into a single score using the formula:
Each component captures a different aspect of docking accuracy:
Fraction of native contacts () measures how many of the true interface contacts your model recovers. A contact exists when any atom from one chain is within 5 of any atom from another chain. This metric directly answers: "Did you find the right binding interface?"
Ligand RMSD (LRMSD) measures the positional displacement of the smaller chain (ligand) after superimposing the larger chain (receptor). This captures how well you placed the ligand in 3D space relative to the receptor.
Interface RMSD (iRMSD) measures the RMSD of interfacial residues only, after superimposing the interface atoms. This metric is stricter than LRMSD because it focuses exclusively on the binding region.
Raw RMSD values can range from 0 to infinity, which makes them difficult to combine with (bounded 0-1). DockQ addresses this using inverse square scaling:
The scaling parameters were optimized on a training set of 56,015 docking models:
This scaling smoothly maps large RMSD values toward zero while preserving sensitivity in the accurate range.
DockQ scores map to qualitative categories using thresholds optimized for consistency with CAPRI assessments:
| DockQ range | Classification | Interpretation |
|---|---|---|
| 0.00 - 0.23 | Incorrect | No meaningful similarity to native |
| 0.23 - 0.49 | Acceptable | Correct binding site, some pose errors |
| 0.49 - 0.80 | Medium | Good overall agreement |
| 0.80 - 1.00 | High | Near-native accuracy |
These thresholds achieve 91-97% precision at 90% recall across all quality classes, significantly outperforming the earlier IS-score method (66-71% precision).
DockQ reports metrics for each interface in your complex:
Interface: The chain pair being evaluated (e.g., "A:B" for the interface between chains A and B). Multi-chain complexes produce multiple rows.
DockQ: The combined quality score (0-1). This is your primary metric for ranking models.
Quality: Categorical classification (Incorrect/Acceptable/Medium/High) based on the thresholds above.
iRMSD: Interface RMSD in Angstroms. Values under 1 indicate excellent interface geometry; values above 4 suggest significant structural differences.
LRMSD: Ligand RMSD in Angstroms. Measures global positioning error of the smaller chain. Values under 5 are generally acceptable.
fnat: Fraction of native contacts recovered (0-1). Values above 0.5 indicate the correct binding mode was identified.
fnonnat: Fraction of predicted contacts that are non-native (false positives). Lower is better. High values suggest your model creates artificial contacts.
F1: Harmonic mean of precision and recall for interface contacts. Balances (recall) against the complementary precision measure.
Clashes: Number of interfacial residue pairs with atoms closer than 2 . Non-zero values indicate steric problems in your model.
After docking: Evaluate binding poses from AutoDock Vina, DiffDock, GNINA, or LightDock against a known crystal structure. DockQ helps you select the best pose when multiple candidates exist.
Validating predicted structures: Compare AlphaFold 2 or Boltz-2 complex predictions against experimentally determined structures. DockQ provides more nuanced feedback than simple RMSD calculations.
Benchmarking methods: When developing or comparing docking algorithms, DockQ provides a standardized metric that correlates with CAPRI assessments.
Quality control: Verify that homology models of protein complexes preserve the interface geometry of their templates.
For overall structure comparison (not docking-specific), use our RMSD calculator with Kabsch alignment. For comprehensive single-structure validation including geometry checks, use MolProbity.
DockQ requires two structures in PDB or mmCIF format:
Model structure: Your predicted or docked complex. Must contain all chains involved in the interfaces you want to evaluate.
Native structure: The reference (ground truth) complex. Chain naming doesn't need to match the model—DockQ performs automatic chain mapping.
Both structures should represent the same or highly similar complexes. Sequences do not need to be identical, but significant length differences may affect alignment and chain matching.
By default, DockQ automatically determines the optimal correspondence between model and native chains by maximizing the average DockQ score. This works well when chains are similar length.
For explicit control, use the chain mapping option with format MODEL:NATIVE:
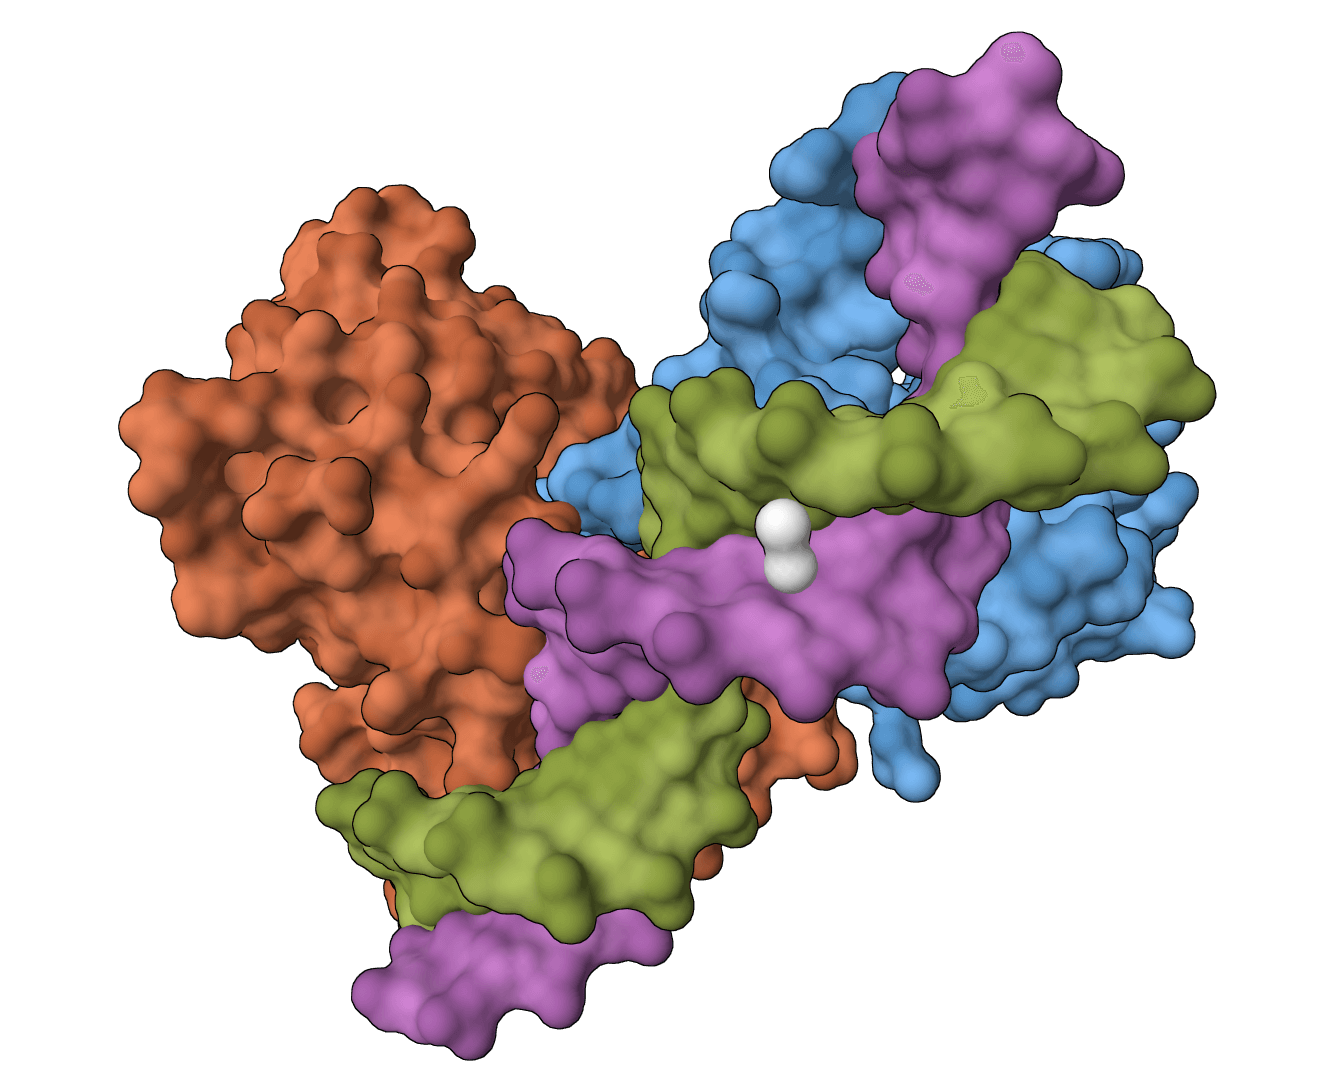
AB:AB - Map model chains A,B to native chains A,BAB:HL - Map model chains A,B to native chains H,L (common for antibodies)A*:W* - Wildcard mapping when chain names differEnable this for evaluating supported small-molecule docking poses. The ligand must already be present in the uploaded PDB or mmCIF file as a separate chain identifier. For hetero interfaces, DockQ primarily reports LRMSD in its CLI output because interface-contact metrics are less informative for small molecules.
Only enable this if your structures are already superimposed in the same coordinate frame. By default, DockQ performs sequence alignment to establish residue correspondence. Skipping alignment uses residue numbering directly, which can fail if numbering differs between structures.
Increases tolerance for sequence differences during chain mapping. Useful when comparing structures with point mutations or slight sequence variations. The default (0) requires exact matches.
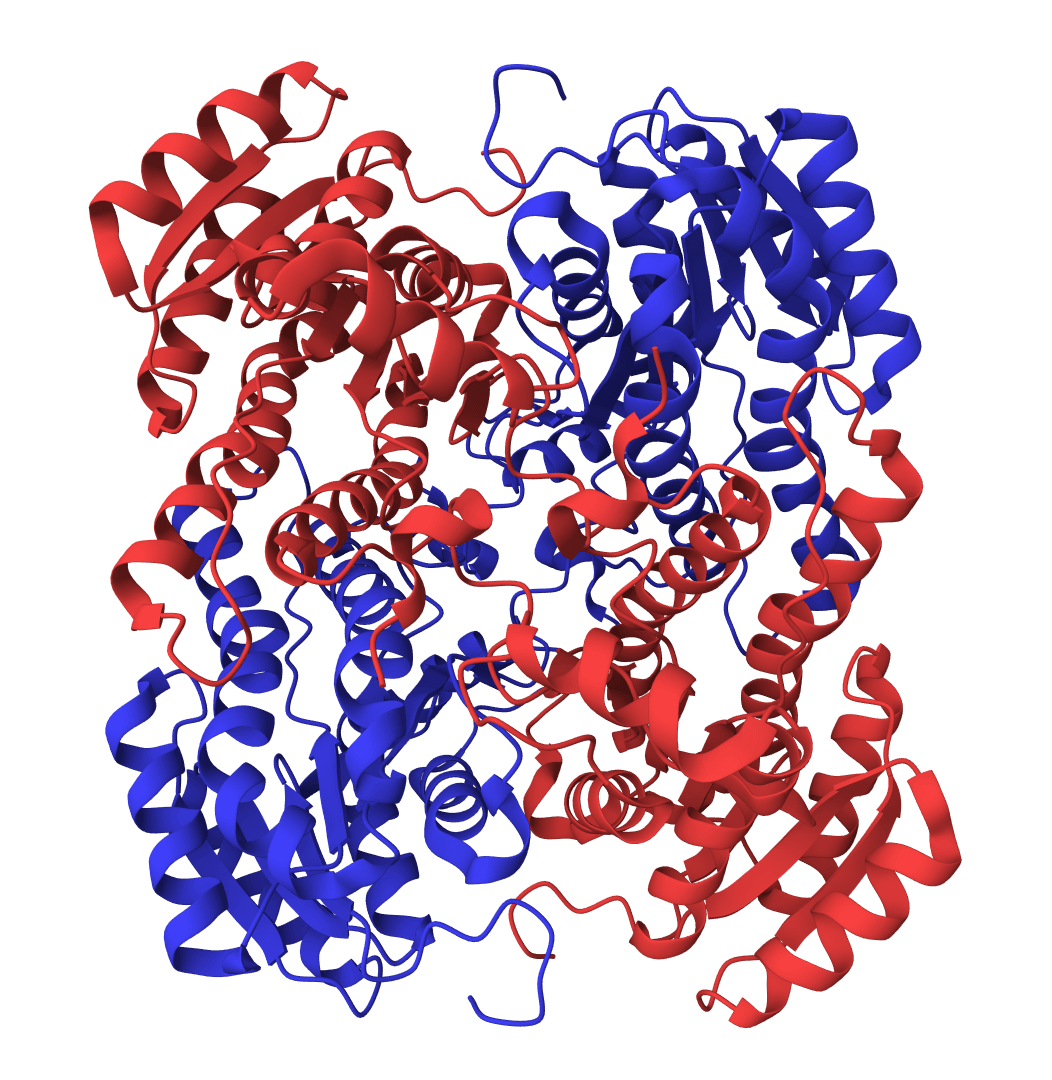
Consider evaluating a docking prediction for the barnase-barstar complex:
"No valid interfaces found": Both structures must have at least two chains in contact. Single-chain structures cannot form interfaces for DockQ to evaluate.
Low DockQ despite visual similarity: Check chain mapping. Automatic mapping may assign chains incorrectly when multiple similar chains exist. Use explicit mapping.
High fnonnat with reasonable DockQ: Your model creates additional contacts not present in the native structure. This often indicates slight rotation or translation of the ligand.
Clashes > 0: Steric clashes indicate physically unrealistic overlap. Consider energy minimization or selecting alternative poses.
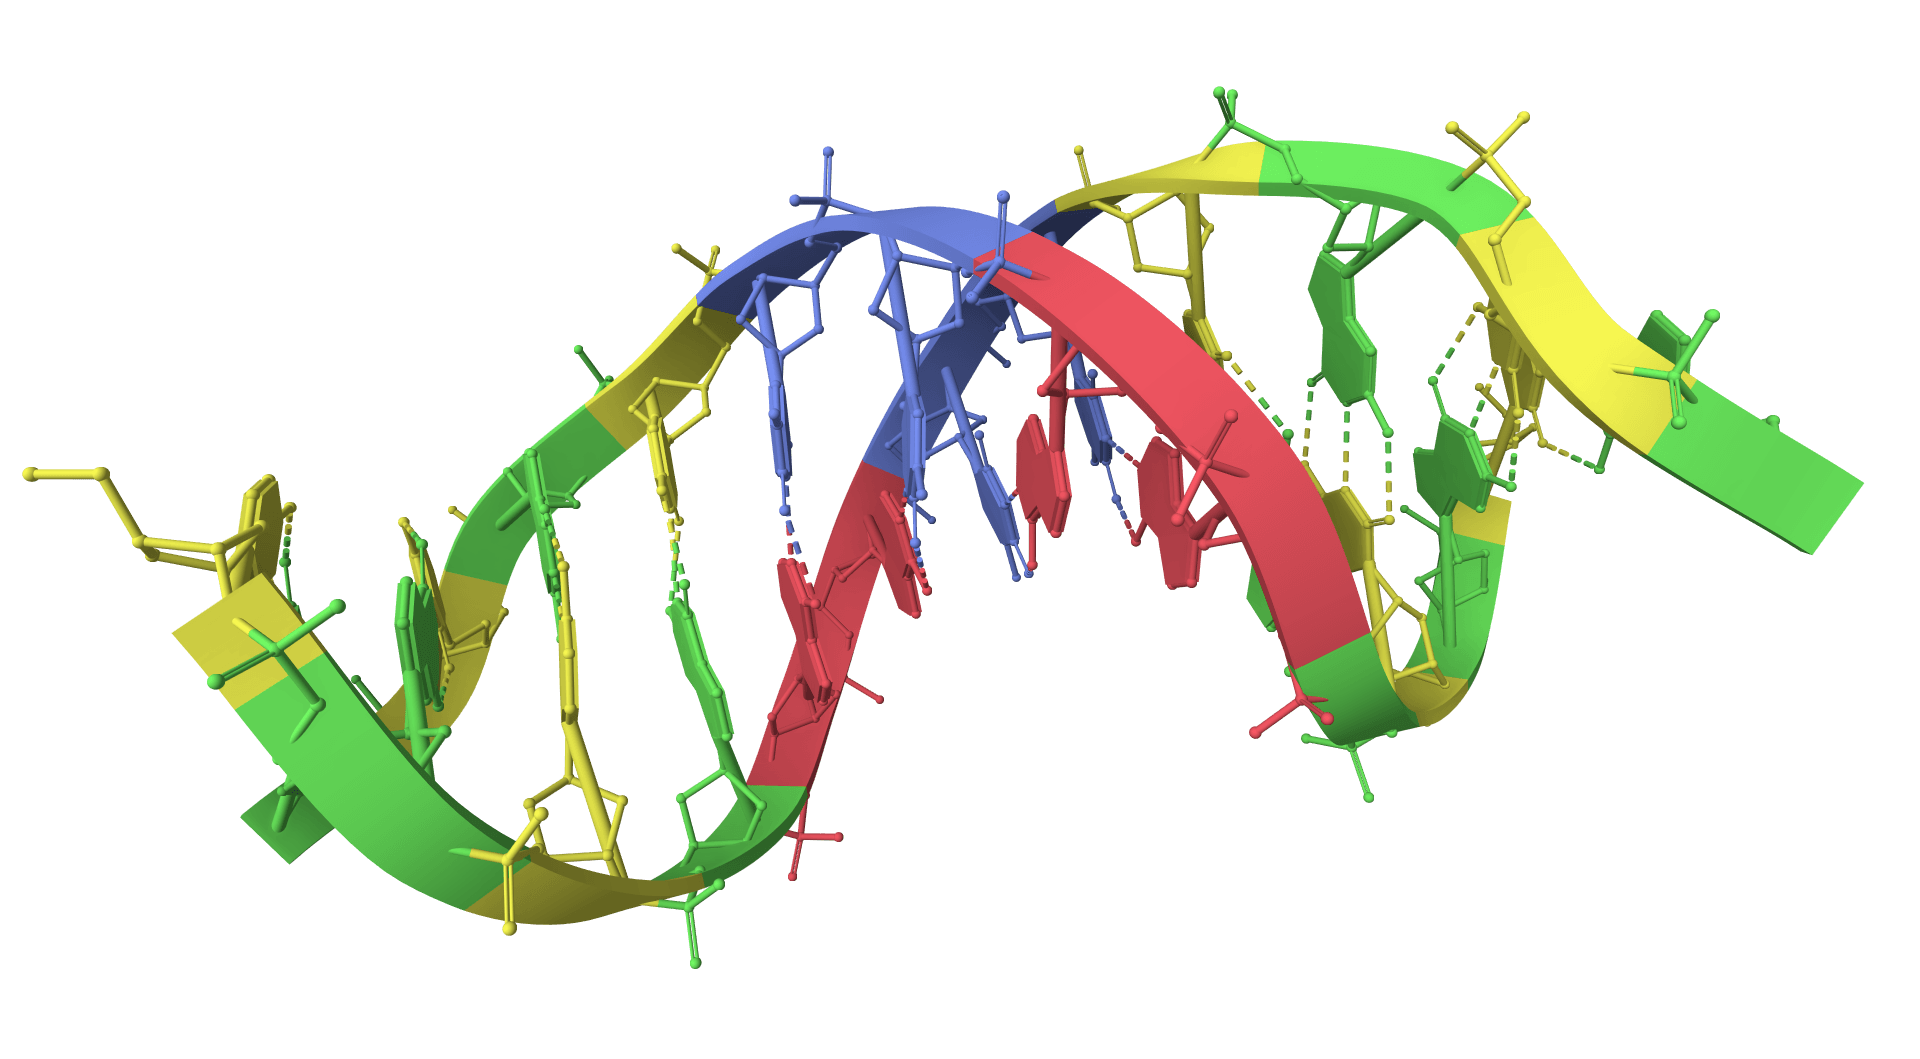
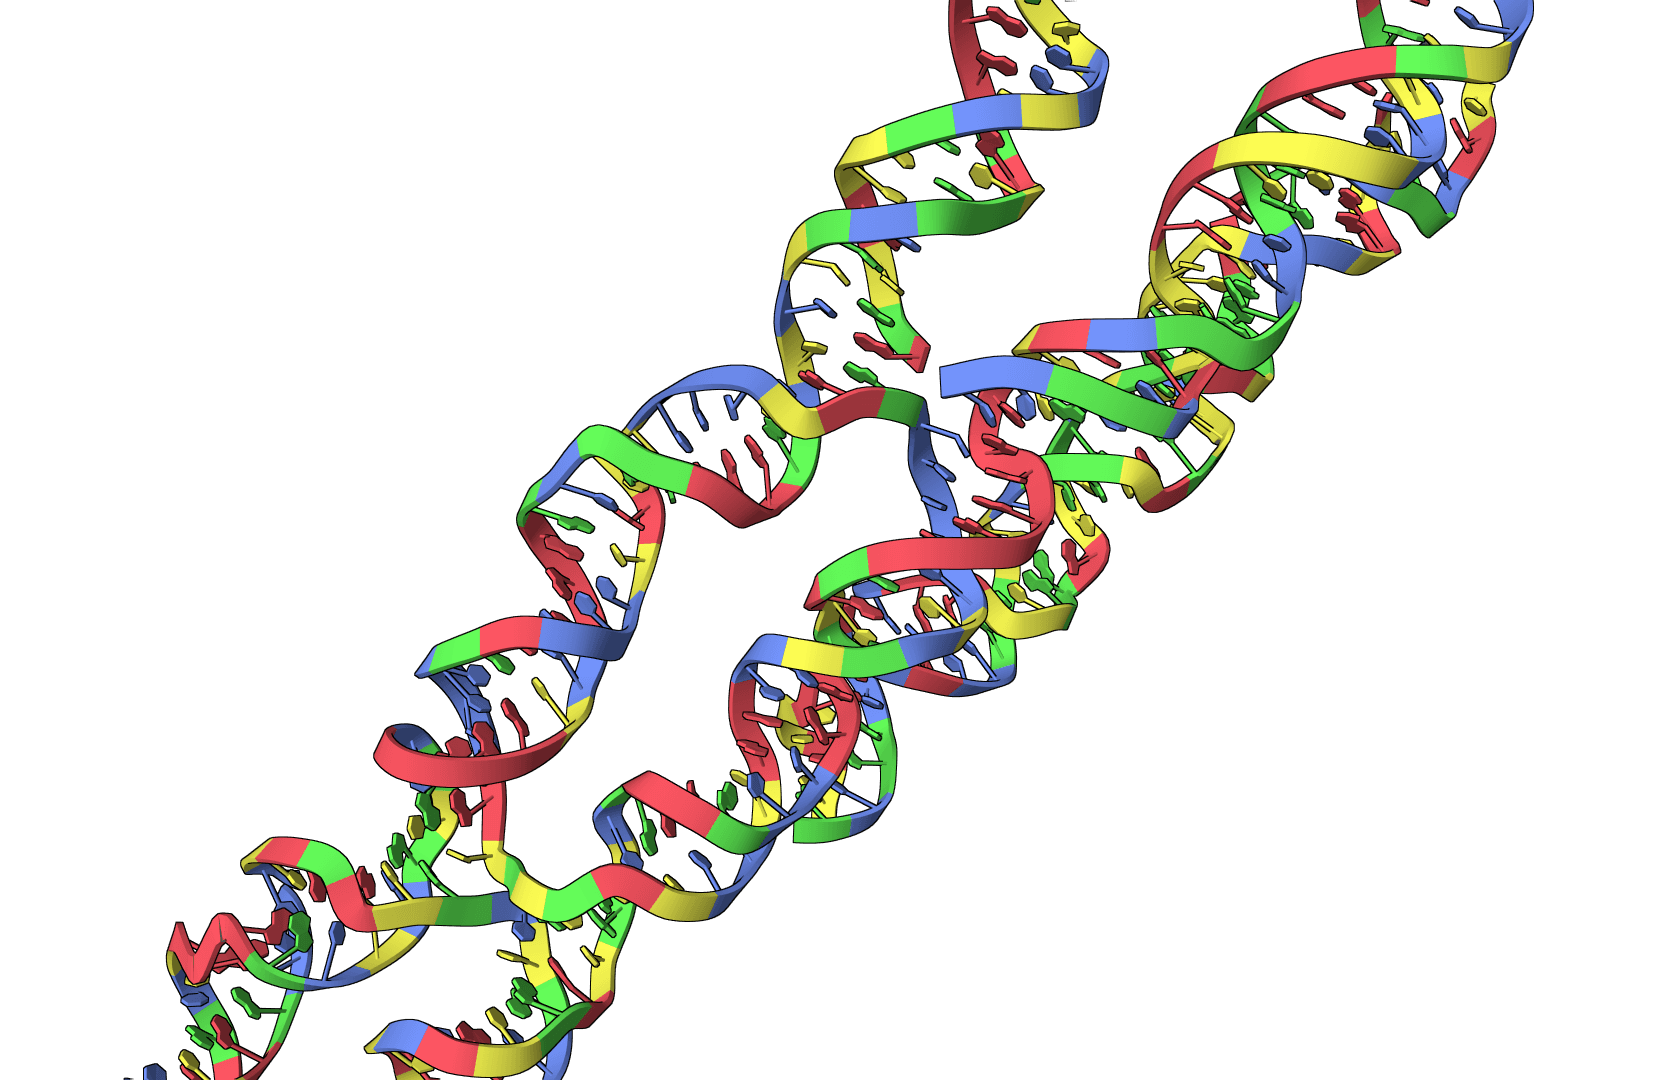
Yes. DockQ v2.1.3, which this tool runs, natively supports protein-nucleic-acid and nucleic-acid interfaces. The same quality thresholds apply, though interpretation still depends on the specific biology of the complex.
Yes, but with caveats. DockQ compares static structures. If your docking protocol included receptor flexibility, the native structure should ideally match the induced-fit conformation, not the unbound receptor.
DockQ automatically tries different chain mappings and reports the one that maximizes the average score. For homodimers, this means it finds the correct subunit correspondence automatically.
For drug discovery applications, aim for DockQ > 0.5 (Medium quality). This typically indicates the correct binding site and approximate pose, sufficient for lead optimization. For structural biology applications requiring atomic-level accuracy, aim for DockQ > 0.8.
No. DockQ requires a reference structure. For ranking docking poses without a native structure, rely on the scoring function from your docking tool (e.g., Vina affinity scores) or consensus approaches.
Basu S, Wallner B. (2016). DockQ: A Quality Measure for Protein-Protein Docking Models. PLoS ONE 11(8): e0161879. DOI: 10.1371/journal.pone.0161879