Input
11 credits
Output
Configure input settings on the left, then click "Submit job"
Assess docking model quality by comparing predicted complexes against native references. DockQ v2.1.3 supports protein, nucleic-acid, and supported small-molecule interfaces with faithful native metrics.
Generate a downloadable PDBsum structural summary report archive for a single protein structure.
Scoring function for interprotein interactions in AlphaFold2, AlphaFold3 and Boltz predictions. Calculates ipSAE, ipTM, pDockQ, pDockQ2, and LIS scores to assess protein-protein interface quality.
PoseBusters validates generated or docked molecular poses with chemically and structurally grounded quality checks for molecular geometry, intermolecular interactions, and optional reference-pose agreement.
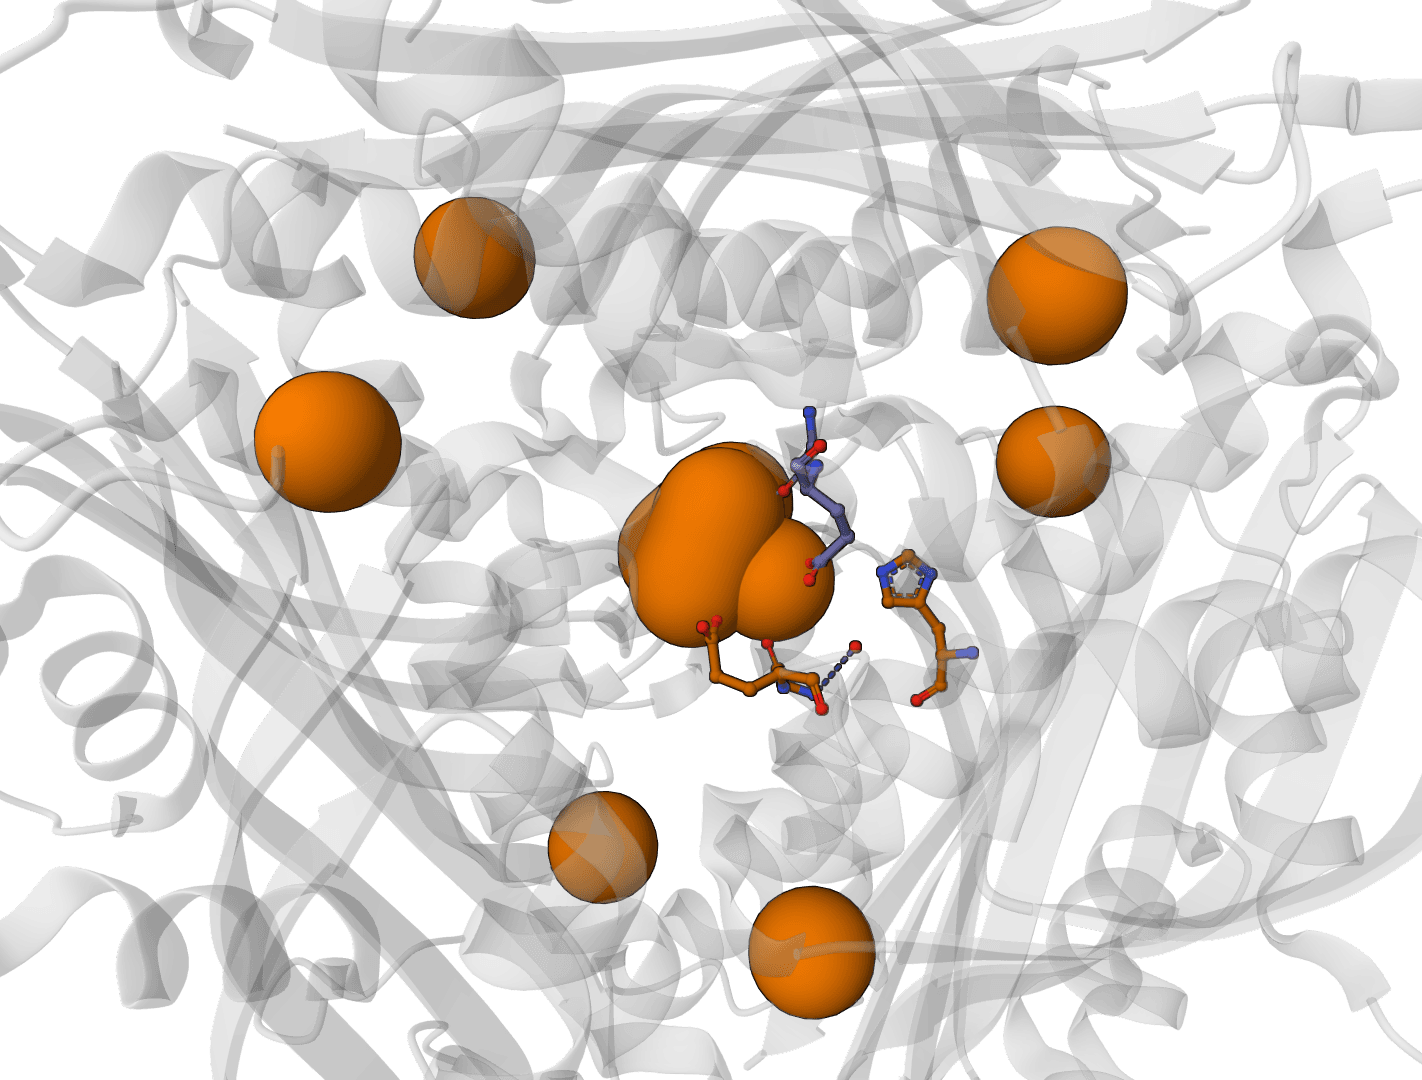
Predict metal and water binding sites in protein structures using 3D convolutional neural networks (AllMetal3D + Water3D).
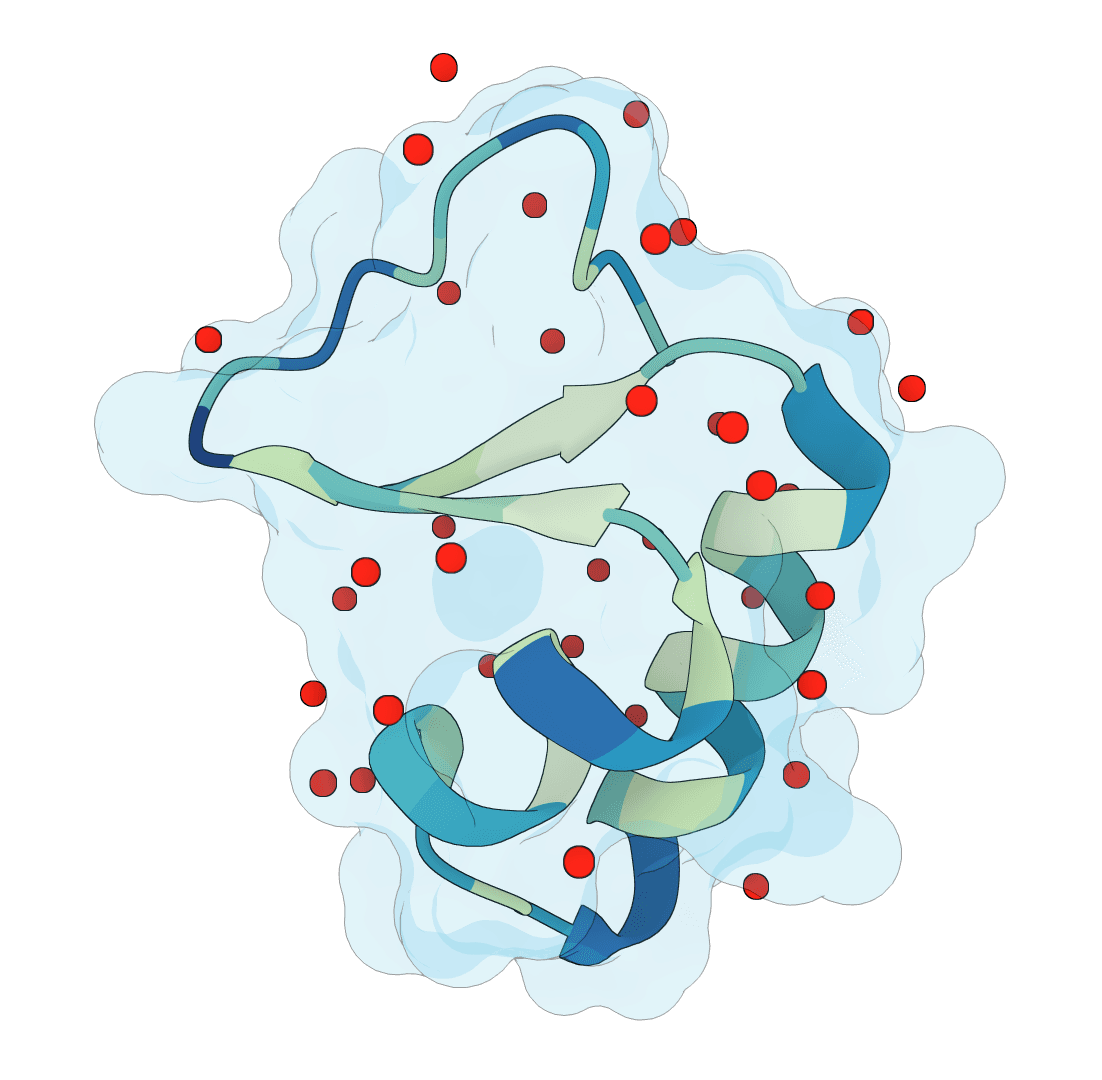
Predict protein hydration sites from a structure using a diffusion model with ESM features and a confidence-filtering head.
Assign protein secondary structure using the DSSP algorithm. The gold standard for hydrogen bond-based structure assignment from coordinates.
Calculate the radius of gyration (Rg) for protein structures from PDB files. Supports multiple chains and atom selection options.
Calculate Root Mean Square Deviation (RMSD) between protein structures. Compare a reference PDB against multiple structures with automatic Kabsch alignment.
Calculate Solvent Accessible Surface Area (SASA) for protein structures using the Shrake-Rupley algorithm.
MolProbity is a comprehensive structure validation tool that assesses protein and nucleic acid quality through all-atom geometry analysis. Rather than just checking if atoms fit the electron density map, MolProbity examines whether atoms are physically positioned correctly relative to each other, detecting steric clashes, backbone geometry problems, and sidechain conformational errors that even high-resolution crystallography can miss.
Structure validation is essential before using a protein model for downstream analysis or design work. A structure with poor geometry may look reasonable in electron density but contain atomic overlaps or distortions that lead to incorrect functional predictions. MolProbity combines multiple quality metrics into a single, interpretable framework that catches both obvious errors and subtle geometric inconsistencies, and is widely used during structure refinement as well as for assessing confidence in predicted models from AlphaFold2, Boltz-2, or experimental methods.
Upload a PDB or mmCIF structure file to ProteinIQ, or enter an RCSB PDB ID to fetch directly from the Protein Data Bank, and receive a full MolProbity validation report in seconds. Results include headline quality metrics covering clashscore, Ramachandran analysis, rotamer outliers, C-beta deviations, CaBLAM backbone analysis, Ramachandran Z-score, omega/cis-peptide assessment, bond geometry, and the composite MolProbity Score. Residue-level outliers are shown in a separate table, and downloadable files include summary CSV, outlier CSV, the full MolProbity text report, Probe output when generated, and a Coot script when available.
| Input | Description |
|---|---|
Protein Structure | PDB file (.pdb, .ent), mmCIF file (.cif, .mmcif), or RCSB PDB ID (e.g., 1UBQ). Maximum 50 MB. |
The structure must contain valid atomic coordinates. For proteins, all backbone atoms (N, Cα, C, O) should be present for reliable analysis. Structures with missing backbone atoms will have reduced validation detail.
MolProbity returns a metrics spreadsheet, an outliers spreadsheet, and a Files tab. The metrics table summarizes overall structure quality. The outliers table lists flagged residues or atoms from Ramachandran, rotamer, omega, clash, C-beta, CaBLAM, geometry, and RNA checks when present. The Files tab includes downloadable CSV exports and source-style MolProbity artifacts for detailed inspection.
MolProbity performs several independent geometric analyses that together provide a comprehensive view of structure quality. Each metric targets different types of structural problems.
The clashscore measures severe steric overlaps where nonbonded atoms come within 0.4 Å of each other, penetrating well into forbidden van der Waals space. These are not minor geometric strains but actual atomic collisions that signal local fitting errors or mistakes in atomic coordinate assignment.
MolProbity counts all such clashes and normalizes to per-thousand atoms, making scores comparable across different protein sizes. A clashscore of 0 is excellent; clashscores above 10 indicate problematic regions. Well-built structures typically average well below 5 per thousand atoms.
The backbone of a protein is defined by three dihedral angles: phi (φ), psi (ψ), and omega (ω). Omega is nearly always 180° due to partial double-bond character in the peptide bond. Phi and psi are free to rotate, but only certain combinations avoid atomic clashes.
MolProbity evaluates each residue's φ/ψ angles against a modern reference distribution derived from nearly a million high-quality reference residues. Residues are classified as:
The tool applies residue-specific distributions because glycine (no sidechain) has much broader allowed regions, while proline (cyclic sidechain) is severely restricted to φ ≈ -60°.
Sidechains adopt discrete rotameric conformations where chi (χ) dihedral angles cluster around staggered orientations (±60°, 180°). These rotamers are energetically favorable because they minimize clash between the sidechain and backbone.
MolProbity classifies each sidechain rotamer as:
Glycine (no sidechain) and alanine (sidechain too small to adopt rotamers) are excluded from this analysis.
C-beta deviation measures how far the observed C-beta position strays from the ideal geometry predicted from backbone (N, Cα, C) coordinates. Large deviations suggest problems with local backbone geometry or sidechain modeling.
The omega dihedral angle describes the peptide bond between consecutive residues. Trans conformations (~180°) are overwhelmingly dominant; cis conformations (~0°) are rare and almost exclusively found at proline residues. Twisted peptides (between cis and trans) are always problematic.
MolProbity counts cis-prolines (often genuine and functionally important), cis-nonproline residues (rare and usually modeling errors), and twisted peptide bonds (always flagged). A cis-nonproline or twisted peptide almost always indicates an error requiring attention.
MolProbity validates how closely observed bond lengths and angles match ideal reference values. Deviations are reported as RMSD (root mean square deviation) across all bonds and angles. Bond length RMSD below 0.02 Å and angle RMSD below 2.0° indicate well-refined geometry. Larger deviations suggest over-fitting, under-refinement, or genuine structural strain.
The Rama-Z score quantifies how well the overall distribution of backbone phi/psi angles matches expected patterns from high-quality reference structures. Unlike the percentage-based Ramachandran analysis (which flags individual outliers), Rama-Z evaluates the whole distribution shape. A Z-score with absolute value below 2 is normal; between 2 and 3 is suspicious; above 3 indicates systematic backbone problems.
CaBLAM (Contiguous Alpha-helix and Beta-strand Likelihood-based Assessment of backbone Motifs) evaluates backbone conformation using only Cα and carbonyl positions rather than full backbone dihedrals. Because it does not depend on precise atom placement, CaBLAM stays informative at low resolution and on predicted models where Ramachandran analysis can be misleading.
MolProbity reports three CaBLAM numbers: outliers (backbone conformations not seen in quality reference structures), disfavored (unusual but not outright outliers), and CA geometry outliers (Cα trace problems independent of carbonyl placement). CaBLAM is especially useful for cryo-EM structures and AlphaFold2 or Boltz-2 models.
MolProbity combines clashscore, Ramachandran favored percentage, and rotamer outlier percentage into a single score that approximates the resolution at which such quality would be average for deposited structures. The formula weights clashscore most heavily. A score around 1.0 represents quality typical of ~1 Å crystal structures; 2.0 is typical at ~2 Å resolution.
Each metric includes a status flag:
Metrics without a defined threshold show Info, and metrics that could not be computed show N/A.
| Metric | Excellent | Good | Outlier |
|---|---|---|---|
| Clashscore | ≤5 | 5-20 | >20 |
| Ramachandran favored | ≥98% | 95-98% | <95% |
| Ramachandran outliers | ≤0.2% | 0.2-1% | >1% |
| Rotamer outliers | ≤1% | 1-4% | >4% |
| C-beta deviations | 0 | 1-5 | >5 |
| CaBLAM outliers | ≤1% | 1-5% | >5% |
| CaBLAM CA outliers | ≤0.5% | 0.5-2% | >2% |
| MolProbity Score | ≤1.5 | 1.5-2.5 | >2.5 |
| Rama-Z absolute value | <2 | 2-3 | ≥3 |
| Bond length RMSD | ≤0.02 Å | 0.02-0.03 Å | >0.03 Å |
| Bond angle RMSD | ≤2.0° | 2.0-3.0° | >3.0° |
MolProbity flags specific residues with problems, including Ramachandran outliers, rotamer outliers, and cis/twisted peptides. A downloadable outlier CSV is available when outliers are found. Always examine flagged residues visually in a structure viewer. Some indicate genuine errors requiring correction; others reflect catalytic residues or binding sites under conformational stress.
Rotamer outliers in hydrophobic cores likely represent errors; outliers at protein surfaces or binding sites may be functionally important. Cis-nonproline peptides (<0.05% of nonproline bonds are genuinely cis) and twisted peptides should always be inspected.
MolProbity works exceptionally well for crystal structures at 1.5-3.0 Å resolution where atomic positions are well-determined. For cryo-EM structures or low-resolution models, interpretation requires more caution.
Good uses include validating crystal structures, assessing quality of predicted structures from AlphaFold2 or Boltz-2, identifying problematic regions during refinement, and comparing multiple conformational states.
At very low resolution (>4 Å), geometric metrics become less informative because electron density ambiguity itself can cause apparent clashes or deviations. For designed proteins or synthetic sequences with no evolutionary precedent, some metrics may be overly strict.
When validating structures predicted by ML models, expect slightly different patterns than experimental structures. Predicted models often show fewer rotamer outliers (models are smoother) but may have unusual backbone angles in flexible regions. MolProbity's detailed feedback helps identify regions to trust versus regions requiring additional analysis.