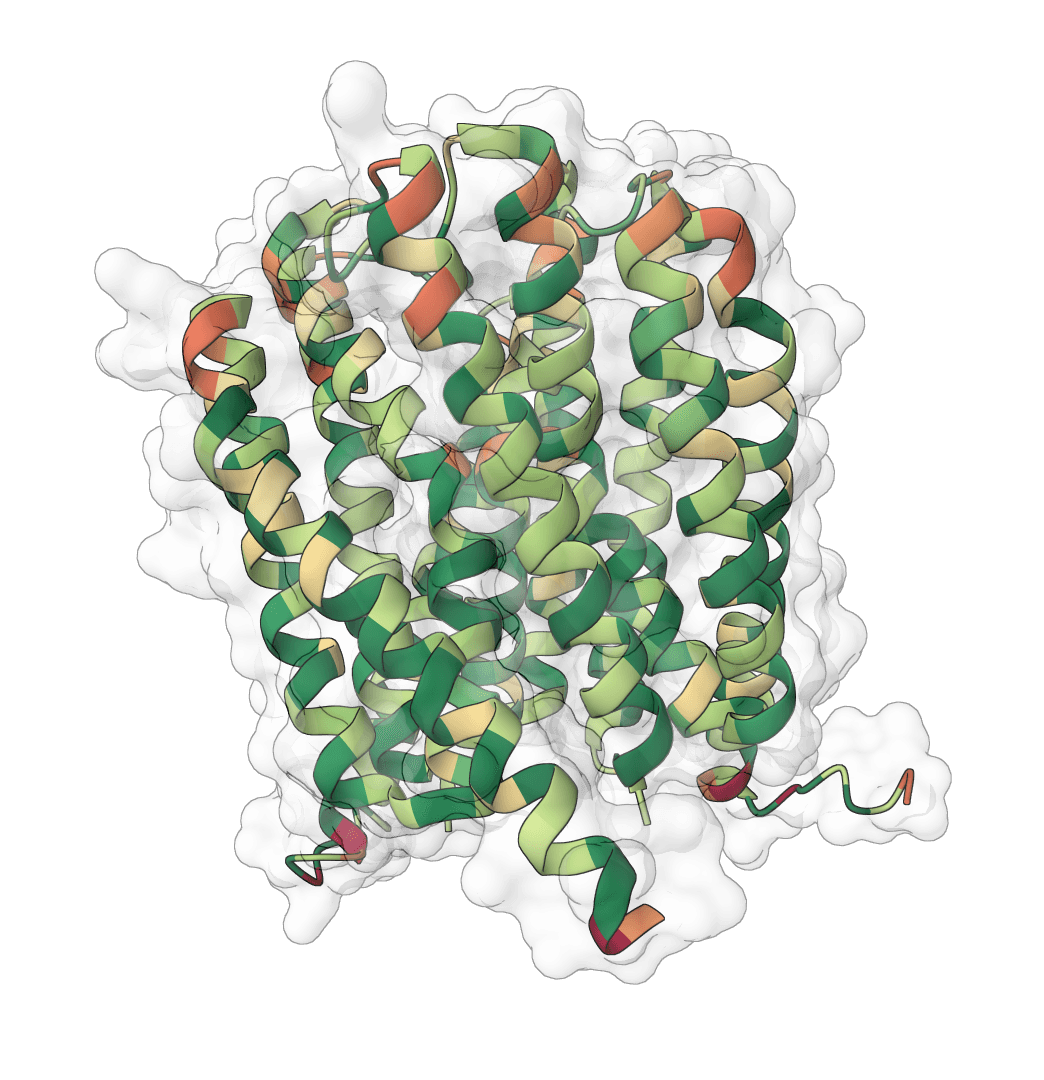
What are protein parameters?
Protein parameters are quantitative biochemical properties calculated from amino acid sequences to characterize protein behavior. These computational metrics include molecular weight, isoelectric point, stability indices, and hydrophobicity measures that provide insights into protein structure and function.
Parameters are derived from primary sequence data using established algorithms based on individual amino acid contributions. The calculations encompass several categories:
- Physical properties: molecular weight, atomic composition, and size characteristics
- Electrochemical properties: isoelectric point, net charge at physiological pH
- Stability measures: instability index, aliphatic index for thermostability
- Hydrophobicity measures: GRAVY score, hydrophobic moment calculations
- Spectroscopic properties: extinction coefficients (reduced and oxidized), absorbance characteristics
- Compositional properties: aromaticity, secondary structure fractions (helix, turn, sheet)
Prediction reliability depends on experimental data quality used in computational models. Most algorithms utilize experimental datasets from the 1960s-1990s, with periodic refinements from newer structural data.
Molecular weight
Molecular weight is the total mass of a protein molecule, expressed in Daltons (Da) or kilodaltons (kDa). It equals the sum of all amino acid residue masses plus 18.015 Da for the water molecule accounting for free amino and carboxyl termini.
The molecular weight follows this formula:
where is the total number of amino acids and represents the mass of the -th amino acid residue.
Standard atomic masses follow IUPAC atomic weights. Non-standard amino acids or post-translational modifications require manual mass corrections.
Molecular weight applications include SDS-PAGE migration prediction, mass spectrometry interpretation, enzyme assay calculations, and size-exclusion chromatography profiling.
Atomic composition
Atomic composition counts carbon, hydrogen, nitrogen, oxygen, and sulfur atoms in the protein, yielding the empirical chemical formula and elemental ratios for biophysical techniques.
Key ratios include nitrogen-to-carbon (N/C), correlating with basic amino acids, and sulfur content reflecting cysteine and methionine residues. These ratios support isotope labeling experiments and elemental analysis.
Isoelectric point
The isoelectric point (pI) is the pH at which a protein has zero net charge. Below pI, proteins are positively charged through protonation of basic residues (lysine, arginine, histidine). Above pI, proteins become negatively charged as acidic residues (aspartic acid, glutamic acid) lose protons.
The pI calculation applies the Henderson-Hasselbalch equation to all ionizable groups:
Amino acids contribute via established pKa values: aspartic acid (3.9), glutamic acid (4.3), histidine (6.0), cysteine (8.3), tyrosine (10.9), lysine (10.5), and arginine (12.5). N-terminal amino groups (pKa ~9.6) and C-terminal carboxyl groups (pKa ~2.3) also affect charge.
Isoelectric point knowledge is essential for purification strategies. Ion-exchange chromatography, isoelectric focusing, and crystallization depend on accurate pI predictions. Proteins show minimum solubility at pI due to reduced electrostatic repulsion.
Net charge at physiological pH
Net charge at pH 7.0 represents protein electrostatic character under physiological conditions, influencing protein interactions, membrane association, localization, and enzymatic activity. Positively charged proteins interact with nucleic acids or phospholipids, while negatively charged proteins associate with metal ions or basic proteins.
Instability index
The instability index predicts cellular protein stability through dipeptide composition analysis. It assigns Dipeptide Instability Weight Values (DIWV) to all 400 amino acid pairs based on experimental in vivo half-life data.
The calculation follows:
where represents protein length, indicates the amino acid at position , and represents the instability contribution of each adjacent pair.
Values below 40 indicate stability; above 40 suggests instability. This threshold distinguishes proteins with half-lives under 5 hours (unstable) from those exceeding 16 hours (stable).
Interpretation requires considering protein localization, post-translational modifications, and cellular context, which significantly influence biological stability.
Aliphatic index
The aliphatic index quantifies relative volume of aliphatic amino acids (alanine, valine, isoleucine, leucine) as a thermostability indicator. Higher values correlate with thermal stability through enhanced hydrophobic interactions at elevated temperatures.
The calculation assigns differential weights to each aliphatic residue:
where represents the mole percent of each amino acid, with empirical coefficients and reflecting relative thermostability contributions.
Applications include thermostable enzyme engineering and studying high-temperature adaptations. Thermophilic proteins consistently show higher aliphatic indices than mesophilic counterparts, enabling optimal temperature prediction.
GRAVY score
The Grand Average of Hydropathicity (GRAVY) quantifies protein hydrophobic character by averaging Kyte-Doolittle hydropathy values across all amino acids.
where is the protein length and represents the hydropathy value of amino acid .
GRAVY ranges from -2.0 (hydrophilic) to +2.0 (hydrophobic):
- > +1.0: Integral membrane proteins with transmembrane domains
- 0 to +1.0: Mixed regions, often peripheral membrane proteins
- < 0: Soluble hydrophilic proteins, typically cytoplasmic enzymes
- < -1.0: Highly soluble proteins in transport or signaling
GRAVY scores predict localization, membrane association, and purification behavior.
Aromaticity
Aromaticity measures the fraction of aromatic amino acids (phenylalanine, tryptophan, tyrosine) in a protein sequence. It is calculated as the sum of the mole percentages of F, W, and Y residues, following the method described by Lobry (1994).
where is the total sequence length. Values typically range from 0.05 to 0.15 for globular proteins. High aromaticity correlates with UV absorbance intensity and contributes to hydrophobic core formation and protein–protein interaction interfaces.
Secondary structure fractions
Secondary structure fractions estimate the proportion of amino acids associated with helix, turn, and sheet conformations based on residue propensities. Unlike Chou-Fasman prediction, which applies sliding-window algorithms to predict per-residue structure, this method simply groups amino acids by their general structural tendency:
| Structure | Amino acids |
|---|---|
| Helix | V, I, Y, F, W, L |
| Turn | N, P, G, S, D |
| Sheet | E, M, A, L, K |
Each fraction equals the sum of mole percentages for that group's amino acids. Note that leucine (L) appears in both helix and sheet groups, so the three fractions do not sum to 1.0. Amino acids not listed (R, C, Q, H, T) do not contribute to any fraction.
These fractions provide a quick compositional indicator of structural tendency rather than a positional prediction.
Extinction coefficients
Extinction coefficients quantify 280 nm light absorption for spectrophotometric concentration determination, depending primarily on aromatic amino acids (tryptophan, tyrosine) and disulfide-bonded cysteine.
Two coefficients account for cysteine oxidation states:
- Reduced: All cysteines as free thiols
- Oxidized: Complete disulfide bond formation
The calculation employs established molar absorptivity constants:
where represents the number of each residue type and coefficients are expressed in M⁻¹cm⁻¹.
Extinction coefficients enable Beer-Lambert law () application for concentration determination in enzyme kinetics, interaction assays, and biochemical analysis. Coefficient choice depends on disulfide status, confirmed by DTNB assay or mass spectrometry.
Related tools
Aggrescan3D
Faithful static-mode Aggrescan3D tool for per-residue aggregation propensity analysis from a single protein structure.
Protein charge plot
Plot net charge vs pH for protein sequences. Visualize how protein charge changes across pH 0-14 and identify the isoelectric point (pI) where the net charge crosses zero.
FindPept
Match experimental peptide masses against theoretical digest fragments of a protein sequence. Identify peptides from mass spectrometry data by peptide mass fingerprinting.
Hydropathy plot
Generate Kyte-Doolittle hydropathy plots to visualize hydrophobic and hydrophilic regions along protein sequences. Identify transmembrane domains and surface-exposed regions.
Hydrophobicity plot
Generate hydrophobicity plots using 24 different amino acid scales. Visualize hydrophobic and hydrophilic regions for protein analysis, epitope prediction, and membrane protein studies.
Peptide cutter
Predict protease and chemical cleavage sites across a protein sequence for up to 39 enzymes simultaneously. Identify where each enzyme cuts, the cleavage residue, and context window around each site.
Peptide mass calculator
Cleave a protein sequence with a chosen protease and compute the masses of the resulting peptides. Supports multiple enzymes, missed cleavages, chemical modifications, and different ion types for mass spectrometry experiment planning.
PROPKA 3
Predict pKa values of ionizable groups in proteins and protein-ligand complexes from 3D structure. PROPKA calculates environment-driven pKa shifts for standard ionizable residues, terminal groups, and supported ligand atom types.
Protein scale profiler
Generate amino acid property profiles using 42 different scales spanning hydrophobicity, secondary structure propensity, flexibility, polarity, surface accessibility, antigenicity, and more.
IPC 2.0 (isoelectric point calculator)
Isoelectric Point Calculator 2.0 - Predict protein/peptide isoelectric point (pI) using 18+ validated pKa scales, SVR models, and deep learning. Supports proteins, peptides, and comprehensive analysis.