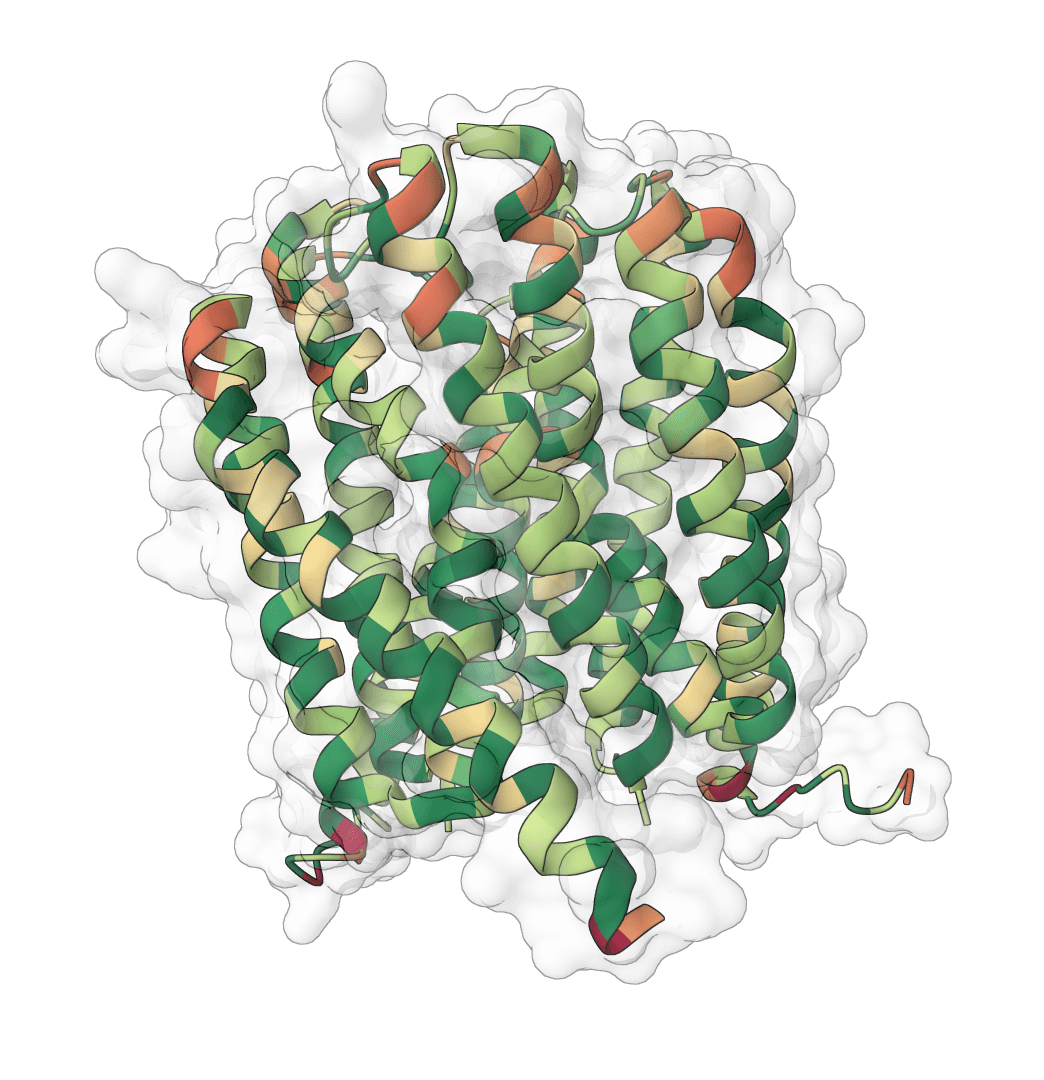
Aggrescan3D

Analyze aggregation-prone regions in a protein structure.

5
Configure input settings on the left, then click "Submit"

Related tools

PROPKA 3

PROPKA 3

Predict pKa values of ionizable groups in proteins and protein-ligand complexes from 3D structure. PROPKA calculates environment-driven pKa shifts for standard ionizable residues, terminal groups, and supported ligand atom types.

Molecular descriptors

Molecular descriptors

Compute 200+ RDKit molecular descriptors, drug-likeness rule violations, and structural fingerprints for QSAR, virtual screening, and ML workflows
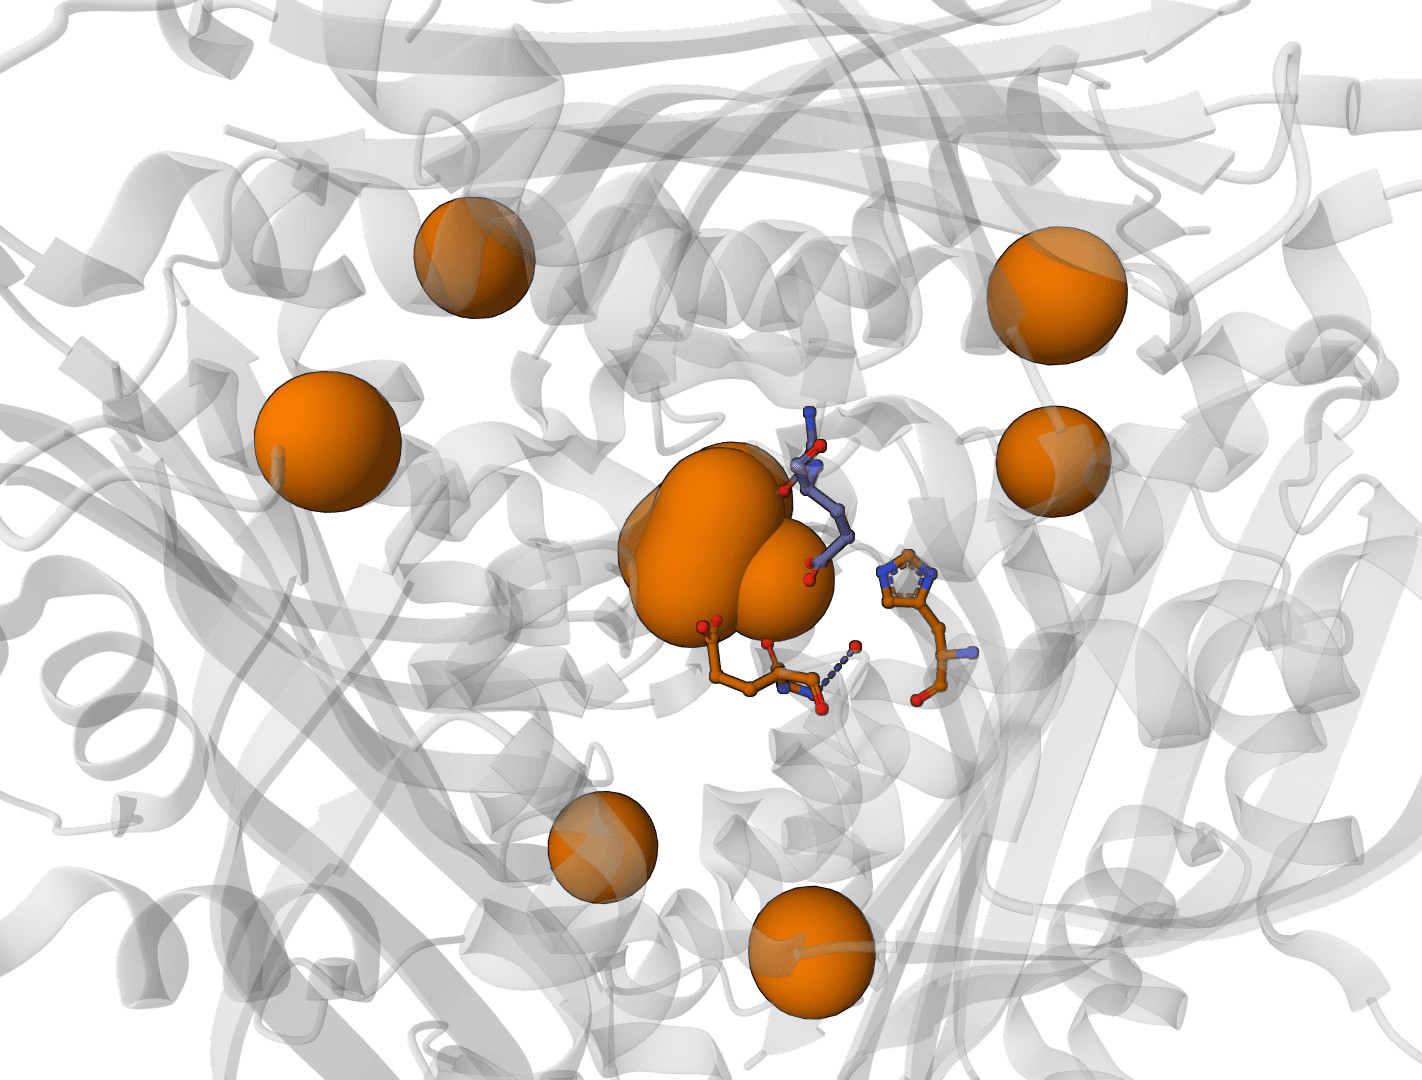
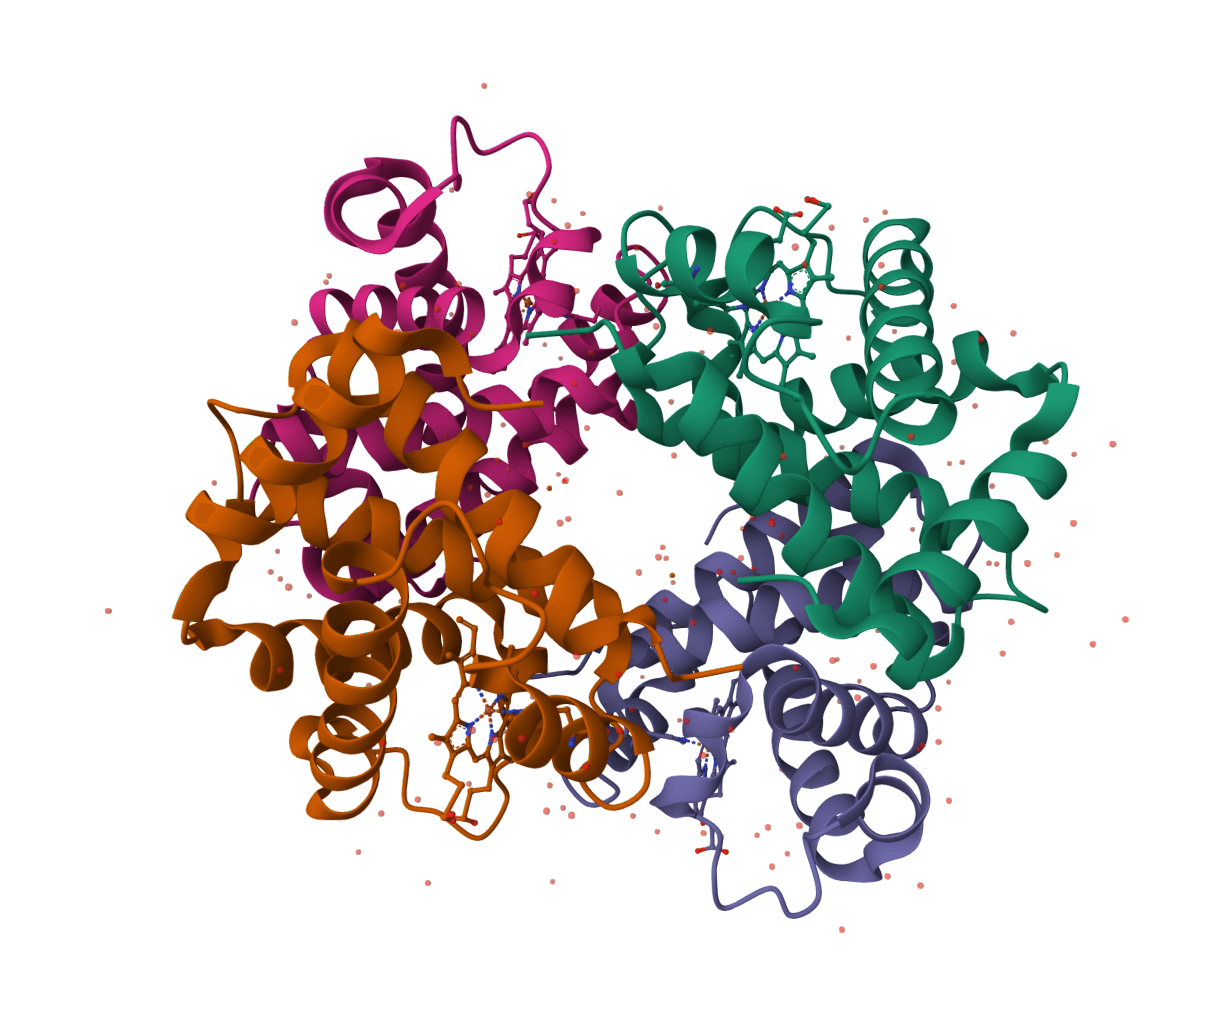
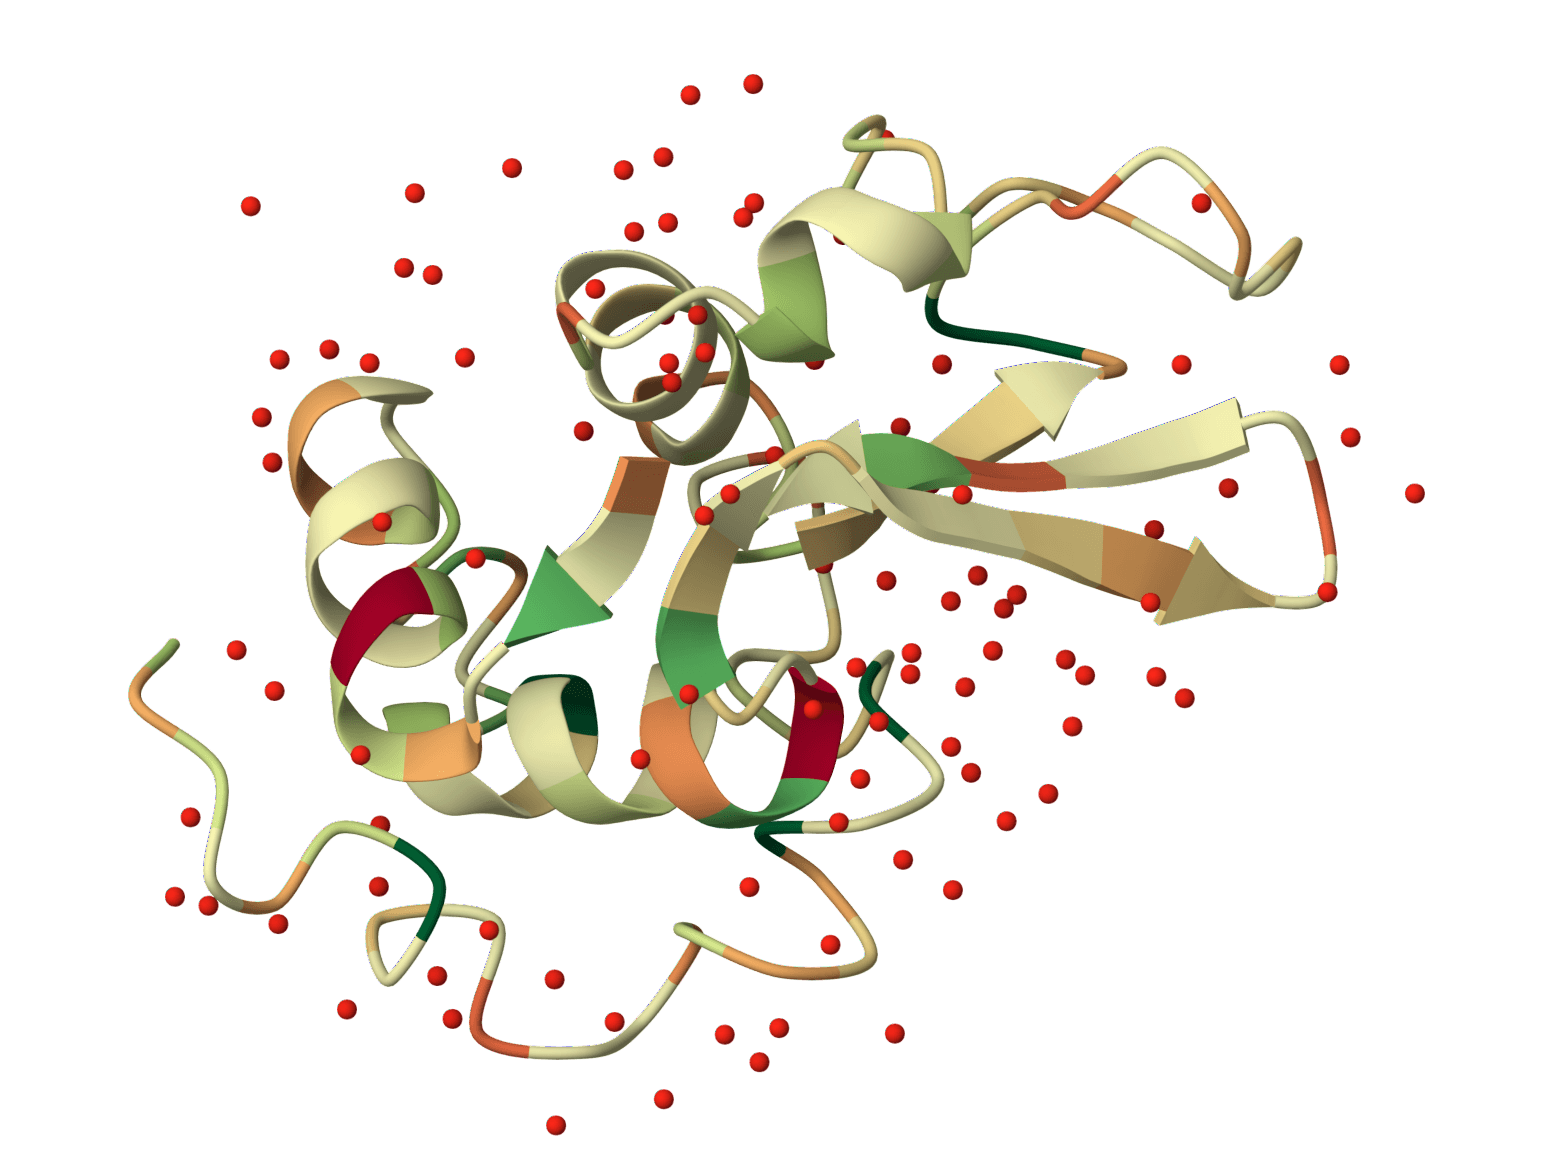
AllMetal3D

AllMetal3D

Predict metal and water binding sites in protein structures using 3D convolutional neural networks (AllMetal3D + Water3D).

Protein charge plot

Protein charge plot

Plot net charge vs pH for protein sequences. Visualize how protein charge changes across pH 0-14 and identify the isoelectric point (pI) where the net charge crosses zero.

FindPept

FindPept

Match experimental peptide masses against theoretical digest fragments of a protein sequence. Identify peptides from mass spectrometry data by peptide mass fingerprinting.

Hydropathy plot

Hydropathy plot

Generate Kyte-Doolittle hydropathy plots to visualize hydrophobic and hydrophilic regions along protein sequences. Identify transmembrane domains and surface-exposed regions.

Hydrophobicity plot

Hydrophobicity plot

Generate hydrophobicity plots using 24 different amino acid scales. Visualize hydrophobic and hydrophilic regions for protein analysis, epitope prediction, and membrane protein studies.

Peptide cutter

Peptide cutter

Predict protease and chemical cleavage sites across a protein sequence for up to 39 enzymes simultaneously. Identify where each enzyme cuts, the cleavage residue, and context window around each site.

Peptide mass calculator

Peptide mass calculator

Cleave a protein sequence with a chosen protease and compute the masses of the resulting peptides. Supports multiple enzymes, missed cleavages, chemical modifications, and different ion types for mass spectrometry experiment planning.

Protein parameters

Protein parameters

Calculate protein parameters, including molecular weight, theoretical pI, extinction coefficients, aromaticity, secondary structure fractions, atomic composition, estimated half-life, and several indices, including instability, aliphatic index, and GRAVY.

What is Aggrescan3D?

Aggrescan3D (A3D) estimates residue-level aggregation propensity from a protein structure. Unlike sequence-only predictors, it evaluates each residue in its three-dimensional context by combining the intrinsic AGGRESCAN scale with solvent exposure and nearby residues in space.

This ProteinIQ wrapper runs the static upstream Aggrescan3D workflow on a single PDB structure per job. The goal is to expose the original static analysis outputs faithfully rather than approximate them with local scoring logic.

How does the static Aggrescan3D workflow work?

The upstream static pipeline performs three core steps:

  1. It computes solvent accessibility for the structure with freeSASA.
  2. It applies the Aggrescan3D residue scoring model using the upstream aggregation matrix and the selected distance threshold.
  3. It generates canonical outputs including the residue score table, per-chain score plots, a summary JSON, and a scored PDB file with scores written into the B-factor column.

The 10 Å threshold is the default patch-oriented analysis mode in Aggrescan3D. The 5 Å setting narrows the calculation toward more local residue contributions.

How to use Aggrescan3D online

Input

InputDescription
Protein StructureOne PDB structure uploaded as .pdb or .ent, or fetched from RCSB by PDB ID. Only one structure is accepted per job.

Settings

SettingDescription
Distance thresholdSpatial radius used by the upstream static calculation. 10 Å is the default patch mode. 5 Å emphasizes more local residue contributions.

Results

The wrapper exposes upstream static outputs directly:

  • Table: residue-level rows from A3D.csv
  • Files: canonical artifacts including A3D.csv, A3D_summary.json, output.pdb, and upstream-generated plot images
  • Summary: per-chain and global score statistics parsed from A3D_summary.json
Output columnDescription
ProteinStructure identifier used for the run
ChainChain identifier
ResidueResidue number
Residue NameOne-letter residue code
ScoreUpstream Aggrescan3D residue score

Interpreting results

More positive scores indicate residues in structural environments that are more aggregation-prone. More negative scores indicate residues in environments that promote solubility. The scored PDB file can be opened in molecular viewers for structure-based inspection, while the summary JSON provides per-chain and global score statistics from the upstream workflow.

Limitations

  • This wrapper currently exposes the static Aggrescan3D workflow only.
  • It accepts one structure per job.
  • Dynamic mode, mutation workflows, FoldX integration, and pH-dependent scoring are out of scope for this wrapper.
  • Aggrescan3D expects protein structures and may reject unsupported residue content or malformed PDB inputs.