Overview
This tool predicts protein stability from amino acid sequences using validated physicochemical methods. The stability score combines multiple peer-reviewed predictors to estimate how stable a protein is likely to be under physiological conditions.
Cite:
- Broz, M. (2025). Protein Stability Prediction Tool. ProteinIQ. Available at: https://proteiniq.io/app/protein-stability
How is stability score calculated
The final stability score (0-100) formula combines five predictors, each weighed based on its estimated contribution towards protein stability:
Score Categories
| Score | Category | Interpretation |
|---|---|---|
| 80-100 | Very stable | Excellent stability predicted |
| 60-79 | Stable | Good stability under normal conditions |
| 40-59 | Moderately stable | May require optimization |
| 20-39 | Unstable | Likely stability issues |
| 0-19 | Very unstable | Significant stability concerns |
Instability Index (40%)
Based on Guruprasad et al. (1990), the Instability Index estimates protein stability based on dipeptide composition. Statistical analysis revealed that certain dipeptide pairs occur at significantly different frequencies in stable versus unstable proteins.
- Less than 40: Protein is predicted to be stable
- Greater than 40: Protein is predicted to be unstable (short half-life)
This is the most heavily weighted factor because it's based on large-scale statistical analysis of protein stability.
Aliphatic Index (20%)
The Aliphatic Index (Ikai (1980)) represents the relative volume occupied by aliphatic side chains (Ala, Val, Ile, Leu). Proteins with higher aliphatic content tend to be more stable at elevated temperatures.
This metric is valuable for thermostability engineering because aliphatic residues contribute to hydrophobic core packing.
It's calculated with the following formula:
where is mole percent.
Typical range of values is between 0 and 120, with values greater than 80 meaning good thermostability.
GRAVY (Grand Average of Hydropathy) (15%)
GRAVY (Kyte & Doolittle (1982)) measures the average hydrophobicity by summing hydropathy values for each amino acid and dividing by sequence length. Balanced hydrophobicity is crucial for proper folding and stability.
- Optimal range: -0.5 to 0.5 (moderate, balanced)
- Positive values: Hydrophobic (typical of membrane proteins)
- Negative values: Hydrophilic (typical of soluble proteins)
Extreme GRAVY values often indicate potential stability or solubility issues requiring experimental validation.
Flexibility Index (15%)
The Flexibility Index (Vihinen et al. (1994)) predicts local and global protein flexibility based on normalized amino acid composition. Rigid proteins typically exhibit better stability than highly flexible ones.
- Low flexibility (less than 0.95): Rigid, stable structure
- High flexibility (greater than 1.05): Dynamic, potentially less stable
Reduced flexibility often correlates with improved stability because rigid structures are less prone to unfolding.
Charge density (10%)
Charge density measures the proportion of charged residues (Lys, Arg, His, Asp, Glu) relative to sequence length. High charge density can lead to electrostatic repulsion and reduced stability.
- Low (less than 0.2): Favorable for stability
- High (greater than 0.4): May indicate surface exposure or instability
Lower charge density generally correlates with better stability, though context-dependent (e.g., pH, ionic strength).
Additional metrics
- Aromaticity: Frequency of aromatic residues (Phe, Trp, Tyr). Aromatic interactions contribute to protein stability through π-π stacking.
- Amino acid percentages: Cysteine percentage disulfide bond potential (stabilizing), proline percentage indicates structural rigidity but can disrupt secondary structure, and aromatic percentage increases stabilizing interactions.
- Secondary structure propensities: Helix formers, sheet formers, turn formers, and destabilizers.
Use cases
- Protein Engineering: Identify destabilizing regions for mutagenesis, select variants with higher aliphatic index, and avoid unstable proteins that degrade rapidly.
- Biopharmaceutical Development: Screen candidates for stability issues early, predict which proteins need stabilizers, and estimate long-term stability.
- Structural Biology: More stable proteins crystallize better, stability correlates with spectral quality, and stability metrics inform modeling.
- Comparative Analysis: Compare stability across species, rank mutations by predicted stability, and identify stable vs. unstable regions.
Limitations
- Sequence-based only: Does not account for 3D structure, cofactors, or post-translational modifications
- Prediction not experimental: Validates trends but does not replace experimental stability measurements (e.g., thermal denaturation)
- Context-dependent: Stability requirements vary by application (crystallography vs. industrial enzyme)
- No kinetic information: Predicts thermodynamic stability, not folding kinetics
Recommended workflow
Step 1: Screen sequences - Calculate stability scores for all candidates
Step 2: Analyze components - Review individual metrics (II, AI, GRAVY, etc.)
Step 3: Identify issues - Look for high instability index, low aliphatic index, extreme GRAVY
Step 4: Engineer improvements - Use metrics to guide rational mutagenesis
Step 5: Validate experimentally - Confirm predictions with thermal shift assays, DSC, or stability studies
Related tools
ThermoMPNN
Predict protein thermostability changes (ΔΔG) for point mutations using a graph neural network. Enables computational saturation mutagenesis screening to identify stabilizing mutations.
Aggrescan3D
Faithful static-mode Aggrescan3D tool for per-residue aggregation propensity analysis from a single protein structure.
CANYA
Predict protein aggregation nucleation propensity from amino acid sequences using the Lehner Lab CANYA neural network.
PROPKA 3
Predict pKa values of ionizable groups in proteins and protein-ligand complexes from 3D structure. PROPKA calculates environment-driven pKa shifts for standard ionizable residues, terminal groups, and supported ligand atom types.
Protein-Sol
Predict protein solubility from amino acid sequence using the University of Manchester Protein-Sol method.
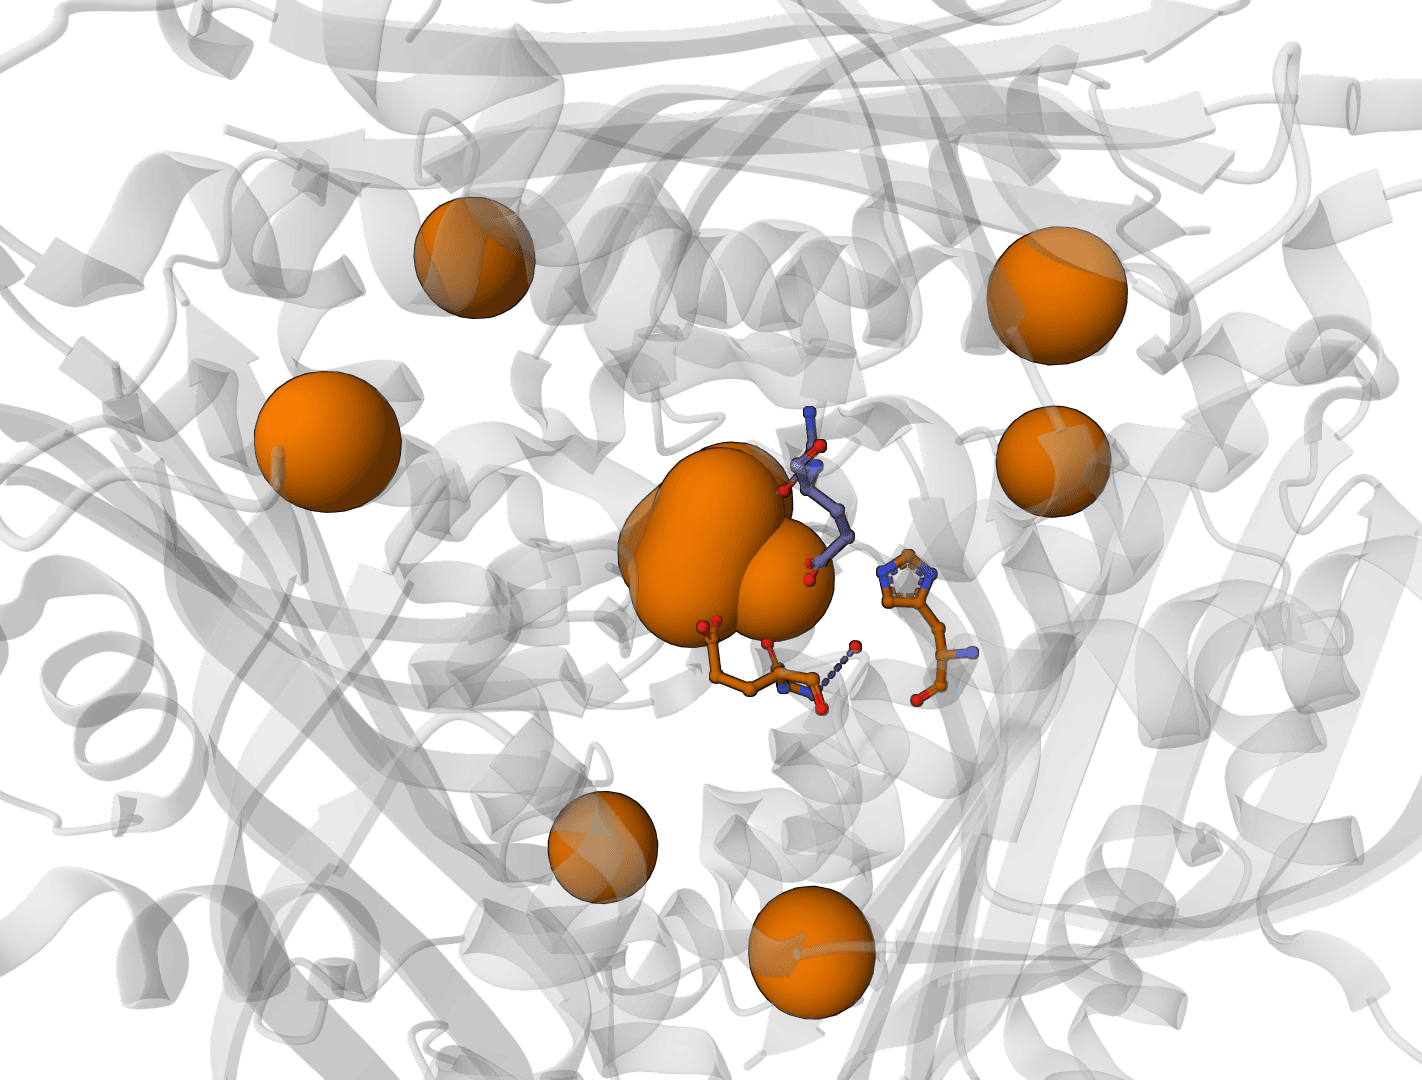
AllMetal3D
Predict metal and water binding sites in protein structures using 3D convolutional neural networks (AllMetal3D + Water3D).
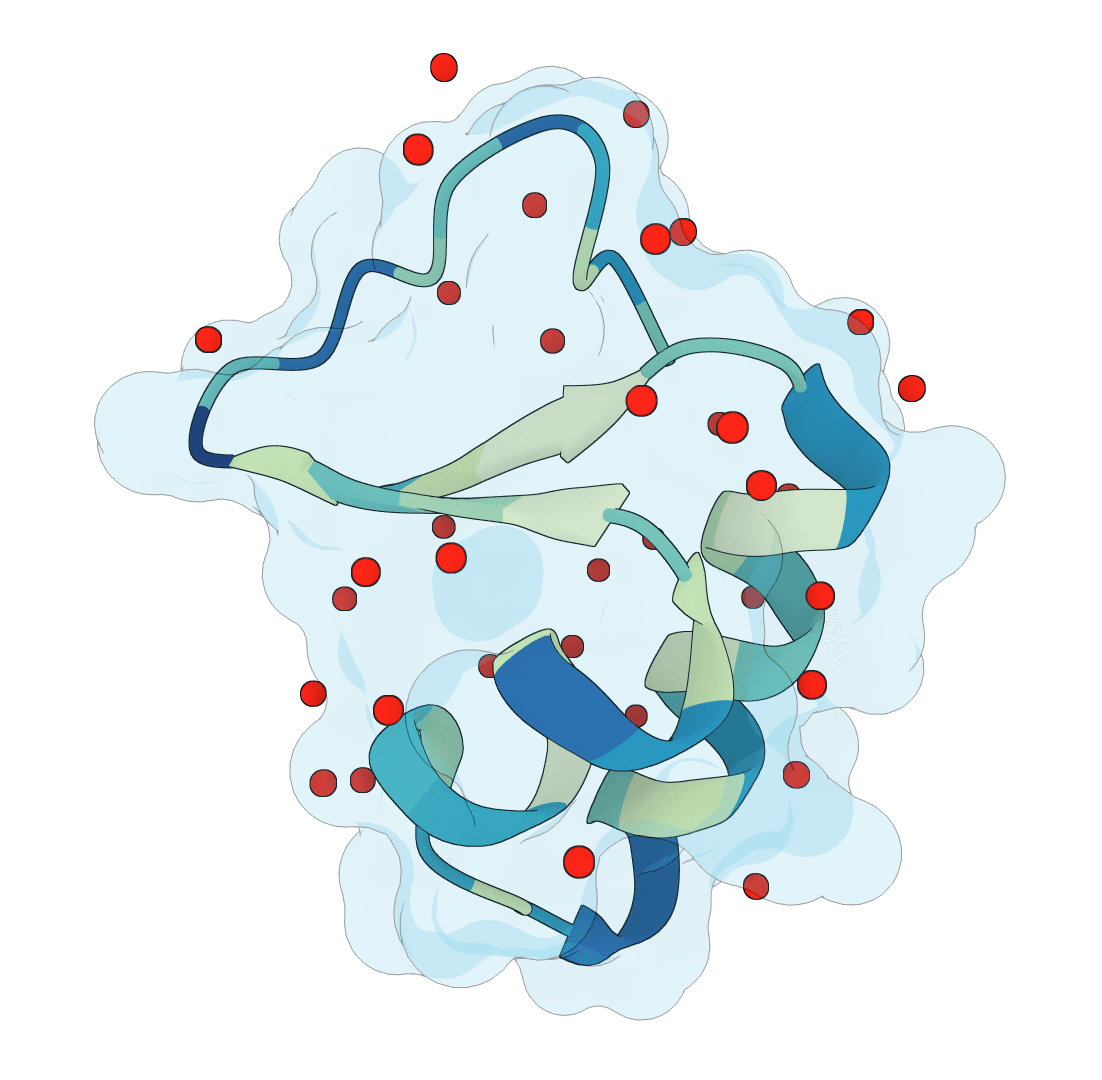
SuperWater
Predict protein hydration sites from a structure using a diffusion model with ESM features and a confidence-filtering head.
Molecular descriptors
Compute 200+ RDKit molecular descriptors, drug-likeness rule violations, and structural fingerprints for QSAR, virtual screening, and ML workflows
Protein charge plot
Plot net charge vs pH for protein sequences. Visualize how protein charge changes across pH 0-14 and identify the isoelectric point (pI) where the net charge crosses zero.
Chou-Fasman
Predict protein secondary structure using the classic Chou-Fasman algorithm based on amino acid propensities