Predict pKa values of ionizable groups in proteins based on 3D structure.
Predict pKa values of ionizable groups in proteins based on 3D structure.
PROPKA is an empirical software program for structure-based pKa prediction in proteins and protein-ligand complexes. It starts from a model pKa for each recognized ionizable group, then estimates how desolvation, hydrogen bonding, nearby charges, and other features of the three-dimensional environment shift that value.
The method was introduced as a fast way to predict and rationalize protein pKa values from atomic coordinates. PROPKA 3 replaced the earlier split between buried and surface residues with a continuous treatment of desolvation and dielectric response. PROPKA 3.1 and later also support recognized ionizable groups in bound ligands and identify potentially coupled titratable groups.
.pka report breaks that shift into its structural determinants.Ionization states affect protein charge, hydrogen-bond patterns, catalytic chemistry, ligand binding, and the preparation of structures for docking or molecular simulation. PROPKA provides site-specific estimates quickly enough to compare related structures, inspect unusually shifted residues, and guide protonation-state choices before more expensive calculations.
The result is a structure-based estimate, not a direct measurement or a constant-pH simulation. A different conformation, missing atoms, alternate side-chain placement, or changed ligand chemistry can produce a different prediction.
ProteinIQ runs PROPKA 3.5.1 on one uploaded PDB or ENT structure or one structure fetched from RCSB PDB per job. Use Batch mode to analyze multiple files as separate jobs. Each completed job returns a searchable pKa table, a CSV file, and the native .pka report, with optional chain selection, residue targeting, and coupled-group reporting.
| Input | Accepted data | Limits and checks |
|---|---|---|
Protein Structure | One PDB or ENT file, or an RCSB PDB identifier such as 1UBQ | One structure per job, up to 50 MB. The structure must contain protein atoms and at least one recognized ionizable group. Use Batch mode for multiple files. |
Protein-ligand complexes can be submitted as a single PDB structure. Ligand rows are returned only for chemical groups that PROPKA recognizes and parameterizes. Structures exported from modeling or simulation software often fill the element and formal charge columns with values such as O1- or N1+. PROPKA identifies atoms from their names and does not read these columns, so such files run as submitted.
| Setting | Default | Behavior |
|---|---|---|
Restrict to chains | All chains | Accepts chain identifiers separated by commas or spaces, such as A,B. Use blank for PDB records without a chain ID. Only the selected chains are included. |
Titrate only residues | All recognized groups | Accepts chain:resnum selectors separated by commas or spaces, such as A:35 A:52. Negative residue numbers are supported; use blank:-1 for residue -1 in a blank chain. Unselected groups are made non-titratable, so this is not merely a table filter. |
Show coupled residues | Off | Runs PROPKA's coupled-group display mode. For coupled groups, the pKa values written to the report come from the swapped-interaction arrangement, so rows can differ from a default run. Summary-row coupling notes are preserved in the results table when PROPKA returns them. |
Keep input protons | Off | Preserves hydrogen atoms already present in the input instead of discarding them during parsing. Enable it only when the submitted proton placement is intentional. |
pH | 7.0 | Passes PROPKA's target-pH option for stability-related calculations. In the pinned PROPKA 3.5.1 release, changing this value does not change the site pKa table or native report; use it for source compatibility rather than protonation assignment. |
Folding profile window | 0 to 14, step 1 | Selects the pH range and display interval used for folding-profile rows in each native .pka report. |
Stability calculation grid | 0 to 14, step 0.1 | Sets the pH range and resolution used for native stability and charge calculations. Finer steps increase the number of evaluated points. |
An empty chain or residue field keeps the standard full-structure calculation. A residue selector must identify a group that PROPKA treats as titratable. Selecting an alanine or another unsupported site returns an input error rather than an empty result.
The Results tab contains one row per reported protein residue, terminal group, or ligand-derived site. Rows follow PROPKA's native order, so N+ terminal rows appear after the side-chain rows.
In Batch mode, each structure runs as a separate job with its own results and status. A failed structure does not remove results from successful jobs.
| Column | Meaning |
|---|---|
Structure | RCSB identifier or uploaded filename stem. |
Residue | Protein group code, terminal label (N+ or C-), or ligand residue name. |
Position | Protein residue number or ligand atom label. |
Chain | PDB chain identifier. |
pKa | Predicted pKa in the submitted structural environment. |
Model pKa | Reference pKa assigned to the isolated group. |
Shift | pKa - Model pKa, reported in pKa units. |
Ligand atom type | PROPKA atom-type annotation for a ligand-derived group. N/A indicates a protein or terminal group. |
Coupling note | Coupling text preserved from the PROPKA summary row. N/A means no note was returned for that row; detailed alternative assignments remain in the native .pka report. |
| File | Contents |
|---|---|
propka-results.csv | Export of the normalized table for the submitted structure. |
<structure>.pka | Native PROPKA report for one structure, including the detailed determinants, summary, folding profile, and charge profile written by PROPKA. |
run.log | Curated settings, structure and result counts, and reviewed scientific warnings. |
The model pKa is a reference value for the isolated chemical group. The predicted pKa includes the effect of the submitted structure. A positive Shift means the environment raises the pKa relative to the model value; a negative Shift means it lowers it.
| Group | Model pKa |
|---|---|
| ASP | 3.80 |
| GLU | 4.50 |
| C-terminus | 3.20 |
| HIS | 6.50 |
| CYS | 9.00 |
| TYR | 10.00 |
| LYS | 10.50 |
| ARG | 12.50 |
| N-terminus | 8.00 |
The magnitude of a shift is useful for prioritizing unusual sites, but there is no universal cutoff that proves catalytic or functional importance. Comparisons are strongest when the same residue is evaluated across structures prepared in the same way.
Scale matters when reading a shift. Ubiquitin (1UBQ) is small and mostly solvent exposed, and all 26 of its groups sit within 0.81 units of their model values (Asp58, at -0.81, is the largest).
Buried sites move much further. In a barnase-barstar complex we ran locally (1BRS chains A and D, with barstar labeled chain B), barstar Asp39 is 100 % buried at the interface and is predicted at pKa -1.86, a shift of -5.66. A value that far below zero means "stays deprotonated at any realistic pH", and the second decimal carries no information.
The benchmark errors reported for the method are roughly 0.65 to 1.00 pKa units depending on residue type (see the accuracy figures below). As a practical reading rule, not a threshold from the papers, shifts under about 1 unit are hard to tell apart from model behavior, while shifts of 2 units or more are the sites worth checking against the structure.
The Results table gives the final pKa and shift. The native .pka file shows where they come from: one block per group with a BURIED percentage and five contribution columns, followed by one extra line for each interacting partner. Every contribution is in pKa units and is added directly to the model pKa. Asp58 in ubiquitin shows the pattern:
| Term | Value | Partner or count in the report |
|---|---|---|
| Model pKa | 3.80 | Isolated Asp |
Desolvation (REGULAR) | +0.40 | 218 heavy atoms within 15 Å |
Backbone reorganization (RE) | 0.00 | |
SIDECHAIN HYDROGEN BOND | -0.23 | Thr55 side chain |
BACKBONE HYDROGEN BOND | -0.75 | Thr55 backbone amide |
COULOMBIC INTERACTION | -0.23 | Arg54 |
Predicted pKa | 2.99 | Shift -0.81 |
The terms sum to the reported pKa within 0.02 for all 26 groups of the 1UBQ report. Here the two hydrogen bonds to Thr55 and the nearby Arg54 stabilize the carboxylate and outweigh a small desolvation penalty, so the pKa falls. The same table identifies Lys11 (pKa 11.02, +0.52) as raised by a side-chain hydrogen bond (+0.43) and a Coulomb term (+0.38), both to Glu34.
The BURIED column counts non-hydrogen atoms within 15 Å of the group (excluding its own residue) and scales the count linearly from 0 % at 280 atoms to 100 % at 560. Asp58 has 218 atoms and reads 0 %, whereas Glu73 in barnase has 646 and reads 100 %.
Desolvation is scaled in the same way, from a quarter of its full strength at the surface to full strength when buried, which is how PROPKA 3 removed the old split into surface and buried residues.
Desolvation is positive for acids and negative for bases, because burial penalizes the charged form.
Hydrogen bonds and Coulomb terms stabilize or destabilize the charged form depending on the partner, so read each as "raises" or "lowers" the pKa rather than as good or bad. A single hydrogen bond contributes at most 0.85 units in the default parameters, with larger values for a few pairs such as carboxylate to histidine (1.60). Coulomb terms act out to 10 Å and fade linearly from full strength at 4 Å to zero at 10 Å. The integer printed after RE was 0 in every report we checked, so it carries no information.
For a simple, uncoupled group, pH relative to pKa gives the dominant state:
A pH one unit from the pKa leaves about 91 % of the group in the dominant state, and half a unit leaves about 76 %. With benchmark errors near 0.8 units, treat any group whose pKa lies within about 1 unit of the working pH as undecided and test both states. In 1UBQ, His68 is predicted at 6.00, so at pH 7.0 it is mostly neutral but not safely so. PROPKA does not say which tautomer a neutral histidine adopts; that is a hydrogen-placement decision made later.
PROPKA reports pKa values rather than a protonated coordinate file. For a PQR structure with atomic charges, radii, and protonation assigned at a chosen pH, PDB2PQR is the more direct workflow.
The end of the .pka file holds two pH scans that are not in the Results table. The first, headed "Free energy of folding (kcal/mol) as a function of pH (using neutral reference)", is the ionization contribution to folding stability: how much the predicted pKa values of the folded protein differ from the model values of the unfolded one at each pH. It is not the total stability of the protein. For 1UBQ it reads 4.76 at pH 2, 2.55 at pH 4, 1.14 at pH 7, and about 1.0 from pH 10 to 12.
Only the shape of this curve and its minimum carry meaning. Positive values do not say that ubiquitin is unfolded, and the report prints "Could not determine the pH-range where the free energy is negative" for it.
The 80 % line that follows tests for values below 0.8 times the minimum, which cannot be met when the minimum is positive, so "Could not determine" there is also expected. The "pH of optimum stability" (10.5 here) is the lowest point on the grid, and on a curve this flat it is not a recommendation for a buffer.
The second scan lists the net charge of the folded and unfolded states from pH 0 to 14. The 1UBQ folded charge falls from +13.00 at pH 0 (7 Lys, 4 Arg, His68 and the N terminus) to -12.86 at pH 14, and the report ends with "The pI is 7.07 (folded) and 7.26 (unfolded)". At pH 7.0 the folded charge is +0.03.
The unfolded curve uses model pKa values, so a large gap between the folded and unfolded pI points to strongly shifted groups. Use Protein charge plot or IPC 2.0 for a sequence-only charge or pI to compare against.
The Folding profile window setting chooses which pH rows are printed, and Stability calculation grid sets the resolution of the scans behind the optimum and the pI. The pH setting does not change either scan in PROPKA 3.5.1.
Strongly interacting ionizable groups can have coupled protonation behavior. PROPKA 3.1 added a test for noncovalent coupling (Søndergaard et al., 2011). With the default parameters of PROPKA 3.5.1, two groups are flagged when their interaction exceeds 0.5 pKa units, their intrinsic pKa values differ by at most 2.0, swapping their interactions moves at least one pKa by 1.0 or more, and the two arrangements differ by no more than 1.0 in folding free energy.
Flagged groups carry an asterisk after the pKa in the .pka determinants table, for example GLU 73 A 6.83*.
A default run only prints a note at the end of the report that coupled residues were detected. With Show coupled residues enabled, PROPKA changes the numbers: it warns that the pKa values written to the report are based on swapped interactions.
In the barnase-barstar run, Glu73 of barnase moved from 6.83 to 5.62, barstar Asp39 from -1.86 to -0.65, and the folded pI from 5.72 to 5.60. Both are buried acids, and the Glu73 block lists a +1.21 repulsion from Asp39, so neither default value is a reliable single-site estimate.
Compare a default job with a Show coupled residues job before choosing protonation states for a flagged pair.
The Coupling note column is a separate mechanism. It reports NB: Discarded due to coupling with ... when PROPKA drops a group that is covalently coupled to another, meaning titratable groups within three bonds of each other. PROPKA 3.5.1 removes the discarded group from the tables before they are written, so a populated note is not expected in a default run, and the missing N-terminal Asp row (see Limitations) is the visible consequence.
Ligand rows include the ligand residue name, atom label, model pKa, and a PROPKA ligand atom type such as NAR or N33. An absent ligand row does not prove that a ligand has no ionizable group. It can also mean that the relevant chemistry was not recognized from the submitted PDB bonding and atom records.
The atom type fixes the model pKa that the shift is measured from. PROPKA 3.1 recognizes 18 ligand group types (Søndergaard et al., 2011). The ones with their own model pKa in the default parameter file are listed below, and a ligand shift is read the same way as a protein shift.
Ligand atom type | Group | Model pKa |
|---|---|---|
CG | Guanidinium | 11.50 |
C2N | Amidinium | 11.50 |
N30 to N33 | Protonated amines (N33 is tertiary, N31 is primary) | 10.00 |
NAR | Aromatic nitrogen, as in pyridine | 5.00 |
OCO | Carboxylate | 4.50 |
SH | Thiol | 10.00 |
OP | Phosphate oxygen | 6.00 |
These values describe the group in the bound pose. To enumerate the ionization states of the free ligand from its SMILES, use Dimorphite-DL.
The compact, single-chain ubiquitin structure demonstrates the standard full-structure workflow with no residue filter.
1UBQ, chain A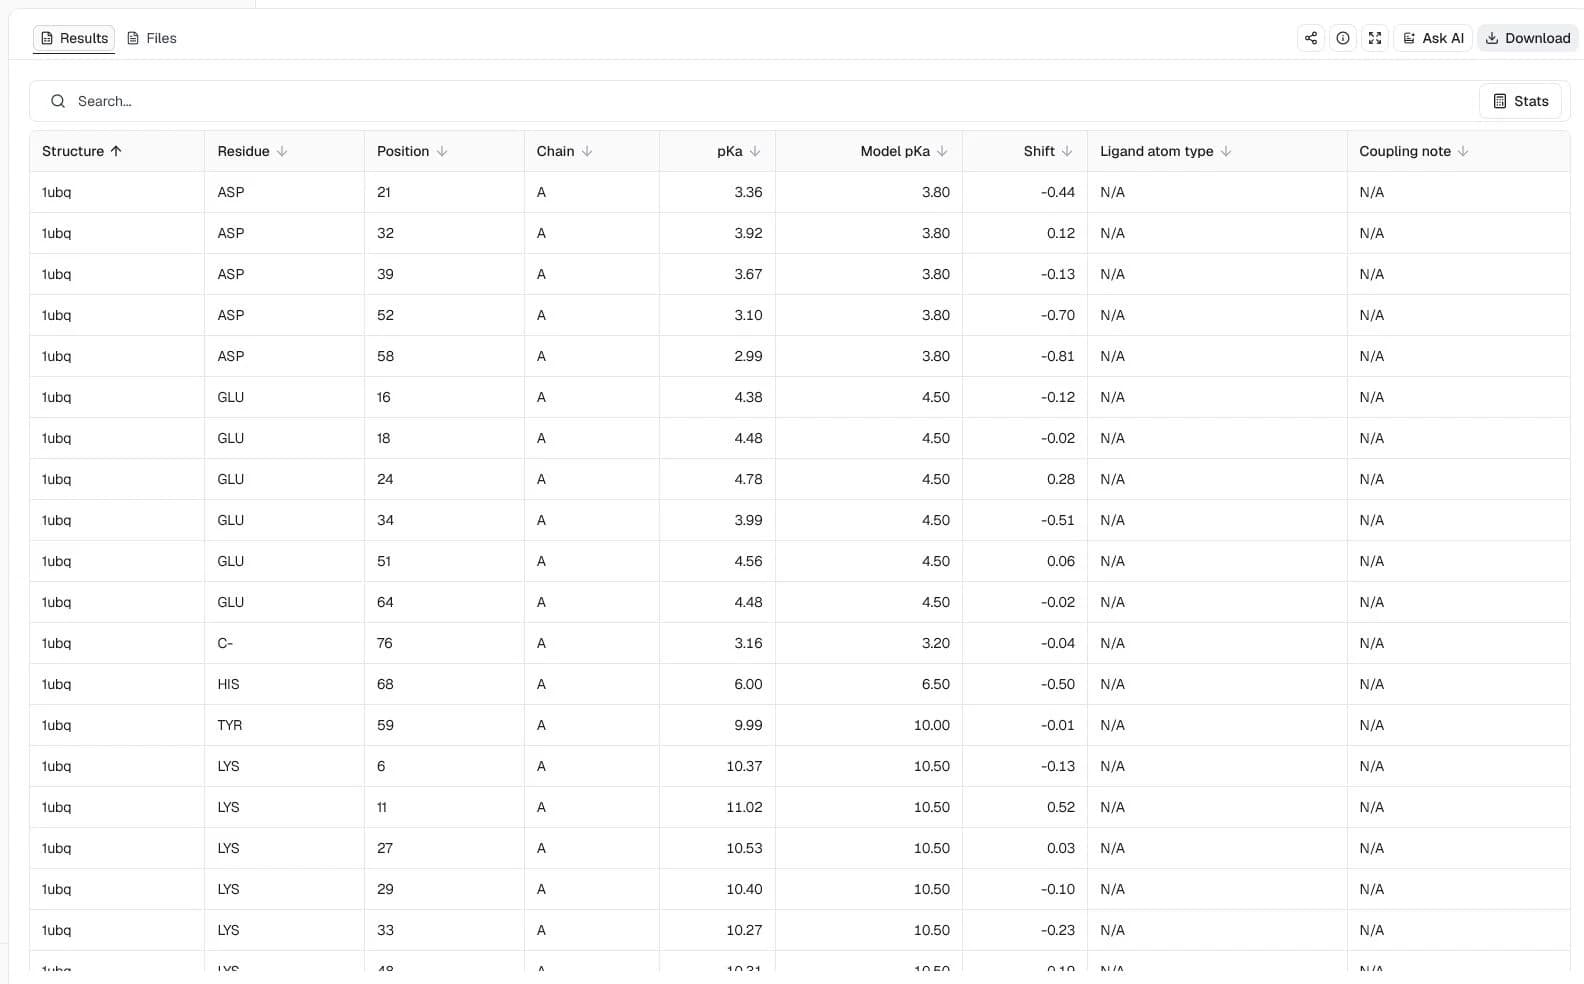
PROPKA returned 26 ionizable groups with predicted pKa values from 2.99 to 12.76. Asp58 appears at pKa 2.99 with a shift of -0.81. The values apply to the submitted crystal conformation and do not include conformational sampling.
The targeted lysozyme run compares two well-known catalytic carboxylates while excluding other groups from titration.
2LZTRestrict to chains = A; Titrate only residues = A:35,A:52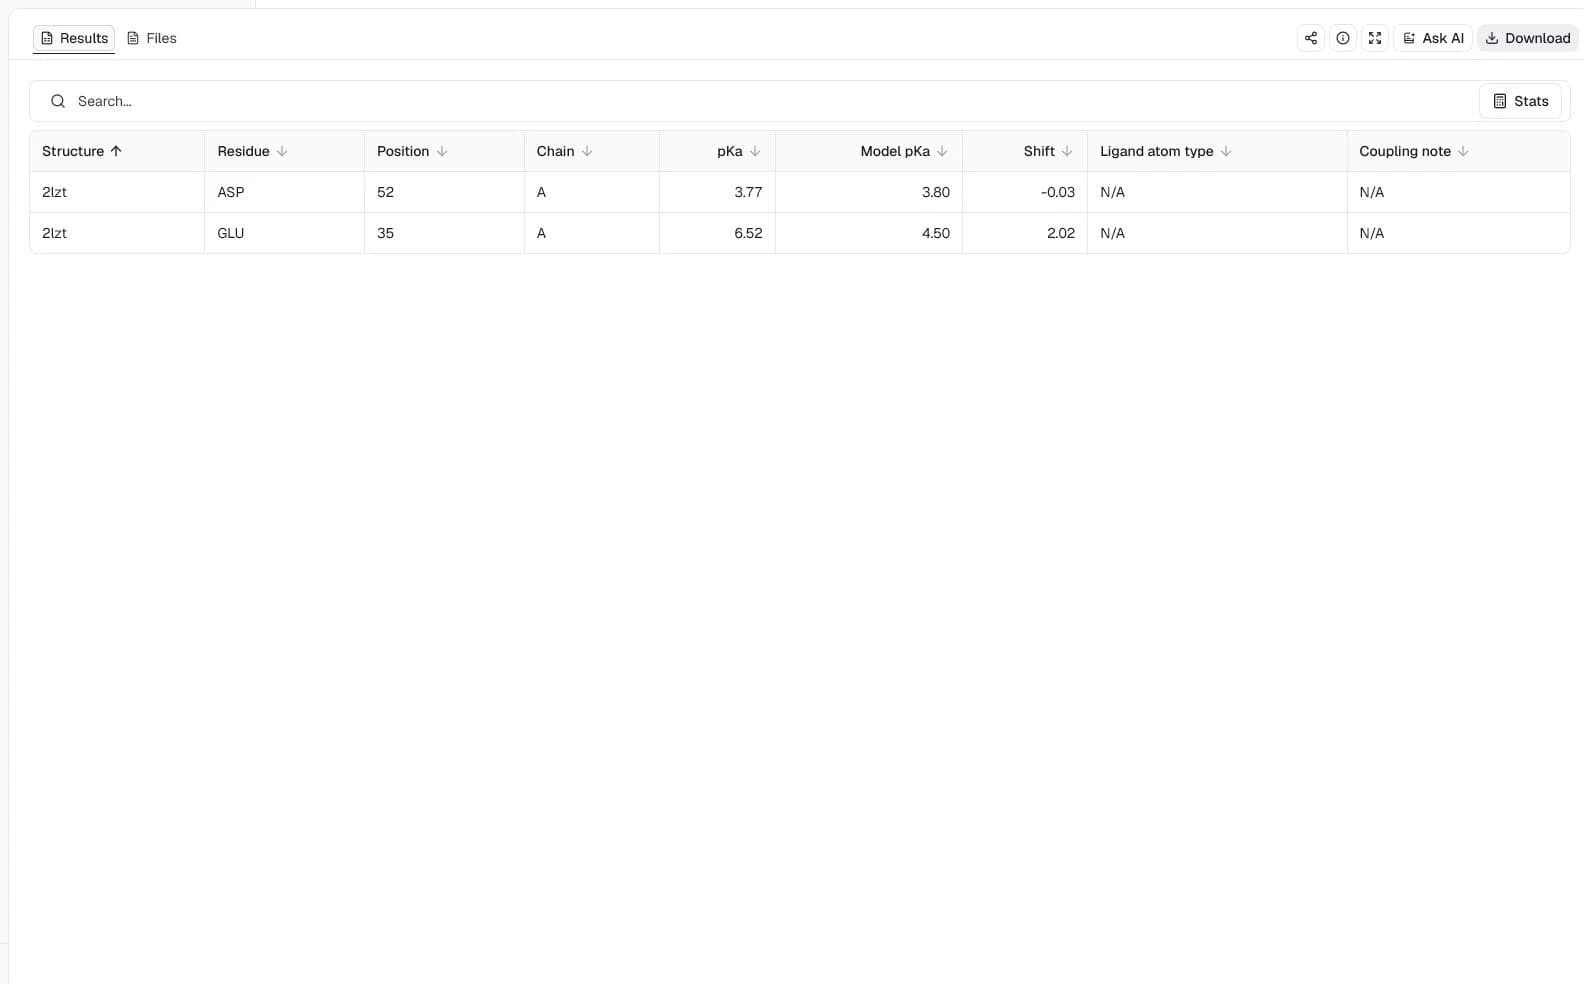
Glu35 has a predicted pKa of 6.52, 2.02 units above its model pKa of 4.50. Asp52 is close to its model value at pKa 3.77 with a shift of -0.03. The contrast supports different modeled microenvironments, but it does not by itself establish a catalytic mechanism or experimental protonation state.
The HIV-1 protease complex shows protein groups from both chains together with supported ionizable atoms in a bound ligand.
1HSG, chains A and BShow coupled residues = enabled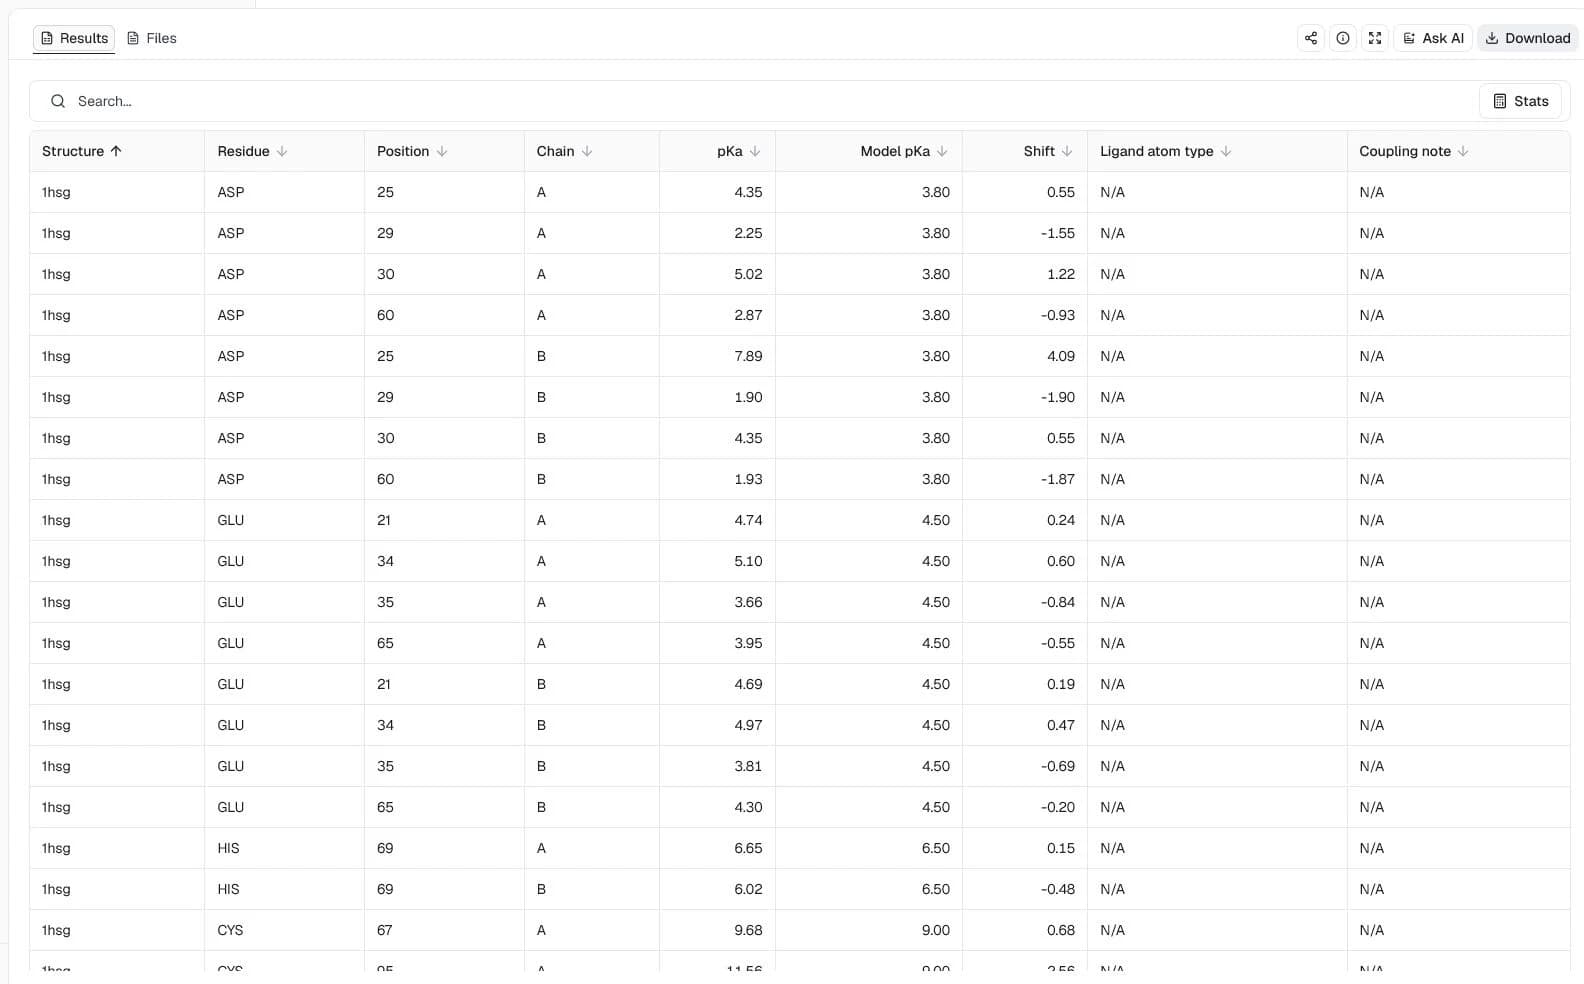
The complete result contains 48 groups. Asp25 is predicted at pKa 4.35 in chain A and 7.89 in chain B for this submitted structure. Because the two catalytic Asp25 residues interact across the dimer interface and Show coupled residues was enabled, these values reflect PROPKA's coupled-group handling and should be read as a pair rather than as independent, fixed solution states.
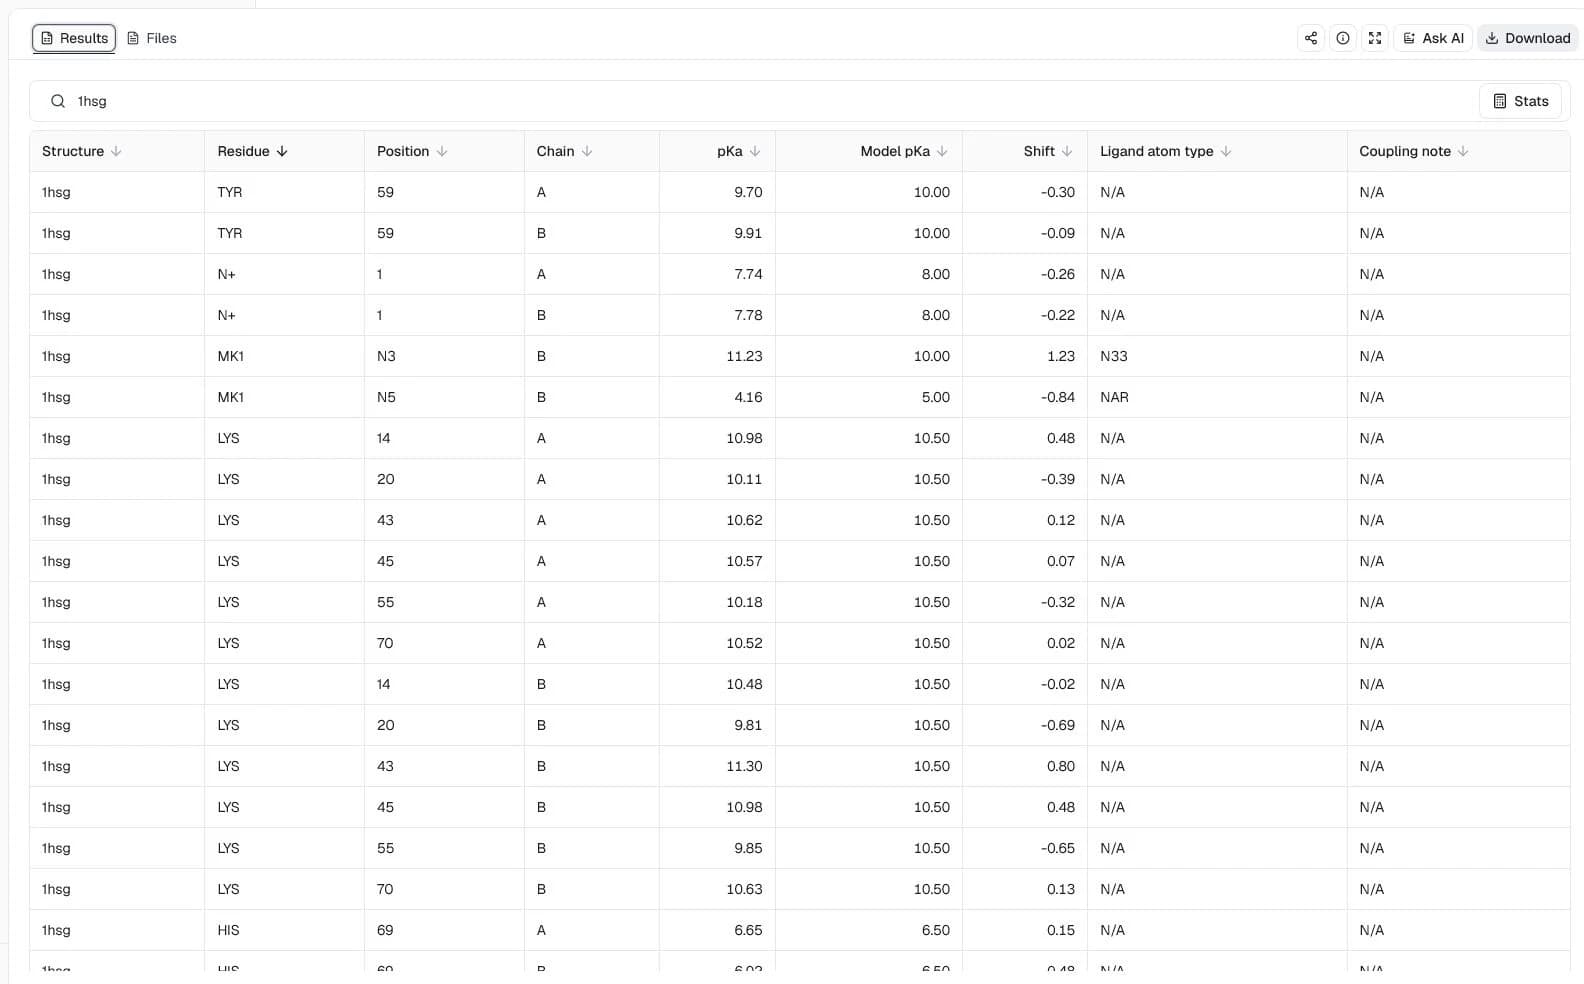
The ligand-derived rows report MK1 N3 at pKa 11.23 with atom type N33, and MK1 N5 at pKa 4.16 with atom type NAR. Coupling note is N/A for both rows, so PROPKA did not return an alternative coupling note for these sites even though coupled-residue reporting was enabled.
PROPKA starts from the model pKa of each recognized group and estimates an environmental perturbation from the submitted coordinates:
PROPKA 3 replaced the older hard division between surface and buried groups with a continuous treatment of desolvation and dielectric response. In the original PROPKA 3 benchmark, root-mean-square deviations were 0.79 pKa units for Asp/Glu, 0.75 for Tyr, 0.65 for Lys, and 1.00 for His. Those dataset-level values describe benchmark performance, not an uncertainty interval for every row.
The previous implementation scored 0.91, 0.97, 0.72 and 1.37 on the same four sets, and the PROPKA 3 paper concentrated on Asp and Glu, where experimental pKa values and structures are the most reliable (Olsson et al., 2011). The first PROPKA paper reported an RMSD of 0.89 over 314 experimental values (233 carboxyl, 12 Cys, 45 His and 24 Lys), or 0.79 for the 285 values left after removing 29 that are only upper or lower limits (Li et al., 2005).
PROPKA 3.1 extended the method to supported ionizable ligand groups, inductive interactions within ligands, interactions between multiple ligands, and detection of noncovalently coupled ionizable groups. ProteinIQ preserves the native ligand atom-type and coupling annotations in the result table and .pka report.
For ligands, PROPKA 3.1 gave results similar to or better than PROPKA 2.0 except in a few cases (Søndergaard et al., 2011). PROPKA 2.0 was validated on 26 protein-ligand complexes and identified three of the four large protonation changes (more than 0.5 protons) seen experimentally in 14 trypsin and thrombin complexes (Bas et al., 2008).
| Goal | Suitable workflow |
|---|---|
| Fast, site-specific pKa estimates from a protein structure | PROPKA |
| PQR coordinates with protonation, atomic charges, and radii at a selected pH | PDB2PQR |
| Sequence-level net charge across pH without a structure | Protein charge plot |
| Sequence-based protein or peptide isoelectric point | IPC 2.0 |
| Repair missing atoms, residues, or inconsistent structure records before pKa prediction | PDBFixer followed by PROPKA |
Keep input protons should be used only when those atoms are deliberately prepared.N+ row is the terminal amine. Show coupled residues does not restore the Asp row, but the group still counts toward the pI in the native report.Structures with missing atoms or incomplete residues should be repaired before the PROPKA run. When protonation choices affect docking, electrostatics, or simulation setup, the prediction should be checked against experimental evidence, alternative structures, or a higher-level pKa calculation.

Analyze aggregation-prone regions in a protein structure.

Calculate RDKit physicochemical descriptors, drug-likeness scores, rule violations, and structural fingerprints from SMILES.

Predict metal and water binding sites in proteins with 3D CNN models.

Plot net charge vs pH to visualize protein charge behavior and identify the isoelectric point.

Score single and multi-site protein mutations with evolutionary and inverse-folding profiles.

Match experimental masses to theoretical protein digest fragments for peptide mass fingerprinting.

Generate hydropathy plots to visualize hydrophobic/hydrophilic regions along protein sequences using sliding window analysis.

Explore local protein hydrophobicity with 24 amino acid scales, including Eisenberg and Hopp-Woods, and an adjustable sliding window.

Map protease and chemical cleavage sites across protein sequences for proteomics experiment planning.

Digest a protein in silico and list peptide masses and ion m/z values for mass spectrometry.