Protein visualization software compared
Browser viewers and desktop programs, matched to the job

Matic Broz, PhD20 min
PDB entry 1CBS is about as easy as a structure gets: one chain of cellular retinoic acid-binding protein II with retinoic acid in its pocket, 1,213 atoms in all, 100 of them crystal waters. Every program in this guide opens it in a second or two. The differences start with the next question. One program will list the contacts between the acid and the pocket, another will turn the view into a figure for a paper, a third will play a simulation of it, and several can do none of those.
So the long list of names you get when you search for protein visualization software is less a ranking than a set of tools for different jobs. Some are web viewers you open in a tab, some are libraries for building a viewer into your own page, and some are desktop programs with their own scripting languages, though nearly all of them read the same PDB and mmCIF files. We sorted them by job and checked each one's licence, platforms and latest release on its official site on November 10, 2026.
The PDB viewer in this comparison is made by ProteinIQ, the publisher of this guide. It appears where it fits a job, and a section near the end lists what it still does worse than the desktop programs.

Which program fits which job
Table 1 names a starting point for each job, and Table 2 what each program costs and where it runs.
| Job | Start with | Also worth a look |
|---|---|---|
| Look at one structure, nothing to install | Mol* or the PDB viewer by ProteinIQ | iCn3D |
| Make a figure for a paper or slide | PyMOL or ChimeraX | YASARA View, PDB viewer by ProteinIQ |
| Analyse a ligand site | PDB viewer by ProteinIQ, PyMOL or ChimeraX | Mol*, iCn3D, YASARA View, Discovery Studio Visualizer |
| View a molecular dynamics trajectory | VMD | ChimeraX, PyMOL |
| Embed a structure in a web page | 3Dmol.js or Mol* | NGL, JSmol, iCn3D |
| Work with electron density or cryo-EM maps | ChimeraX or Mol* | iCn3D, PDB viewer by ProteinIQ, Swiss-PdbViewer |
| Build or edit a small molecule in 3D | Avogadro | Jmol |
The programs at a glance
| Program | Runs in | Licence and cost | Latest release we found |
|---|---|---|---|
| Mol* | Browser | MIT licence, free | 5.13.0, October 4, 2026 |
| iCn3D | Browser | Free; a US Government work, except the DelPhi component, which is not licensed for commercial use | 3.54.3, October 20, 2026 |
| NGL | Browser, as a JavaScript library | MIT licence, free | 2.5.0 on npm; last commit September 3, 2026 |
| 3Dmol.js | Browser, as a JavaScript library | BSD 3-clause licence, free | 2.5.5, May 22, 2026 |
| Jmol and JSmol | Desktop (needs Java) and browser | LGPL, free | 16.5.7, October 27, 2026 |
| PDB viewer by ProteinIQ | Browser | Free, no account | Hosted service |
| PyMOL | Windows, macOS, Linux | Schrödinger's build needs a paid licence, free for full-time students and educators; the source code is open under a BSD-like licence | 3.1.9, October 7, 2026 |
| ChimeraX | Windows, macOS, Linux | Free for academic, government, nonprofit and personal use; commercial licence from $2,000 for three years | 1.12, June 11, 2026 |
| VMD | Windows, macOS, Linux | Free for academic, research and internal business use, with registration; commercial use needs a licence | 2.0.0 for Linux, March 25, 2026; 1.9.4 for macOS and Windows |
| YASARA View | Windows, macOS, Linux, Android | View is free; Model is free for academics; Dynamics and Structure are paid | Changelog has 2026 entries |
| Swiss-PdbViewer | Windows; older macOS builds | No price listed; the licence forbids modifying or redistributing it | 4.1, no release date found |
| Avogadro | Windows, macOS, Linux | BSD 3-clause licence, free | 2.1.0, October 23, 2026 |
| Discovery Studio Visualizer | Desktop | Free, with registration | Not stated on BIOVIA's pages |
Looking at one structure
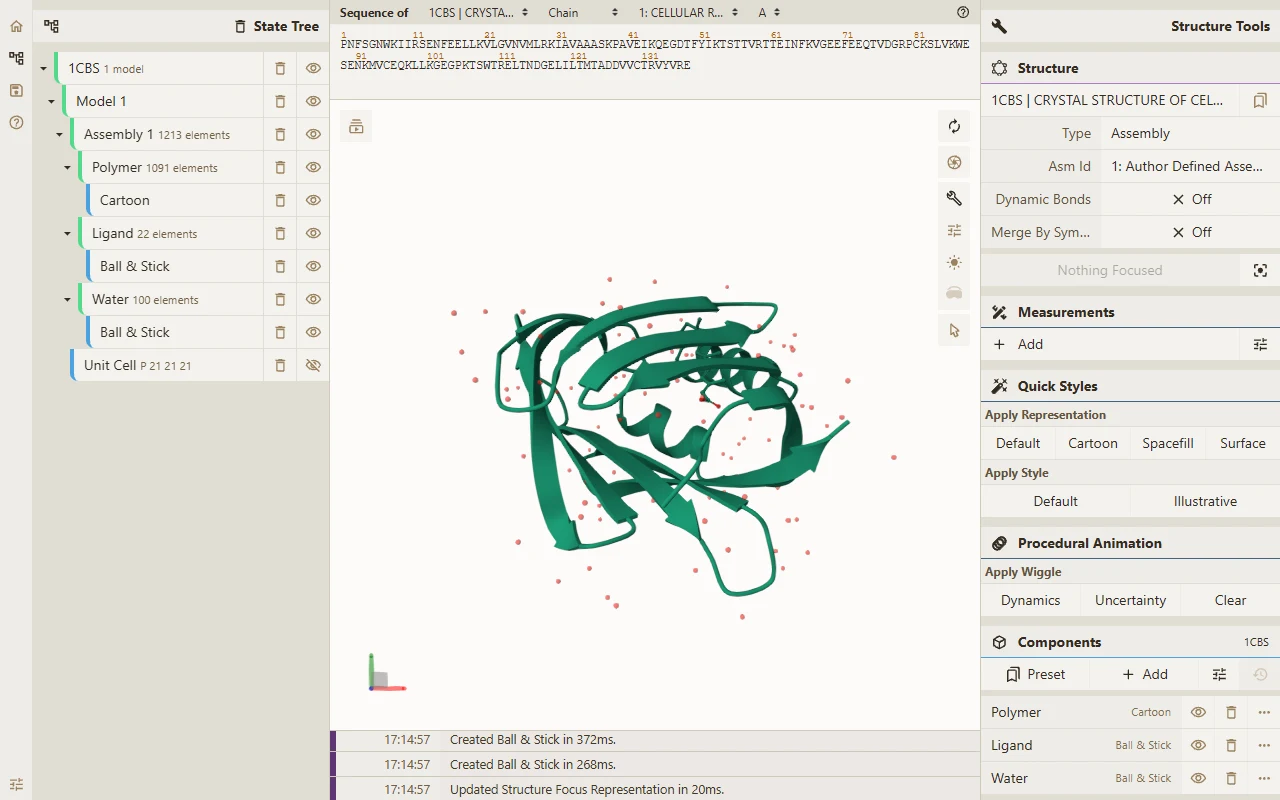
Most of the time the job is simply to see what a PDB entry looks like, and a browser tab is enough. Mol* is the open-source viewer the RCSB PDB uses for its 3D view, and its public version takes the ID in the address: molstar.org/viewer/?pdb=1cbs drew the cartoon, ligand and waters of 1CBS within seconds (Figure 1).[1][4] A state tree on the left lists every component, a sequence strip runs along the top and a tools panel fills the right. That is a lot of controls for a first look, and most of them earn their place once you know where they are.
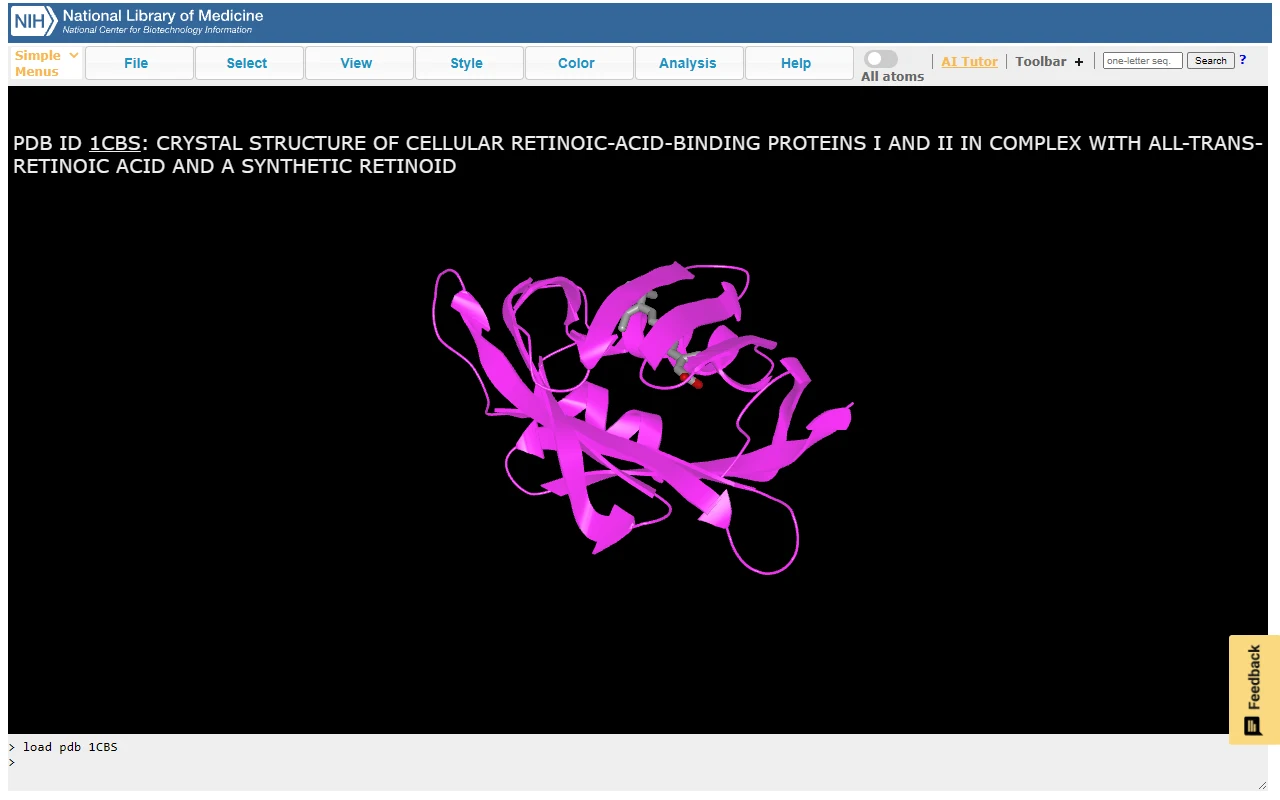
iCn3D is NCBI's answer to the same need. It fetches a structure by ID or opens a local file, and it ties the 3D view to a sequence and annotation panel.[5][7] Its share links are built to outlast the session: the project calls the URLs it generates lifelong.[5] The interface leans on menus, as Figure 2 shows, but one page reaches a wide range of data types.
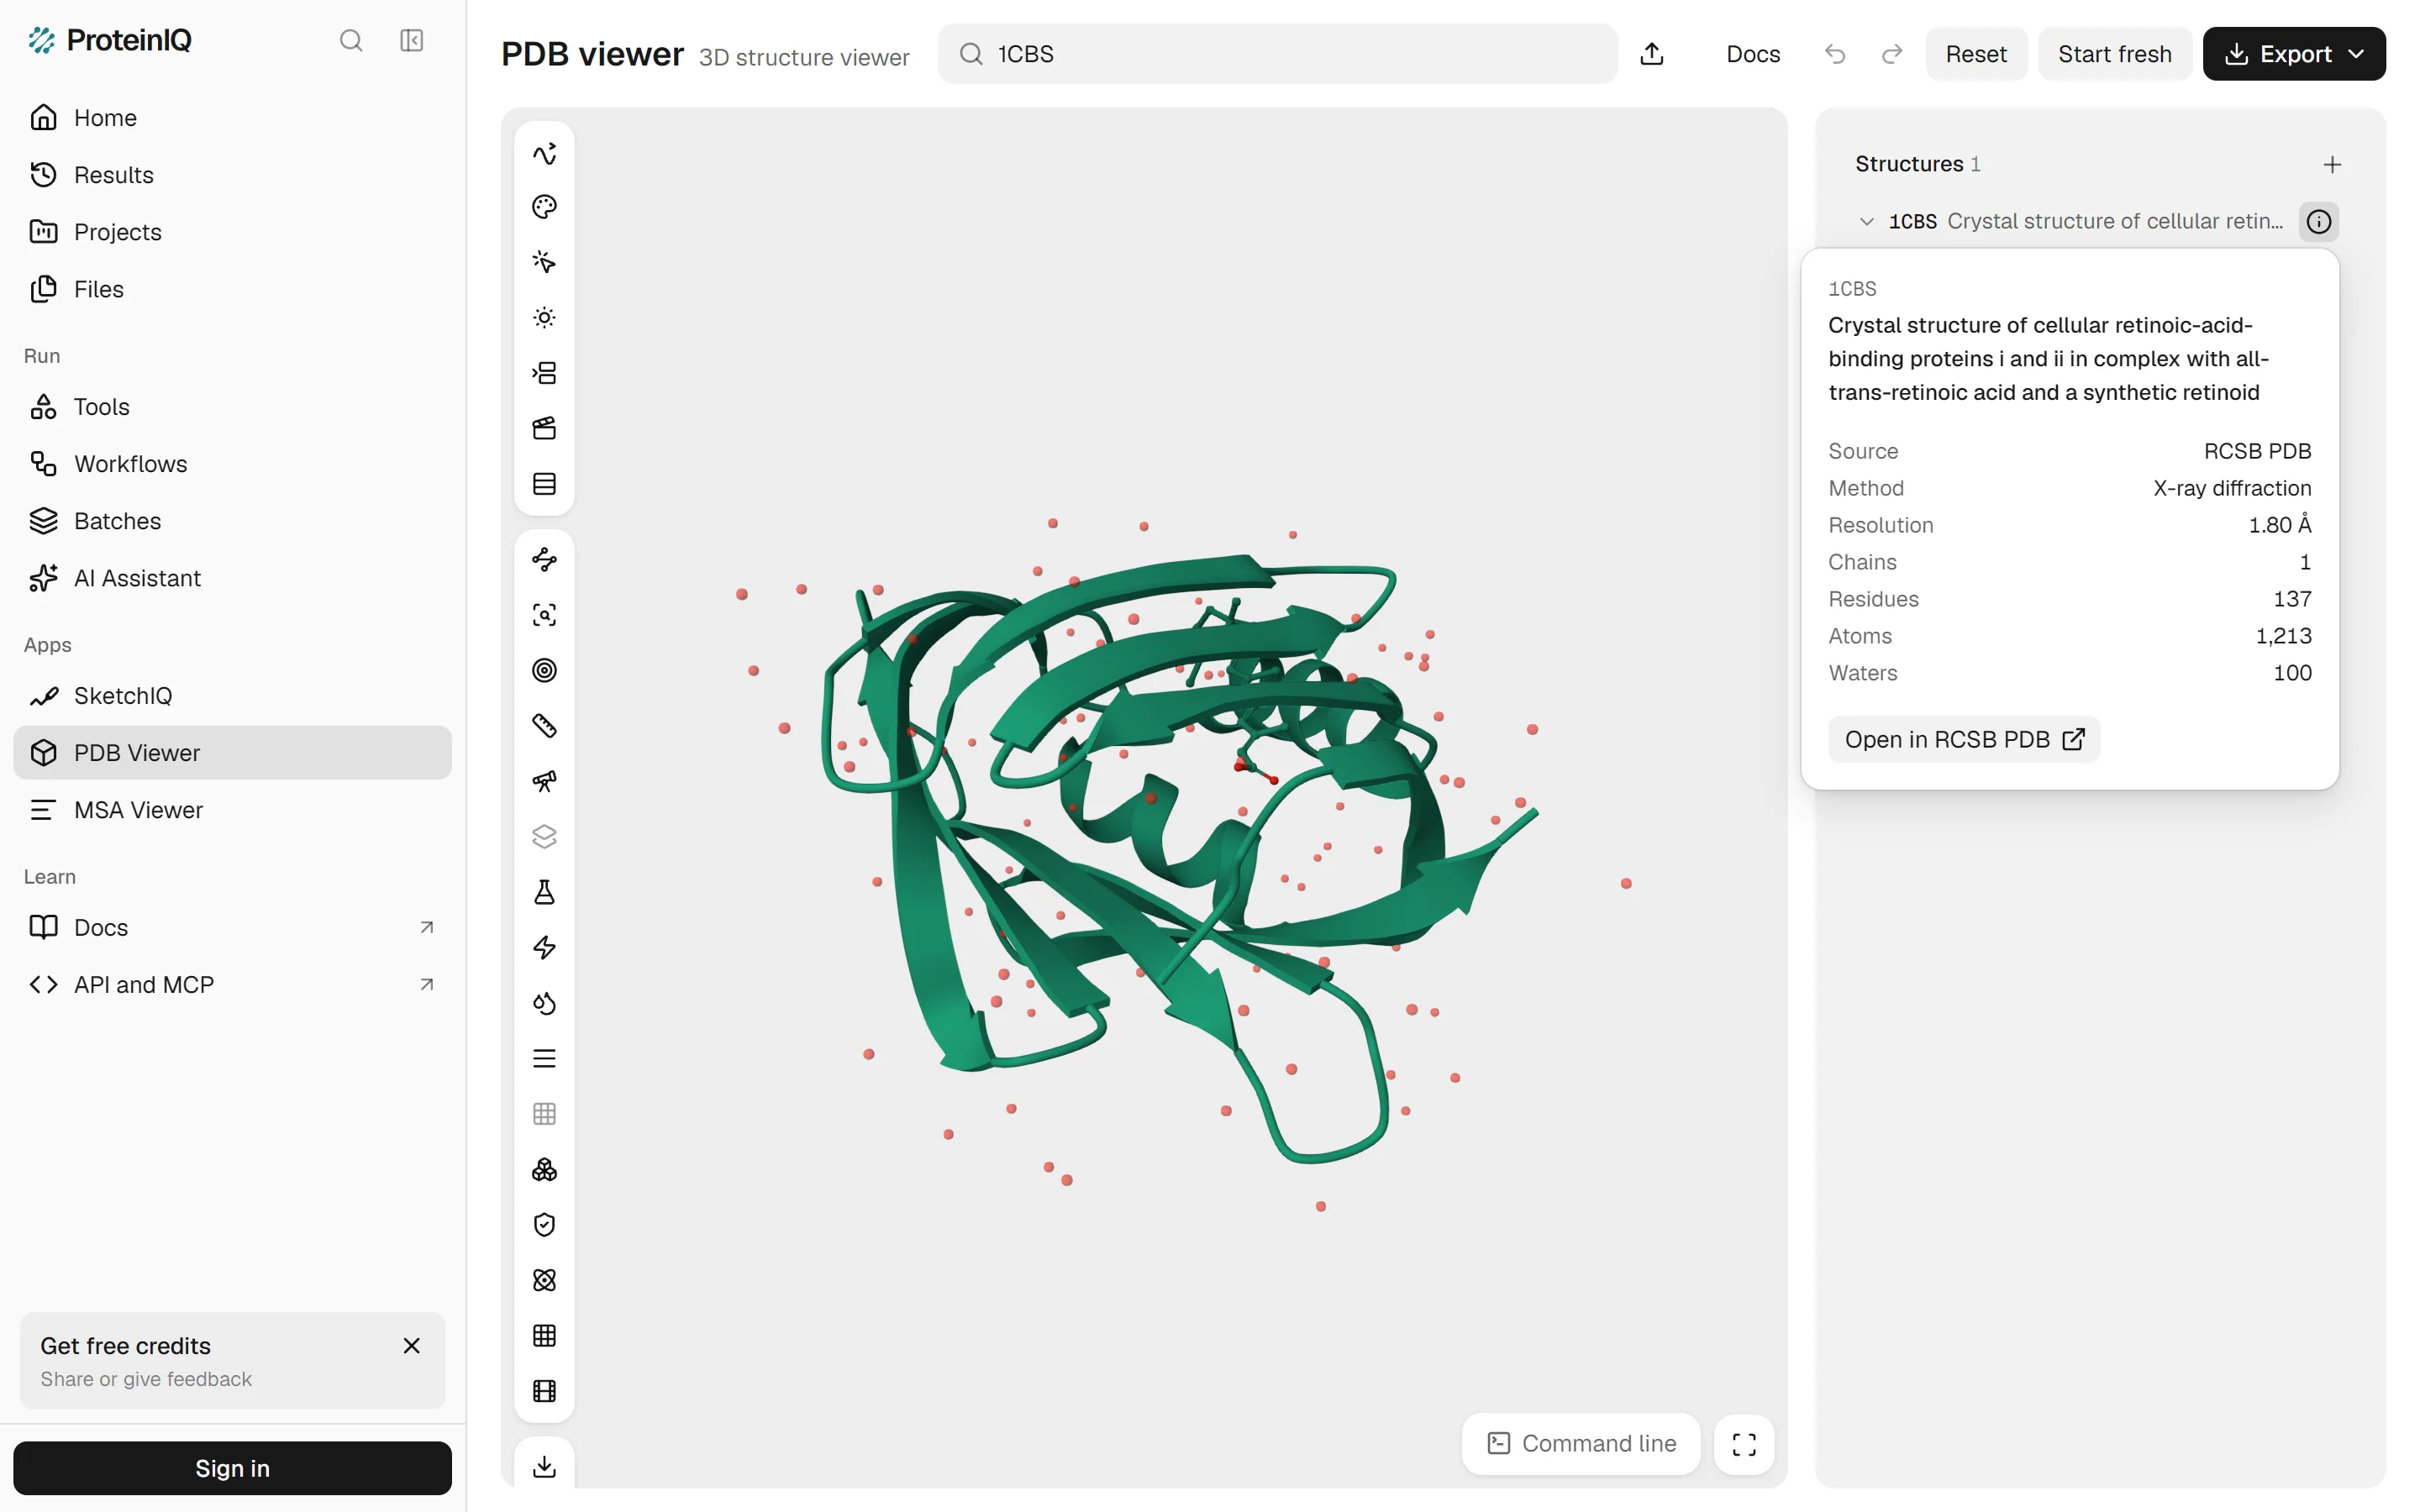
The PDB viewer by ProteinIQ belongs in the same group. Type an ID into its one search box and the structure opens with its title, method and resolution beside it. If you are stuck on a file rather than a viewer, open a PDB file covers the formats and the errors people hit most.
Making a figure
Figures for papers are where the desktop programs still lead, because they give exact control over lighting, labels and resolution. PyMOL, now maintained and distributed by Schrödinger, gives you ray-traced images, scenes and a Python interface.[16]
It also comes with a licence to manage. Schrödinger's builds need a licence generated with its License Manager.[18] Full-time students and educators get an educational subscription free, an academic or nonprofit user pays $99 a year, and a commercial single user at a company of 25 or fewer employees $1,050.[17]
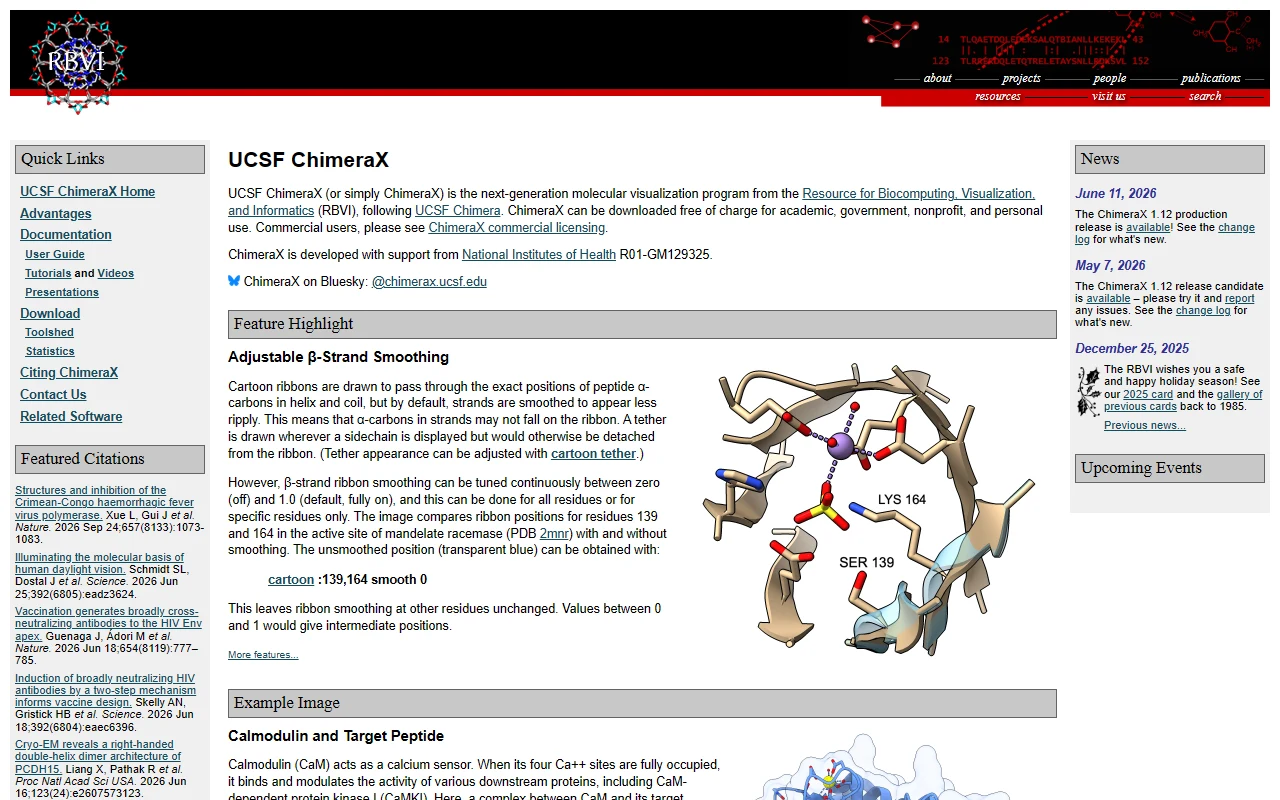
ChimeraX is the other standard, and for academics it costs nothing. It is free for academic, government, nonprofit and personal use; a commercial single-user licence runs three years for $2,000, rising to $2,500 on January 1, 2027.[20][40] Its predecessor, UCSF Chimera, is no longer developed, and UCSF asks users to move to ChimeraX.[23] The two current programs overlap heavily: PyMOL vs ChimeraX works through where they differ, and the free PyMOL alternatives cover the rest of the field.
Two cheaper routes are good enough for a slide and often for a paper. YASARA View, free, lists publication-quality ray-traced images with labels among its functions.[28] In the PDB viewer by ProteinIQ, Export > Image saves a PNG at one, two or four times the canvas size on a transparent, white or black background, and the Lighting menu switches between Flat, Outline, Soft shadows and Ray traced looks.
Analysing a ligand site
Ligand questions are where the programs differ most, because "show me the contacts" can mean a drawing, a table or a handful of typed commands. PyMOL and ChimeraX build the answer from commands, which is flexible and slow the first time. Mol* shows the local non-covalent interactions around a ligand as soon as you focus it.[3] iCn3D keeps a 2D interaction diagram in step with the 3D view and the sequence.[5] YASARA View lists contacts, hydrogen bonds and hydrophobic, π-π and cation-π interactions among its features.[28]
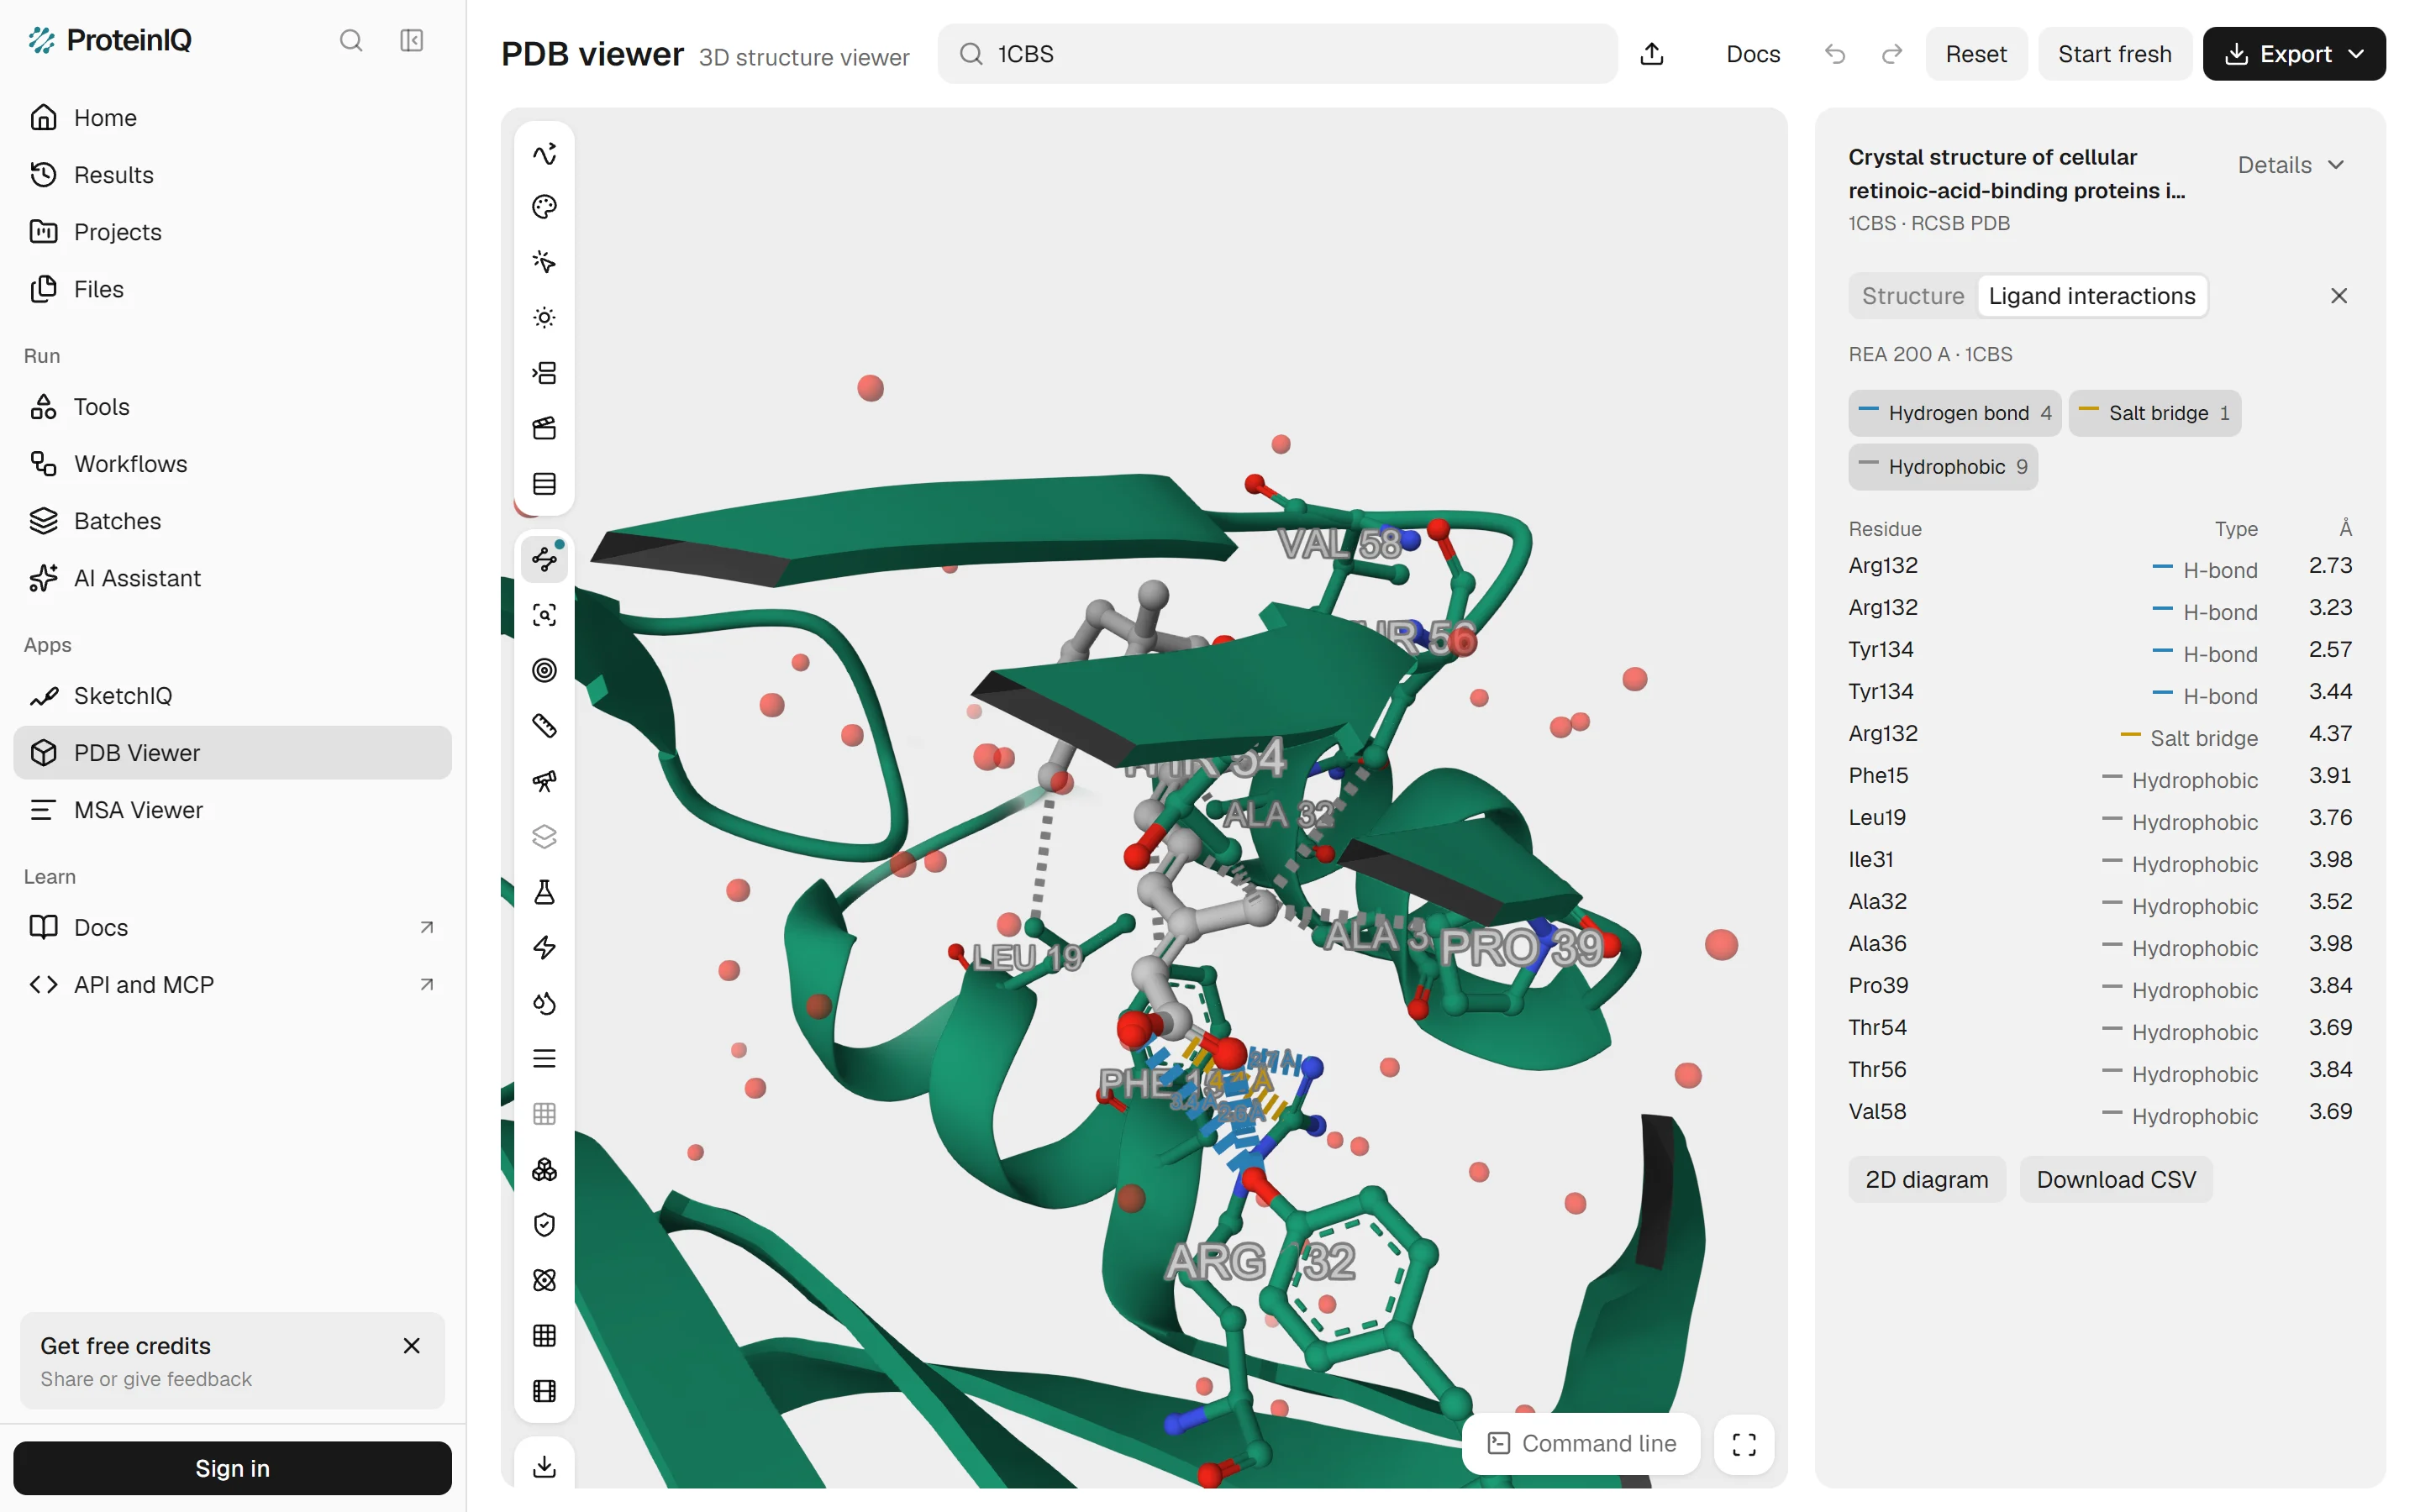
In the PDB viewer by ProteinIQ, type 1CBS into the search box, press Enter and choose Ligand interactions in the left toolbar. It picks the retinoic acid, residue REA, draws dashed lines to the residues around it and lists each contact in the side panel with its type and distance in ångströms. The coloured chips above the table switch each type on or off, in the table and in 3D together.
For 1CBS it found 14 contacts (Figure 5). Arg132 and Tyr134 each make two hydrogen bonds to the carboxylate, at 2.57 to 3.44 Å, and Arg132 adds a salt bridge at 4.37 Å. The other nine are hydrophobic contacts with Phe15, Leu19, Ile31, Ala32, Ala36, Pro39, Thr54, Thr56 and Val58, between 3.52 and 3.98 Å. That is the textbook picture of this pocket: a charged anchor at one end of the acid and a greasy tunnel along the rest.
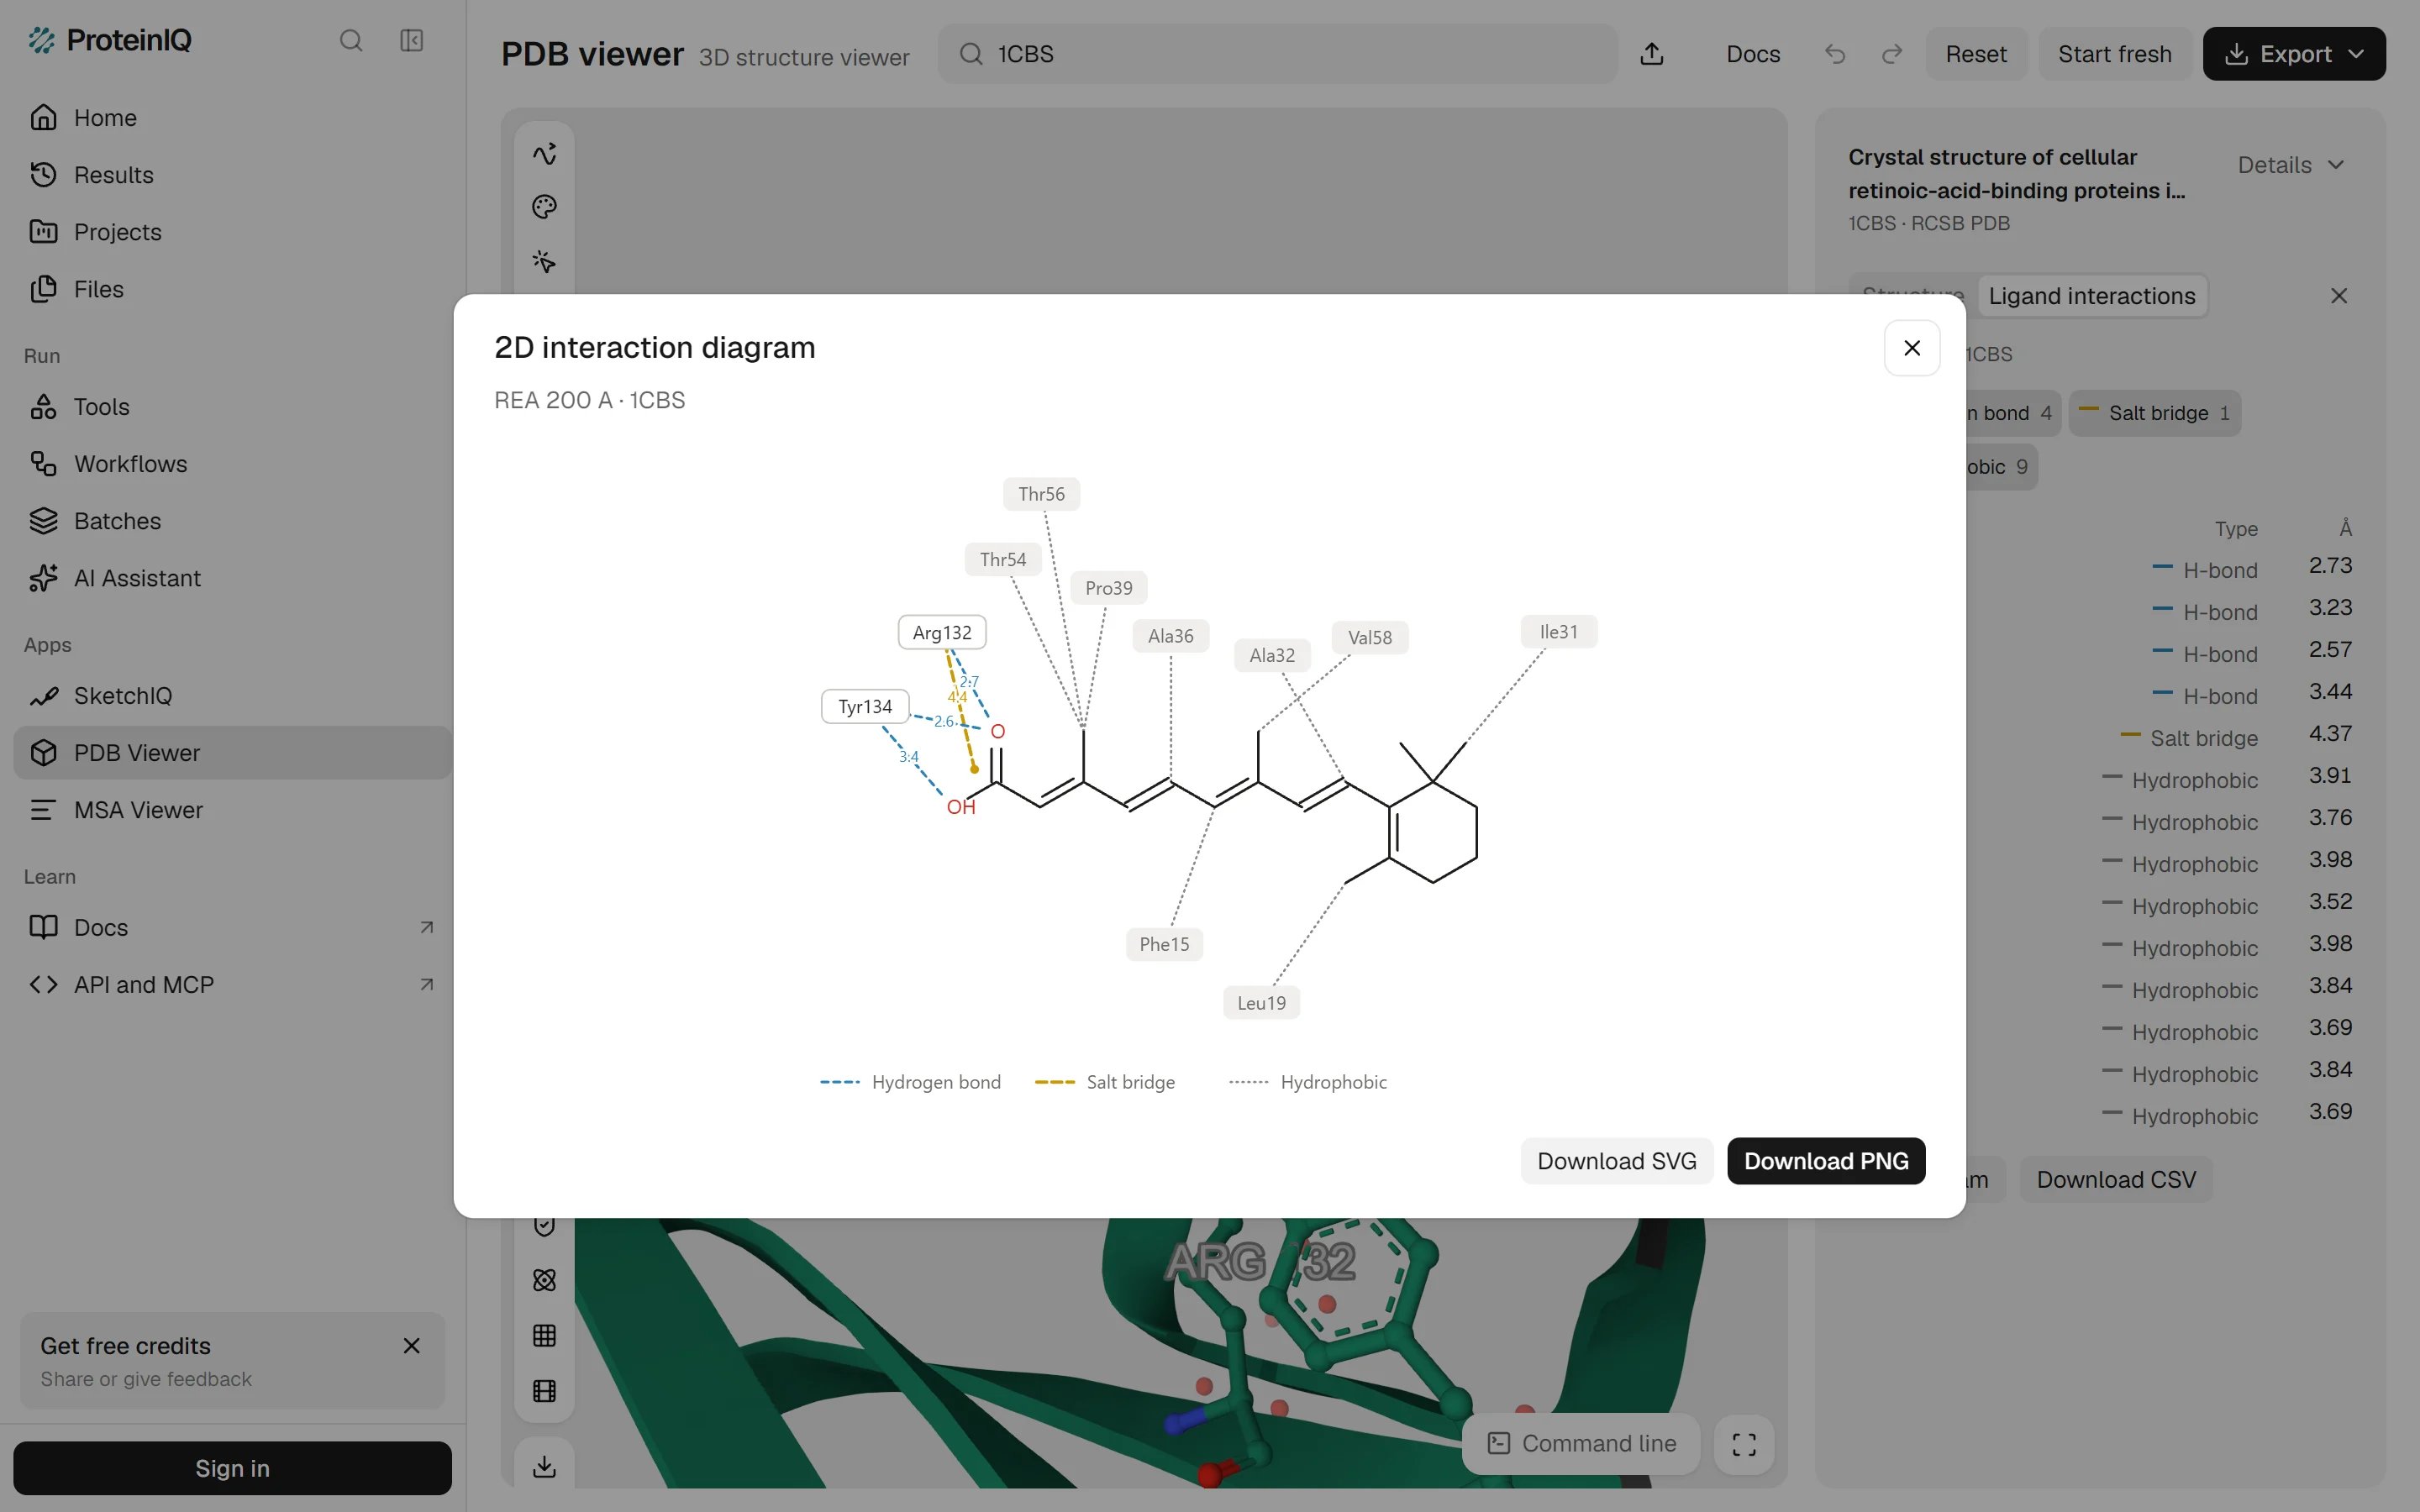
2D diagram redraws the same contacts flat, with the ligand in the middle and every contacting residue placed around it, and Download SVG or Download PNG saves it for a slide. The viewer looks for hydrogen bonds, salt bridges, halogen bonds, metal coordination, π-stacking, cation-π and hydrophobic contacts with Mol*'s default geometry, which defines each of the protein-ligand interaction types by its own distance limit. It does not list water-mediated contacts.
Programs disagree on these counts more than you might expect. Run on indinavir in HIV-1 protease, PLIP, PoseView and this viewer return three different hydrogen-bond lists, as the Discovery Studio Visualizer alternatives comparison shows contact by contact.
Viewing a trajectory
Molecular dynamics output is the one job where the long-established answer is still the best one. VMD reads DCD, XTC and TRR files, animates and analyses them, and has Tcl and Python scripting built in.[24][27][38] Academic, research and internal business use is free, commercial use needs a licence, and the download asks you to register.[25][26] Version 1.9.4 is offered for Windows, macOS and Linux, while 2.0.0, released on March 25, 2026, is so far a Linux build only.[24][26]
The others handle trajectories as an extra. ChimeraX opens DCD, XTC and TRR files over a topology, plots distances and angles across frames and clusters frames.[22][39] PyMOL loads trajectories through its molfile plugins, with DCD and XTC as the documented examples.[19] Mol* plays trajectories in the browser, and iCn3D lists DCD and XTC support.[37][5] YASARA View cannot read simulations at all; that belongs to YASARA Dynamics, a paid stage.[28] For a closer look at the trajectory programs, see the VMD alternatives.
Embedding a structure in a web page
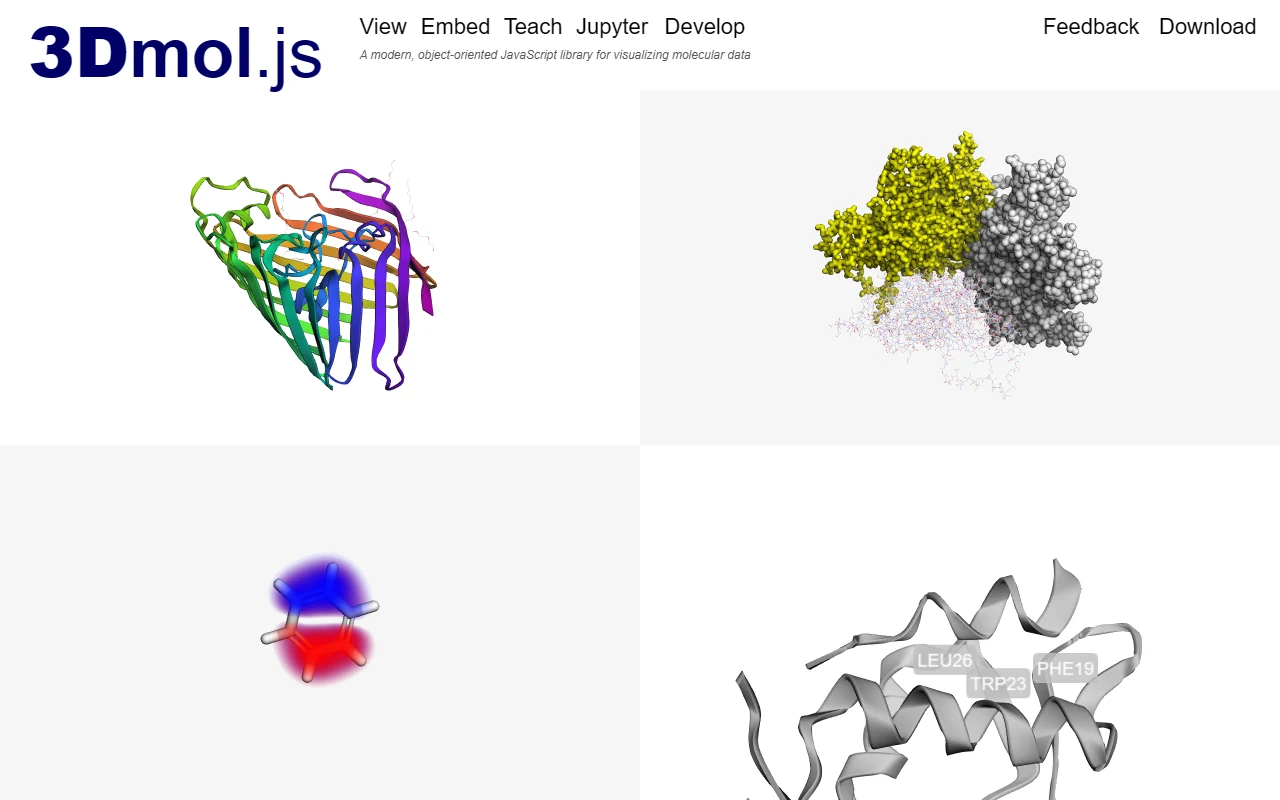
If the structure has to live on your own page, you want a library rather than an application. 3Dmol.js is the lightest: give a div the class viewer_3Dmoljs, set data-pdb to an ID, and the structure appears.[11] It is released under the BSD 3-clause licence, and its latest release is 2.5.5 from May 2026.[10][12]
Mol* can be embedded in third-party pages and ships as an npm package.[37] NGL is a single JavaScript file with an API under the MIT licence; its latest npm version is 2.5.0, and its last commit was on September 3, 2026.[8][9] JSmol runs Jmol on the browser's HTML5 and JavaScript engines with no Java, and iCn3D embeds in an iframe.[13][7]
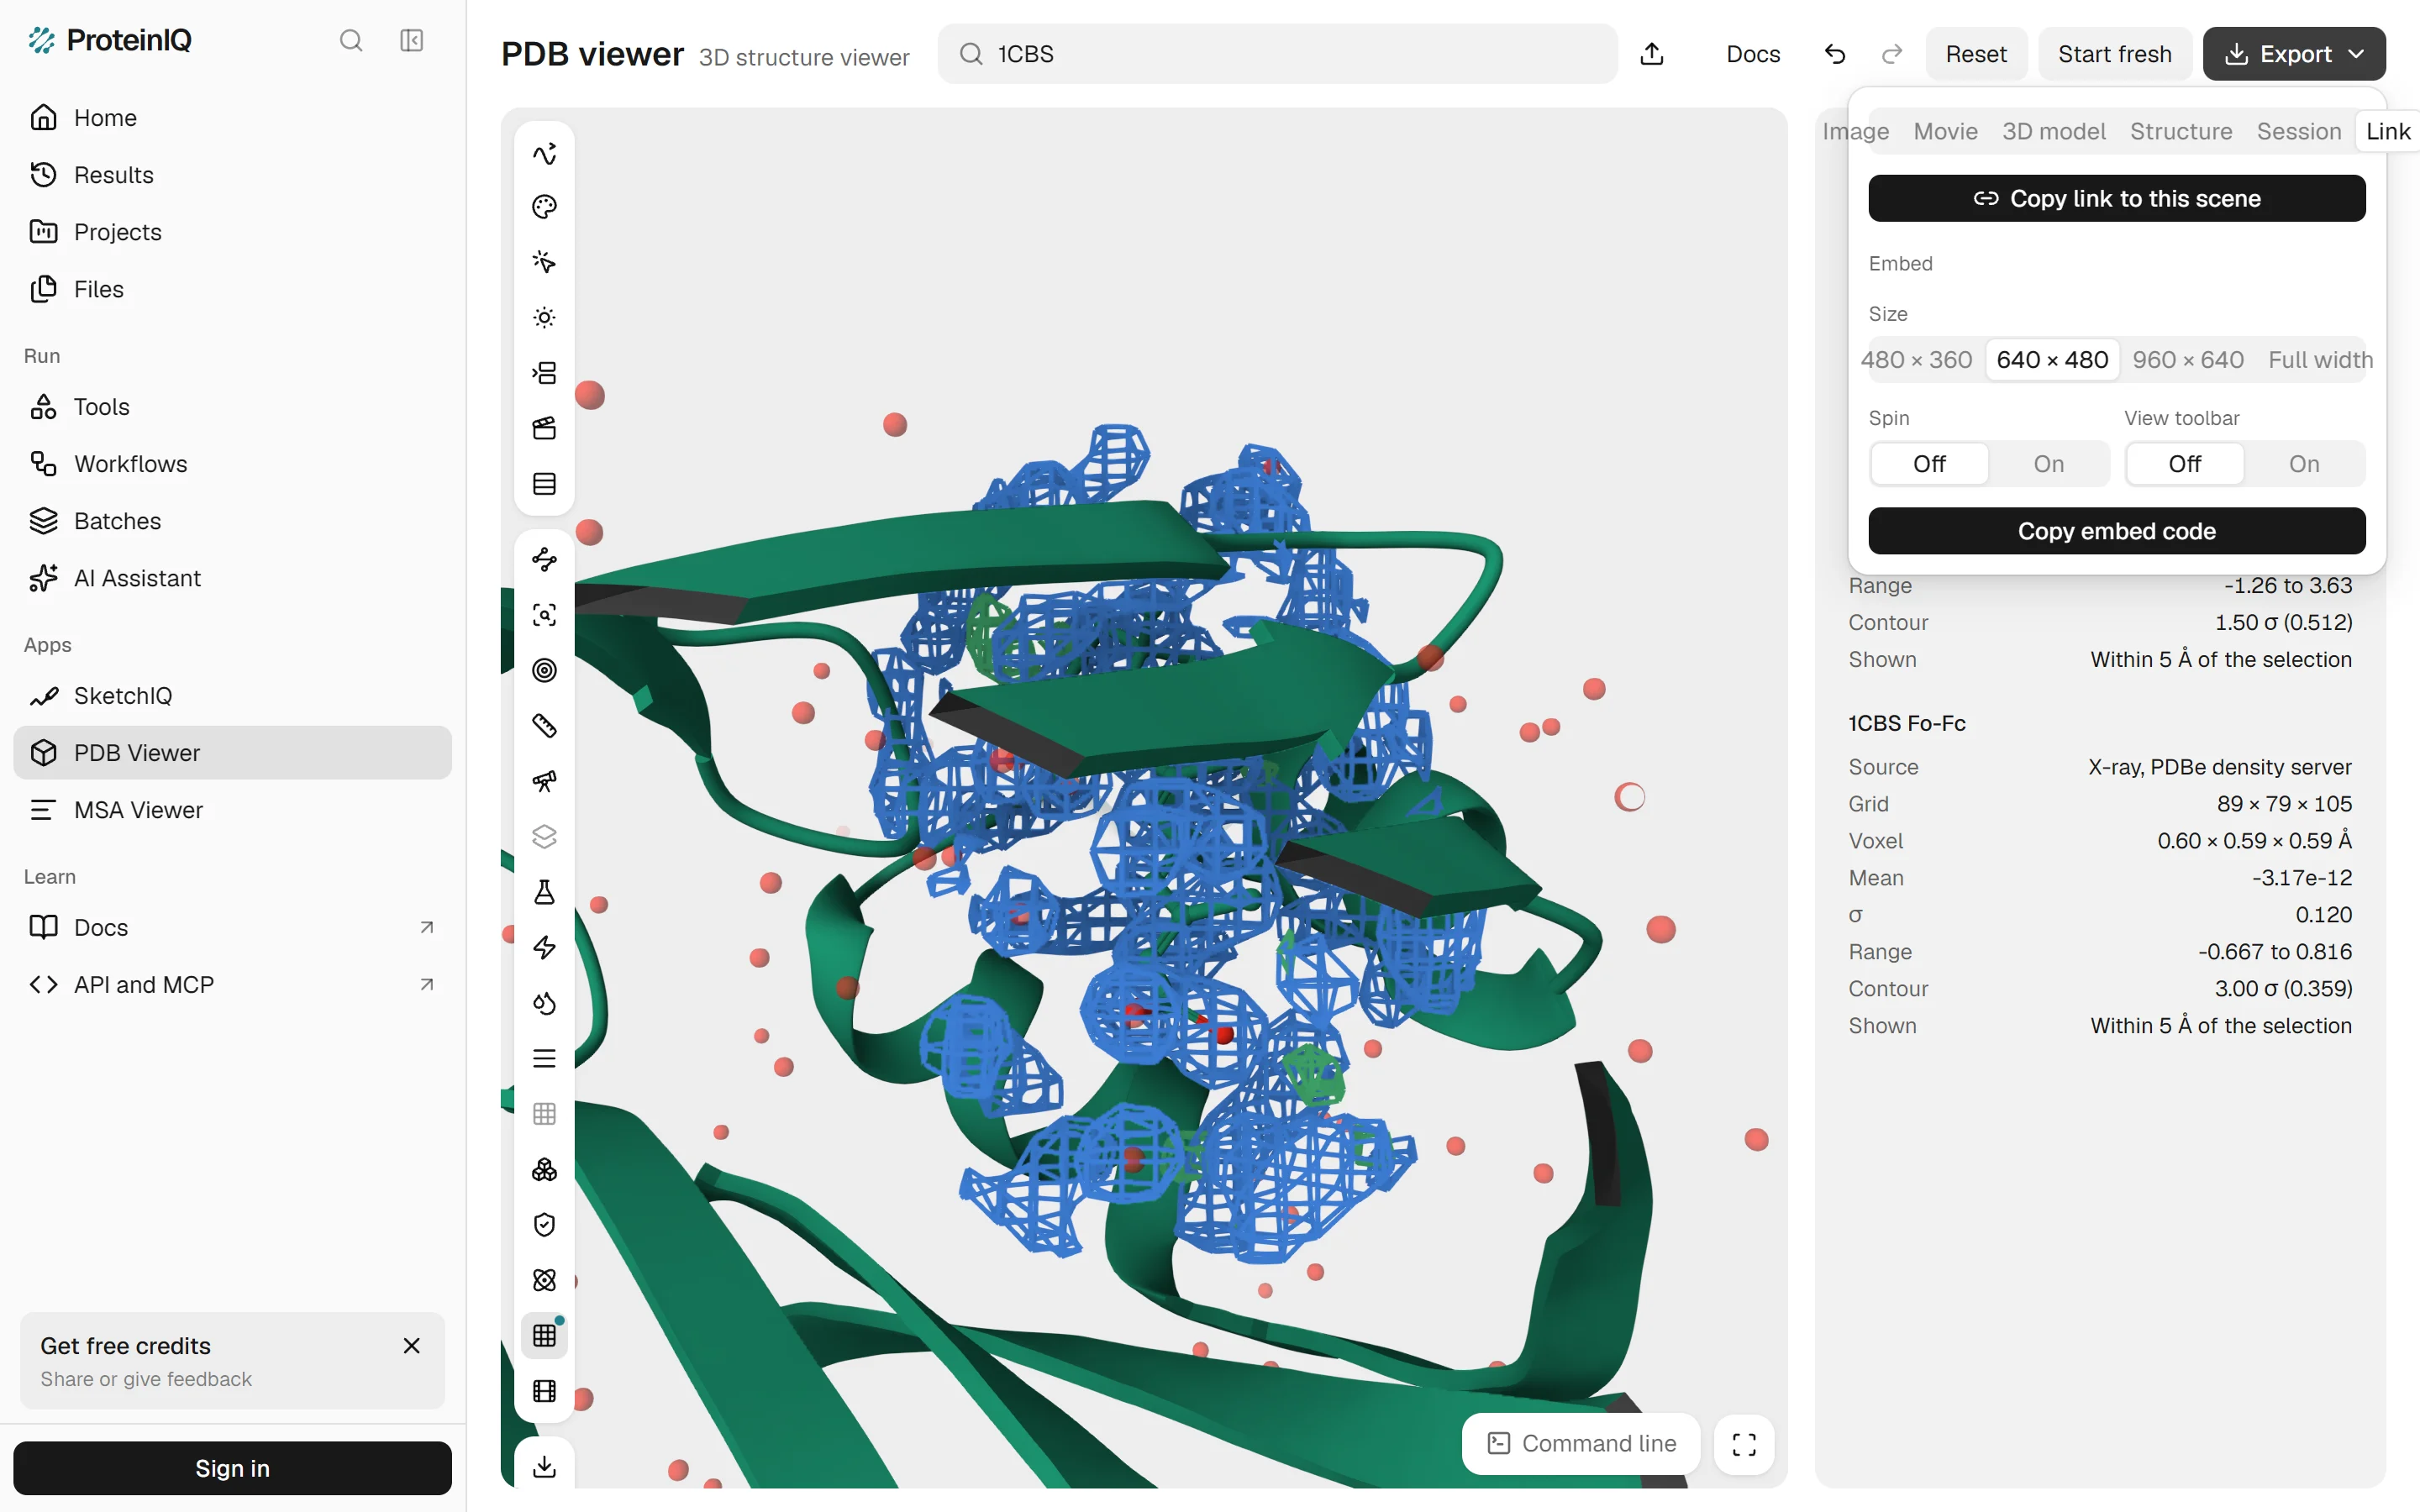
The PDB viewer by ProteinIQ needs no code at all. Export > Link copies a link that reopens the same scene, styles and camera, and Embed under it gives HTML for your own page, with a size, a spin option and an optional toolbar. Both reload the structure from the public databases, so a scene built only from your own files cannot be shared this way.
Working with density maps
A map asks more of a viewer than atoms do, because it has to contour a volume at a level you choose. ChimeraX has a Volume Viewer for maps and image data.[35] Mol* has a density panel for structures solved by X-ray crystallography or cryo-EM, and iCn3D reads electron density from MTZ, CCP4 or DSN6 files as well as EM maps.[3][5] Swiss-PdbViewer reads electron density maps too, though it is an older program.[30]
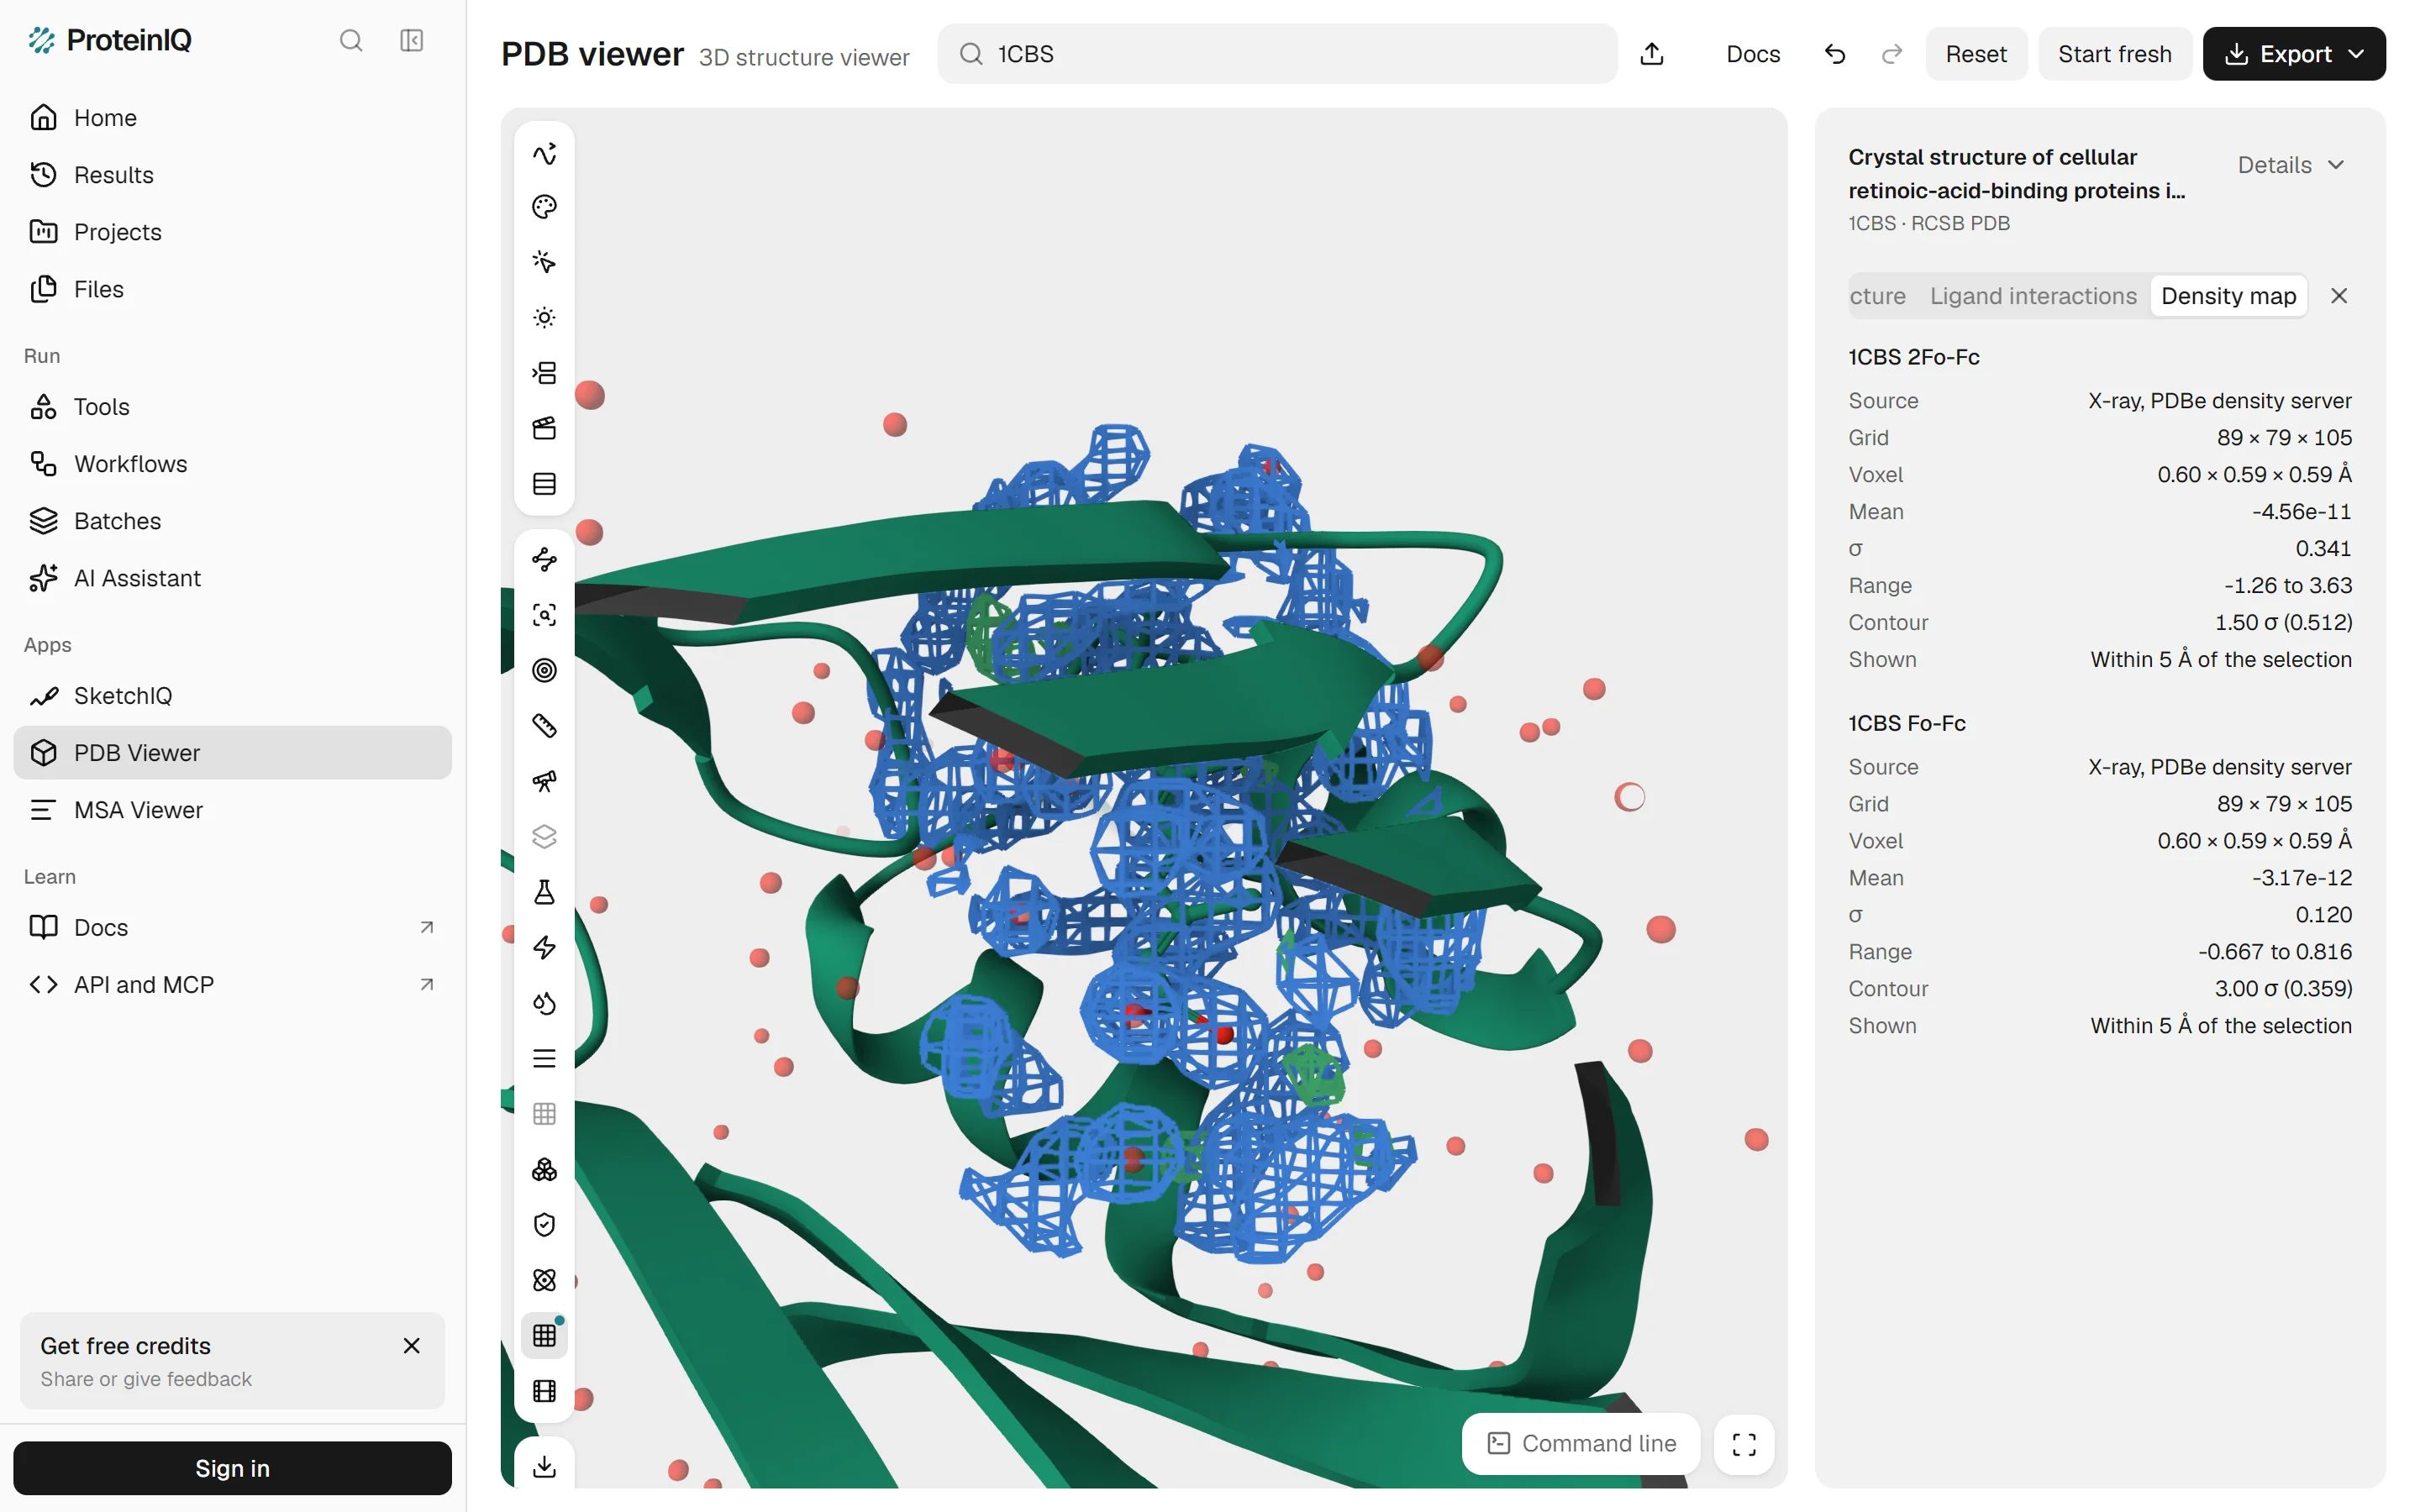
For crystal structures, the PDB viewer by ProteinIQ loads the deposited maps in one step. Open an X-ray entry by its ID, click Density map and then Load electron density. It draws the 2Fo-Fc map as a blue mesh at 1.5 σ and the Fo-Fc difference map at 3 σ, cut to within 5 Å of the largest ligand, from maps computed by the PDBe density server. Entries without deposited structure factors, and NMR entries, have no X-ray map to load.
To check what the mesh shows, we sampled PDBe's 2Fo-Fc and Fo-Fc maps for 1CBS at each of the 22 atoms of retinoic acid, with trilinear interpolation and σ taken as the standard deviation of each map. All 22 atoms sit in 2Fo-Fc density between 1.8 and 4.8 σ, above the 1.5 σ contour. The Fo-Fc values at the same atoms run from -1.1 to +0.9 σ, nowhere near the 3 σ cut-off in either direction. That is what a well-placed ligand looks like in an electron density map (Figure 9).
Other programs worth knowing
Several names on lists of molecular viewers are not first picks for any job above, but each still has users for a reason.
Jmol and JSmol
Jmol is free, open source under the LGPL and still active: the latest release on SourceForge is 16.5.7, from October 27, 2026.[13][14] The desktop program needs Java, while JSmol, its browser version, runs on HTML5 and JavaScript alone.[13] Many older teaching pages and journal supplements are built on it, which is why people still search for it by name. For a new page, 3Dmol.js and Mol* are the more common choices.
YASARA View
YASARA View is free, and its product page says it contains every function you need to explore a macromolecular structure interactively.[28] The paid stages add modelling, simulation and docking. Model is free for academic users and $720 for a commercial single user; Dynamics costs $390 for academics and $3,120 commercially, and Structure $540 and $4,680.[28] Research with commercial interests needs a commercial licence.[29]
Swiss-PdbViewer (DeepView)
Swiss-PdbViewer, also called DeepView, was for years the classroom program for superposing structures, mutating residues and reading density maps.[30] It has stood still since. The current version is 4.1, with a Windows build, macOS builds that the site says will not run on Catalina or later, and Linux support only through Wine.[30] The site lists no price, and its licence forbids modifying or redistributing the program. Use it if an old course or workflow depends on it, not for anything new.
Avogadro
Avogadro is a free, BSD-licensed molecular editor and viewer for Windows, macOS and Linux, and version 2.1.0 came out on October 23, 2026.[31][32] It is at its best building and cleaning up small molecules in 3D, though its release notes also report PDB biological assemblies tested up to about one million atoms.[32]
Discovery Studio Visualizer
BIOVIA Discovery Studio Visualizer is free to download after registration, and BIOVIA describes it as a molecular modelling application for viewing, sharing and analysing protein and small-molecule data.[33][34] The pages we could read give no version, platforms or licence terms, so read the licence in the installer before using it for commercial work.
Alignments are a separate job from structures. To view and edit a multiple sequence alignment rather than a 3D model, open it in ProteinIQ's MSA viewer or one of the Jalview alternatives.
The PDB viewer by ProteinIQ
The viewer is free and needs no account. Type a PDB ID, a UniProt accession or a compound name into the search box, or drop a file on the canvas: PDB, mmCIF, SDF, MOL2 and PDBQT files open, and so do AlphaFold DB models by accession. It draws with the Mol* engine, so it shows what Mol* shows, and its command line follows PyMOL's syntax, so select, show and align work as a PyMOL user expects.
What ProteinIQ adds is analysis around the view: the contact table and 2D diagram above, superposition with RMSD and TM-score, mutation from a rotamer library, clash and validation checks, and a Send to menu that opens a structure in AutoDock Vina, PDBFixer or Boltz-2. Those tools show their price first and run only when you submit. The info button beside an entry shows its source, method and resolution: for 1CBS, X-ray diffraction at 1.80 Å, 1 chain, 137 residues, 1,213 atoms and 100 waters (Figure 10).
Where the PDB viewer by ProteinIQ is weaker
It is younger than PyMOL, ChimeraX or VMD, and none of its features has decades of daily use behind it. It renders on your graphics card through WebGL, so structures with hundreds of thousands of atoms, such as ribosomes, load slowly on laptops and phones.
Its PyMOL support is a subset. Commands and short Python scripts run, but there are no plugins and no NumPy, and although it opens .pse sessions, it saves its own .molx files instead.
There is no Jupyter widget, no live multi-user session and no map segmentation, and it does not compute maps from your own structure factors. Share links and embeds reload structures from public databases, so a scene made of your own files cannot be shared as a link. For a paper figure with exact control over labels and ray-traced shadows, PyMOL and ChimeraX remain the safer choice.
Protein visualization tools on ProteinIQ
Start in the viewer, then move to a dedicated tool when you need one number or a file in a different format.
| Task | Tool |
|---|---|
| View a multiple sequence alignment on its own | MSA viewer |
| List protein-ligand contacts from a structure | PLIP |
| Plot backbone torsions and find outliers | Ramachandran plot |
| Check clashes, rotamers and an overall quality score | MolProbity |
| Draw a small molecule before docking it | SketchIQ |
Which protein visualization software should you choose?
A student opening their first PDB entry, and a chemist checking a docked pose, can stay in the browser: Mol* for a look, the PDB viewer by ProteinIQ when they also want the contacts, a diagram or a PyMOL command. Someone preparing figures for a paper should install ChimeraX or PyMOL, and check which licence applies first, since each is free for some users and paid for others on different terms. VMD is still the program to learn for simulations, and anyone building a page of their own should try 3Dmol.js before Mol*.
The remaining programs fill narrower gaps. Avogadro builds small molecules, YASARA View is a free route to ray-traced images, and Jmol, Swiss-PdbViewer and Discovery Studio Visualizer matter mostly where a course or an older workflow already depends on them.
Frequently asked questions
What is the best free protein visualization software?
There is no single best, because the jobs differ. For a quick look, Mol* and iCn3D are free in a browser, and the PDB viewer by ProteinIQ needs no account. For figures, ChimeraX is free for academic, government, nonprofit and personal use, and PyMOL is free for full-time students and educators.[20][17]
Is PyMOL free?
Partly. Schrödinger's PyMOL build needs a licence: educational subscriptions are free for full-time students and educators, and other users pay, from $99 a year for academic and nonprofit use.[17] The source code is published under a BSD-like licence on GitHub.[36] Use within your job at a for-profit company needs a commercial purchase by your employer.[17]
Is Jmol still maintained?
Yes. The latest release on SourceForge is 16.5.7, dated October 27, 2026, and the source repository shows commits in late October 2026.[14][15] The desktop version needs Java, and JSmol runs in a browser without it.[13]
Does Swiss-PdbViewer still work?
On Windows, yes. The site says it is a 32-bit application that will not run on macOS Catalina or later, and it supports Linux only through Wine.[30] We found no release newer than version 4.1.
Can I view a 3D protein structure without installing anything?
Yes. Mol* at molstar.org, iCn3D at NCBI and the PDB viewer by ProteinIQ all run in a browser with WebGL and fetch a structure by its PDB ID.[4][7] In the PDB viewer by ProteinIQ, files you open from your computer are read in your browser and not uploaded.