Protein structure guides
Guides on predicting, scoring, and comparing protein structures with AlphaFold, Boltz, and related tools.
Structures ·
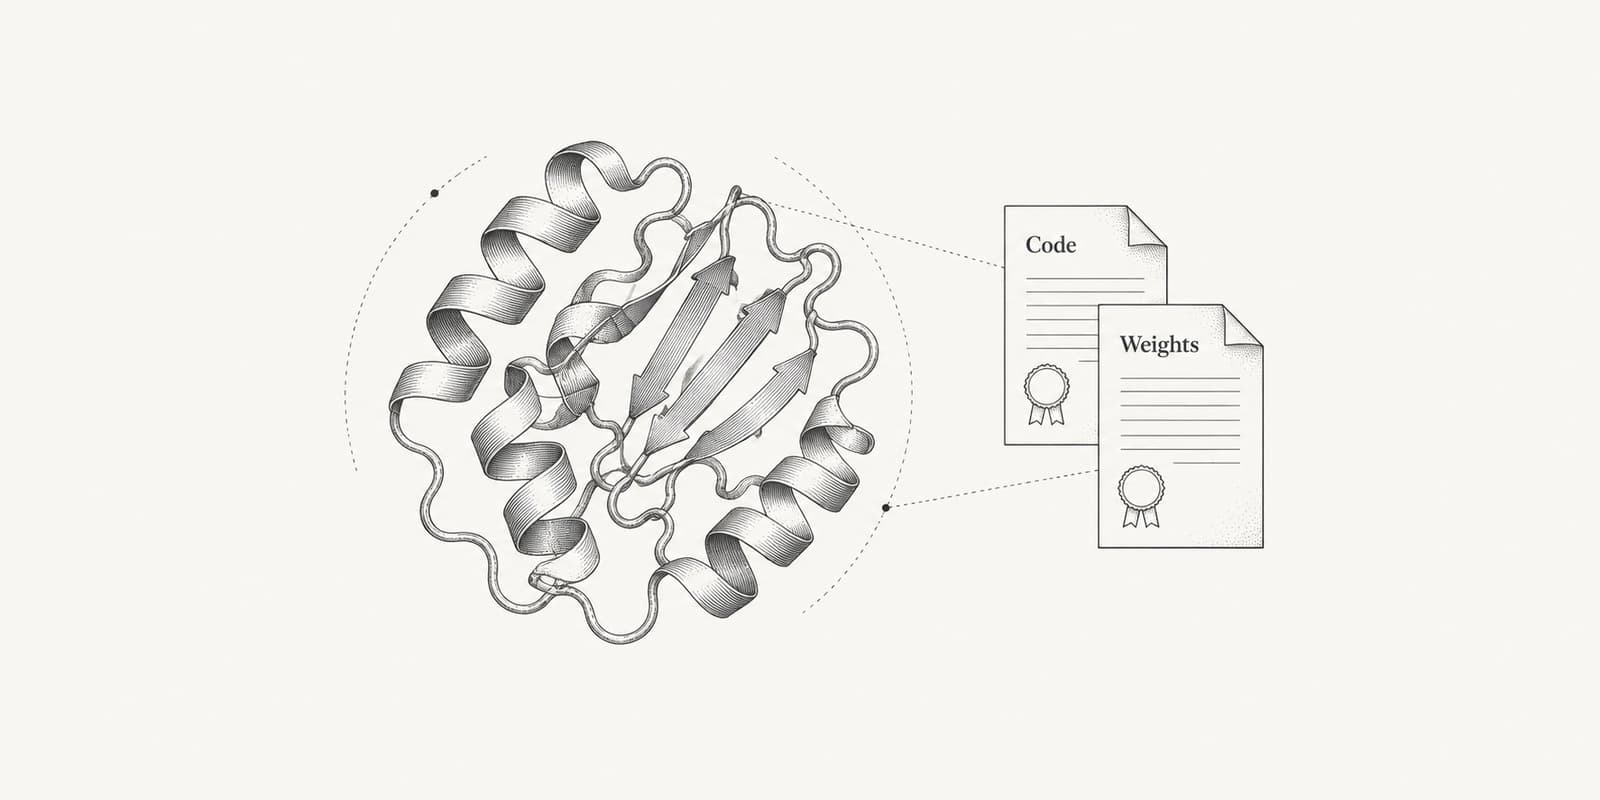
AlphaFold license and commercial use
AlphaFold 2 and the AlphaFold Database allow commercial use, while the AlphaFold 3 weights and AlphaFold Server do not. See what each license allows and which models, including Boltz-2, Chai-1, RFdiffusion and ESM, companies can use.
Structures ·
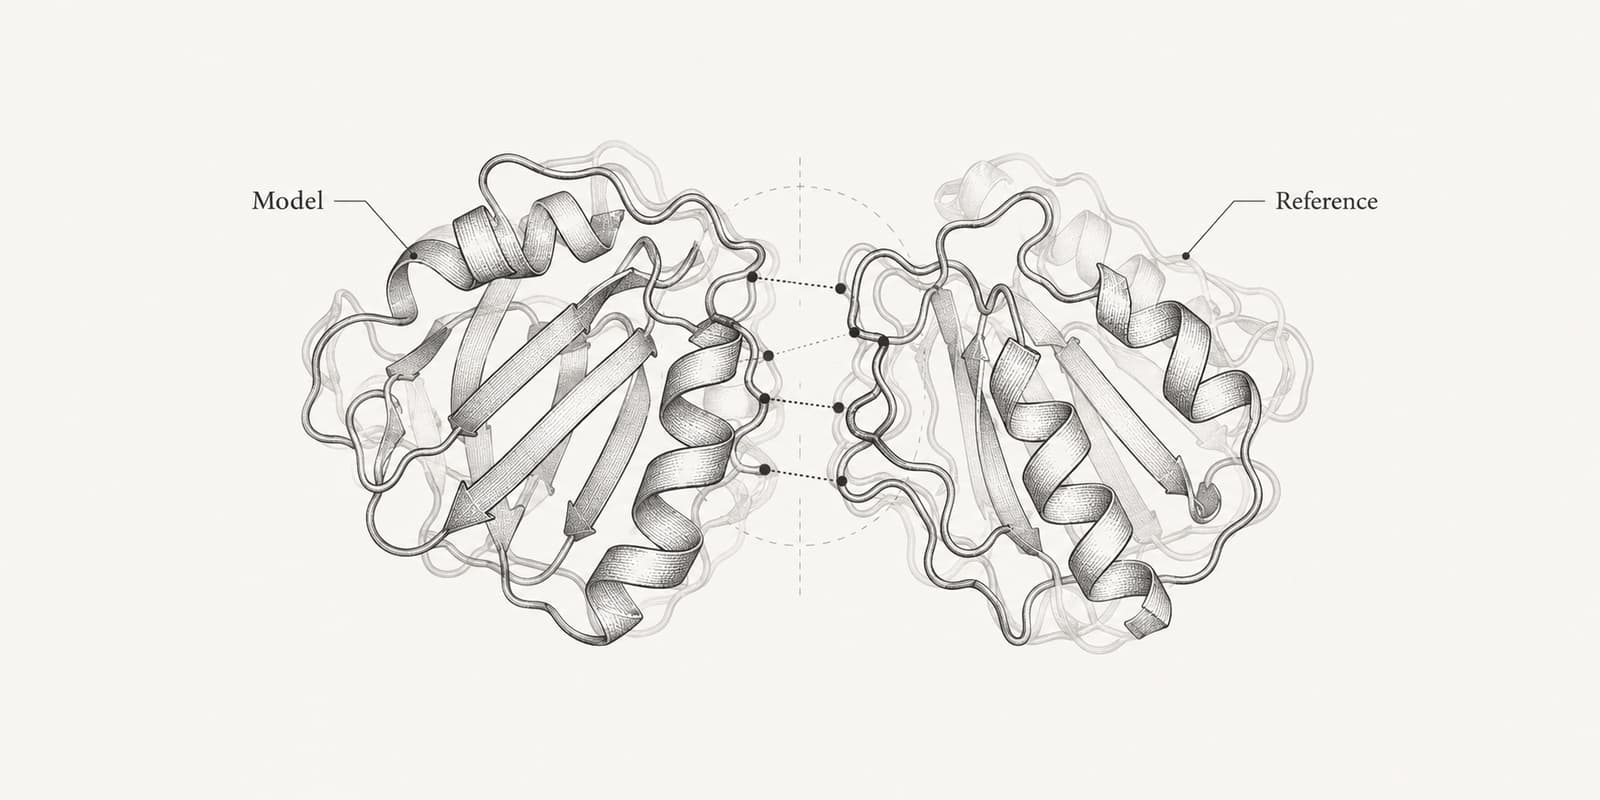
DockQ score explained
DockQ scores how closely a predicted protein complex matches a reference interface, from 0 to 1, with CAPRI cutoffs at 0.23, 0.49 and 0.80. Learn how it combines fnat, iRMSD and LRMSD, and how pDockQ estimates it with no reference.
Structures ·
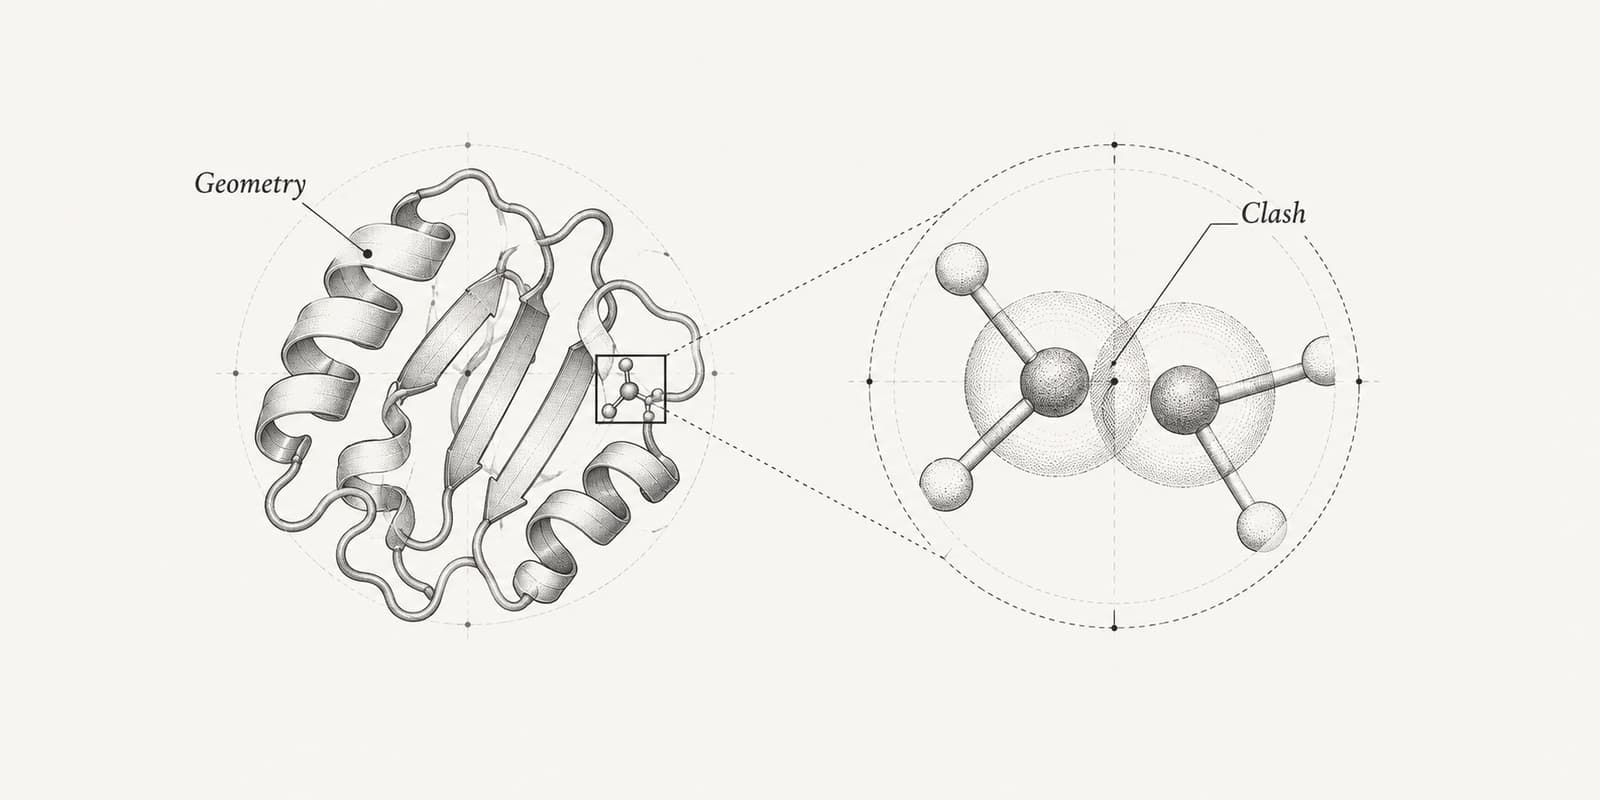
What the MolProbity score and clashscore mean
The MolProbity score combines clashscore, rotamer outliers and Ramachandran favored residues into one number on the scale of crystallographic resolution. Learn what counts as good and how AlphaFold models score.
Structures ·
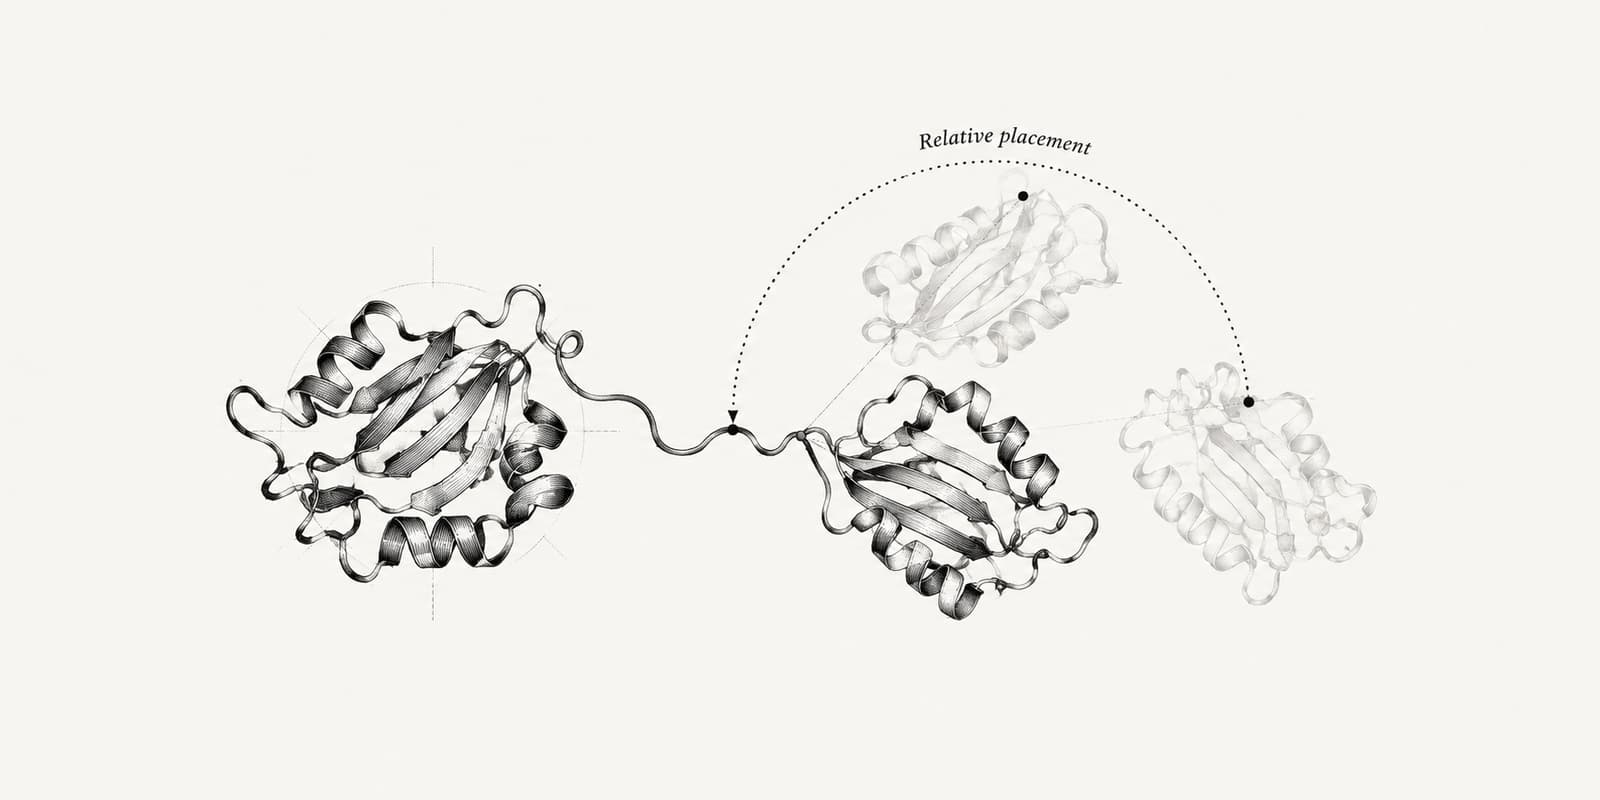
What is PAE, and how to read a PAE plot
PAE (predicted aligned error) is the pairwise confidence matrix that AlphaFold, Boltz and Chai-1 write next to a predicted structure. Learn how to read its blocks and stripes and use it for domains and interfaces.
Structures ·
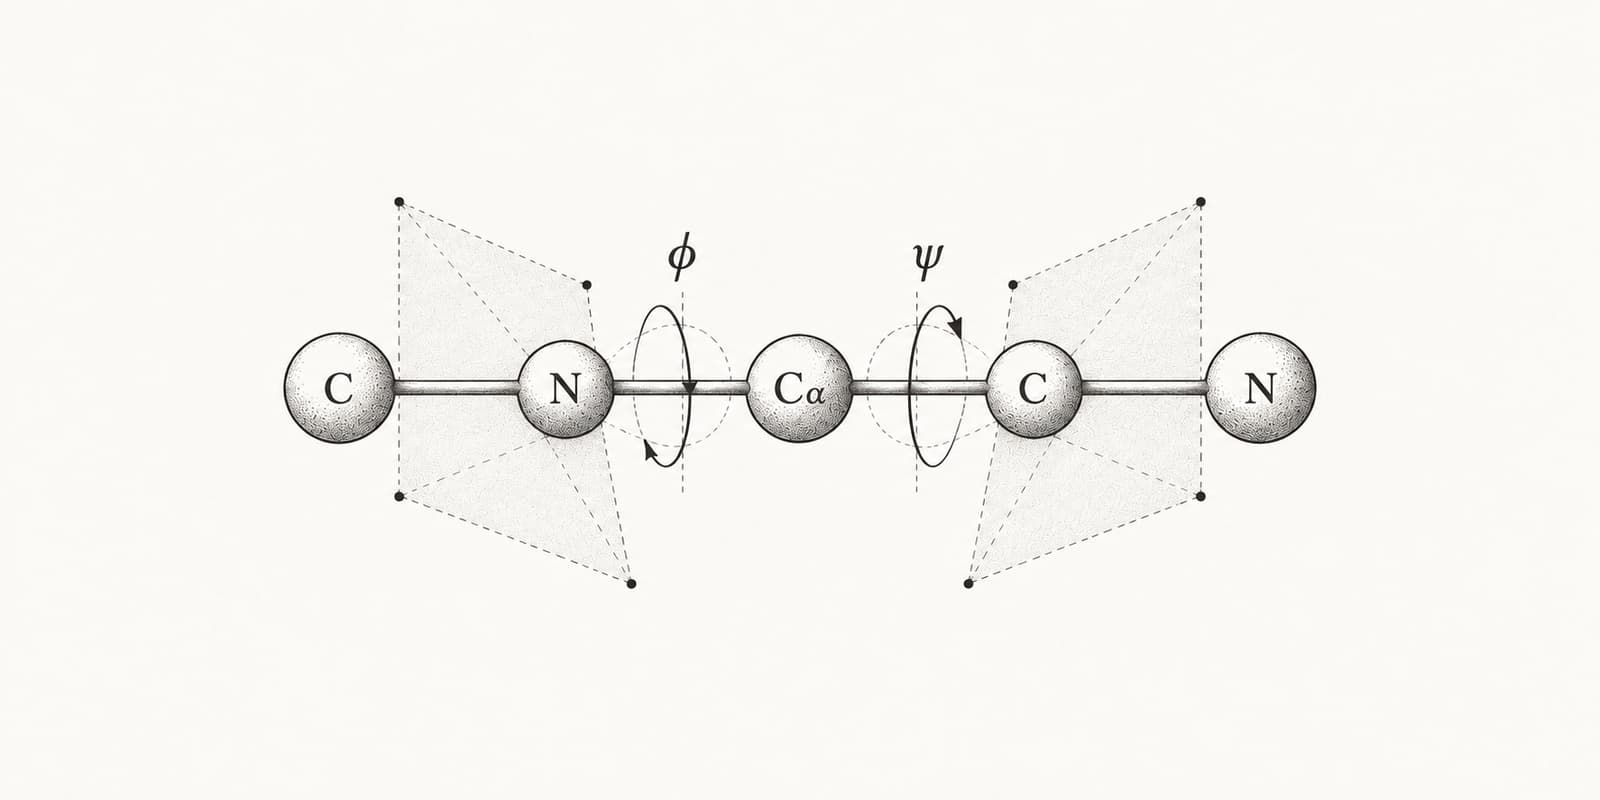
How to read a Ramachandran plot
A Ramachandran plot shows the phi and psi backbone angles of every residue in a protein. Learn what the regions mean, what percentages a good structure has, and how to tell a model error from a strained residue.
Structures ·
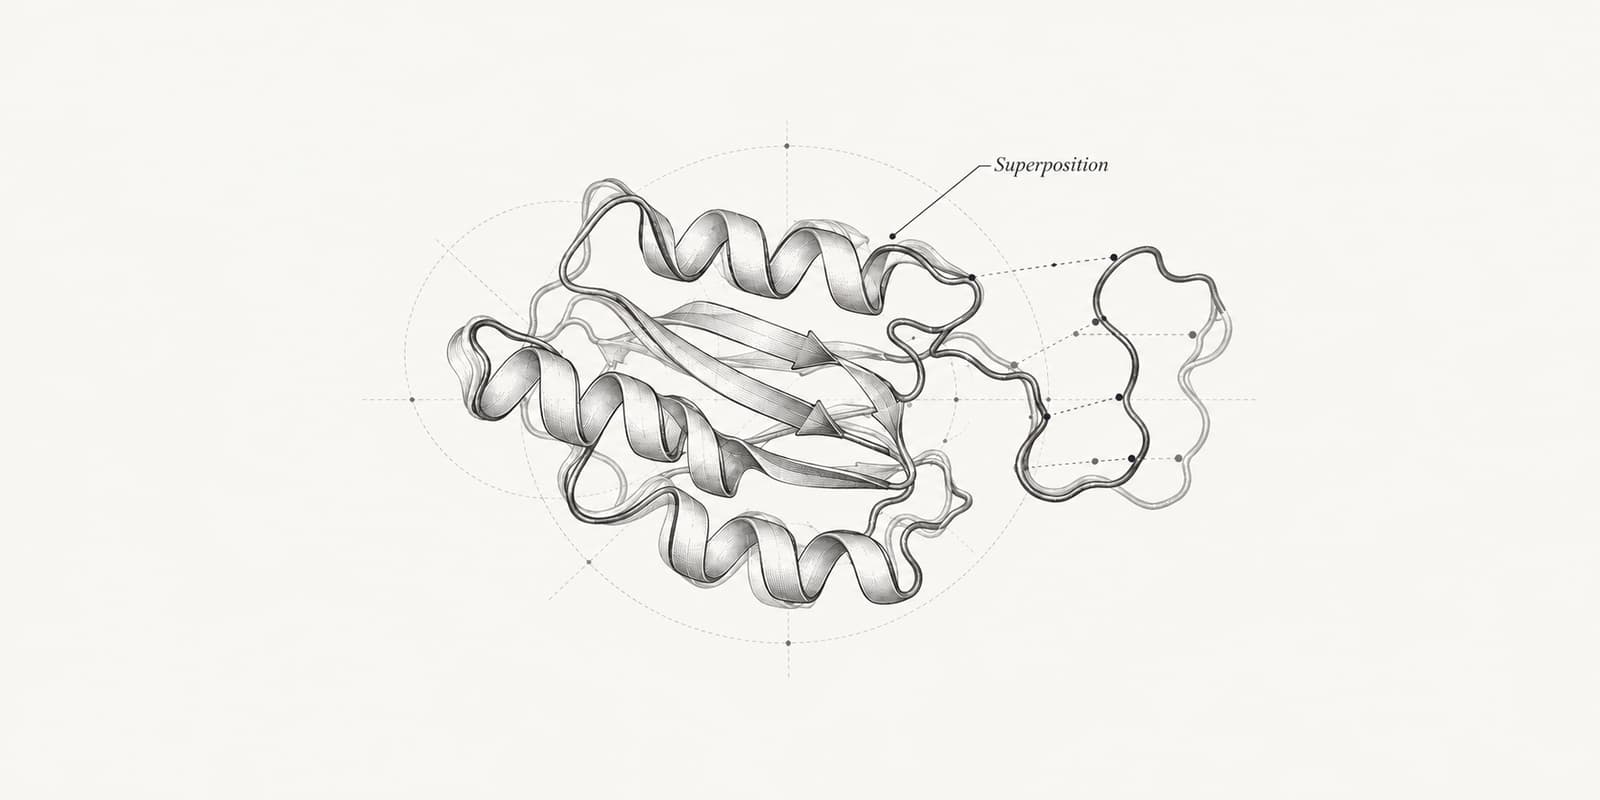
What is RMSD, and what counts as a good value
RMSD is the average distance between matched atoms of two structures, in ångströms. Learn the formula, when to superimpose, and what values count as good for proteins, docked poses and molecular dynamics.
Structures ·
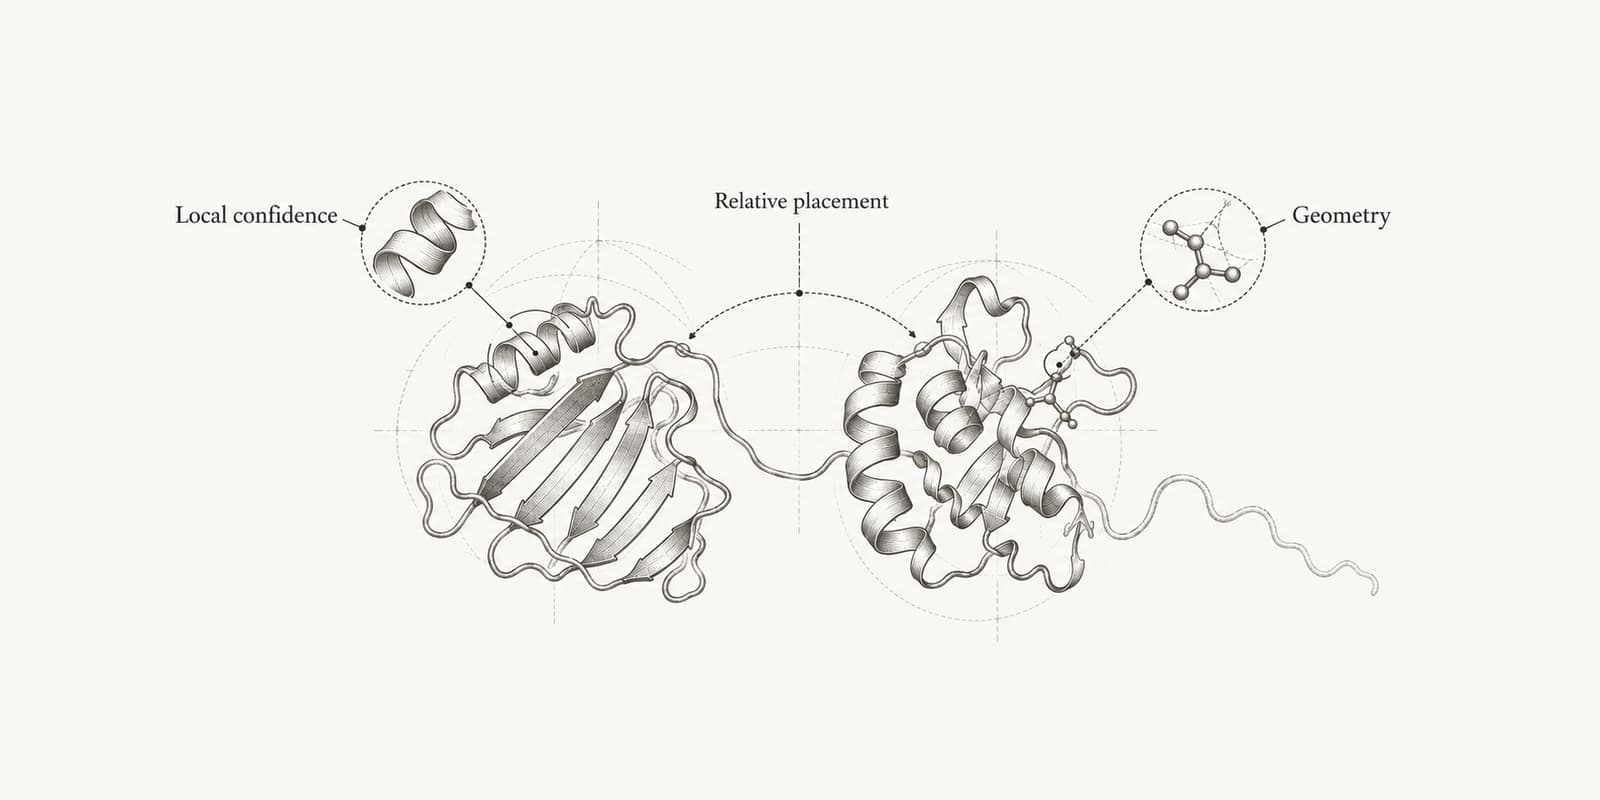
How to tell if a predicted protein structure is reliable
A predicted structure is reliable for a question when the scores that answer that question agree. Read pLDDT, PAE, pTM and ipTM in order, rescore interfaces with ipSAE, then check accuracy and geometry with DockQ and MolProbity.
Structures ·
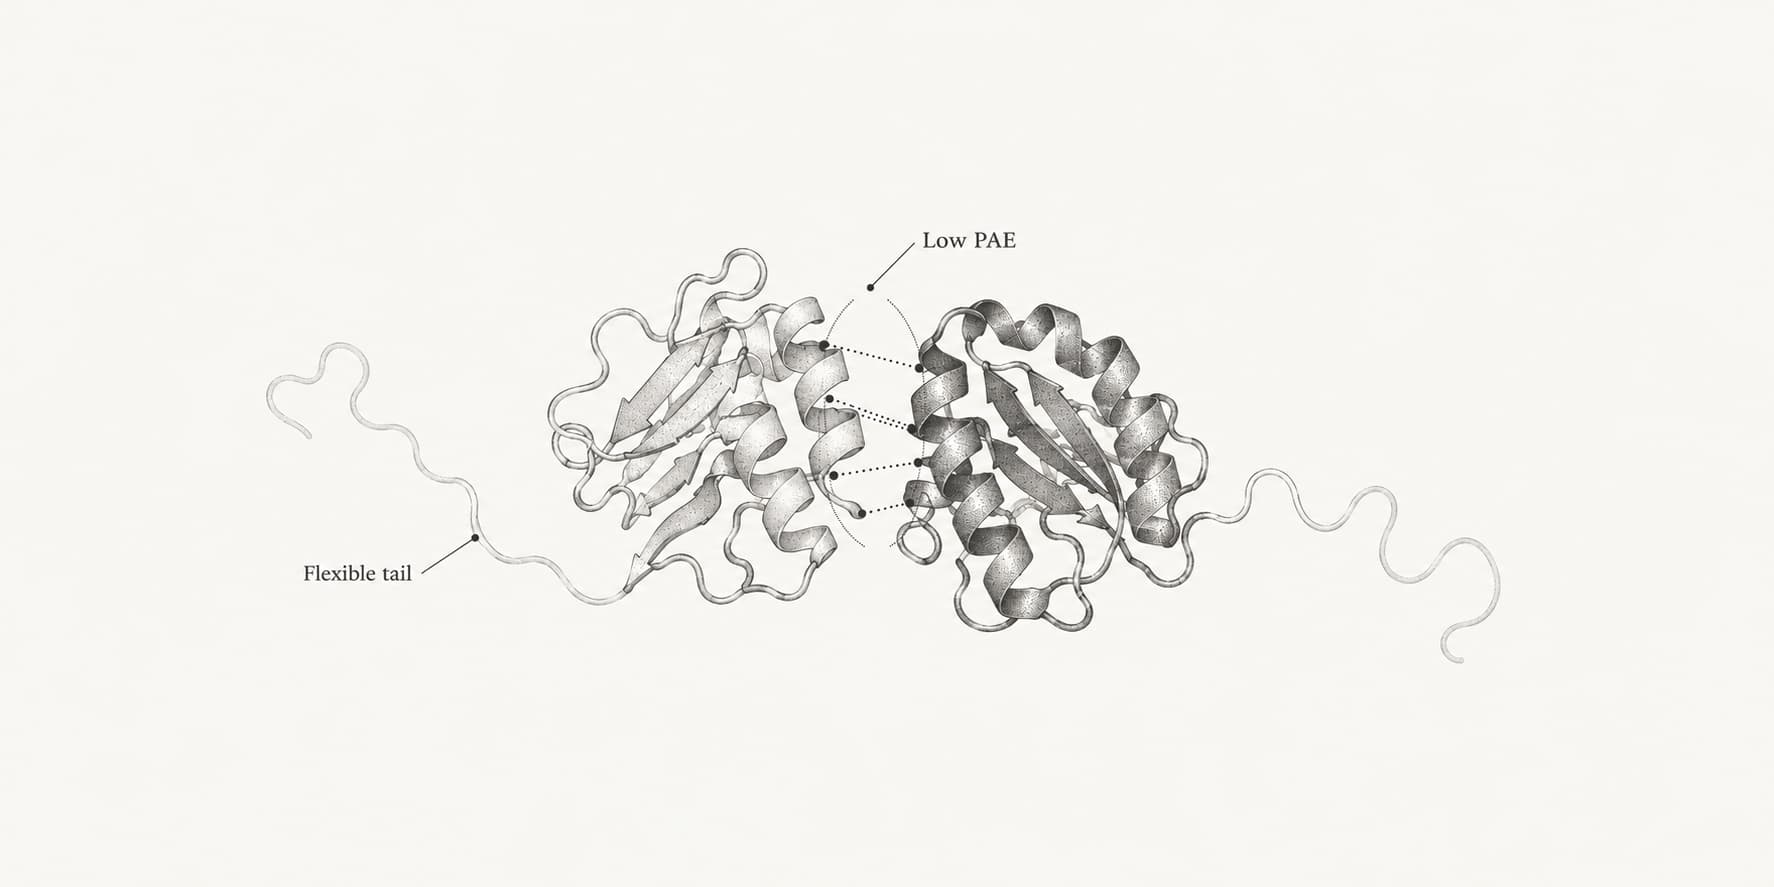
ipSAE explained
ipSAE is an interface confidence score for AlphaFold2, AlphaFold3 and Boltz that ignores disordered tails. Learn how it is calculated, why it beats ipTM and what 0.6 to 0.8 mean.
Structures ·
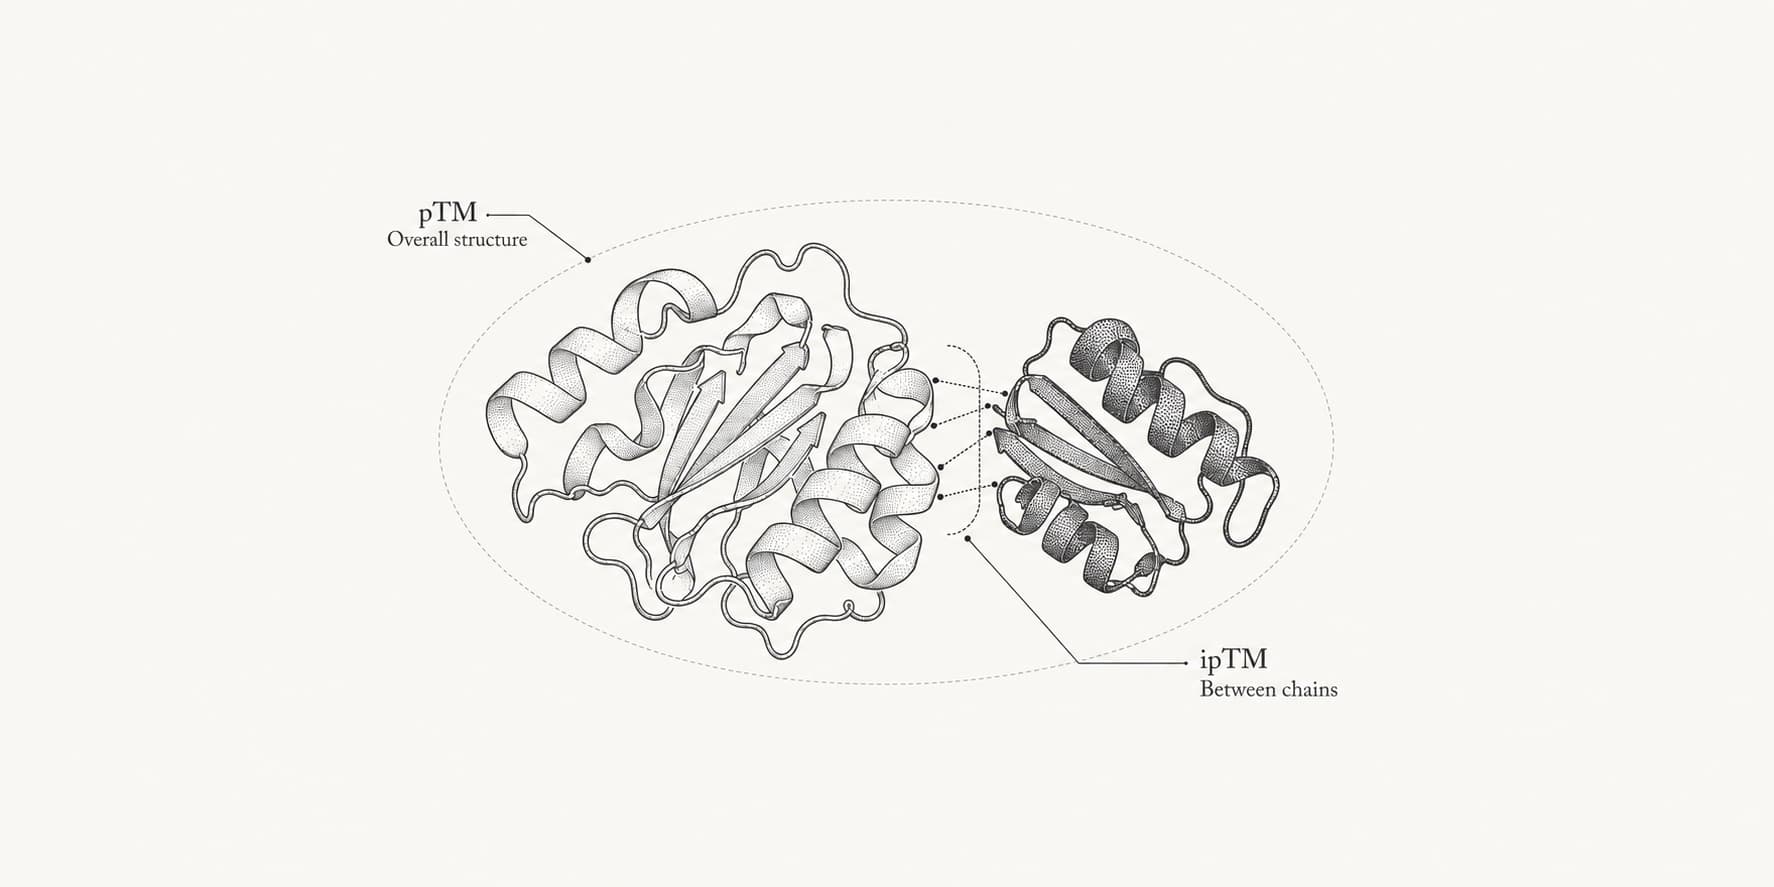
ipTM vs pTM: judging predicted complexes
pTM scores the whole predicted structure, while ipTM scores only how chains sit relative to each other. Learn what the 0.5, 0.6 and 0.8 cutoffs mean and why disordered tails lower ipTM.
Structures ·
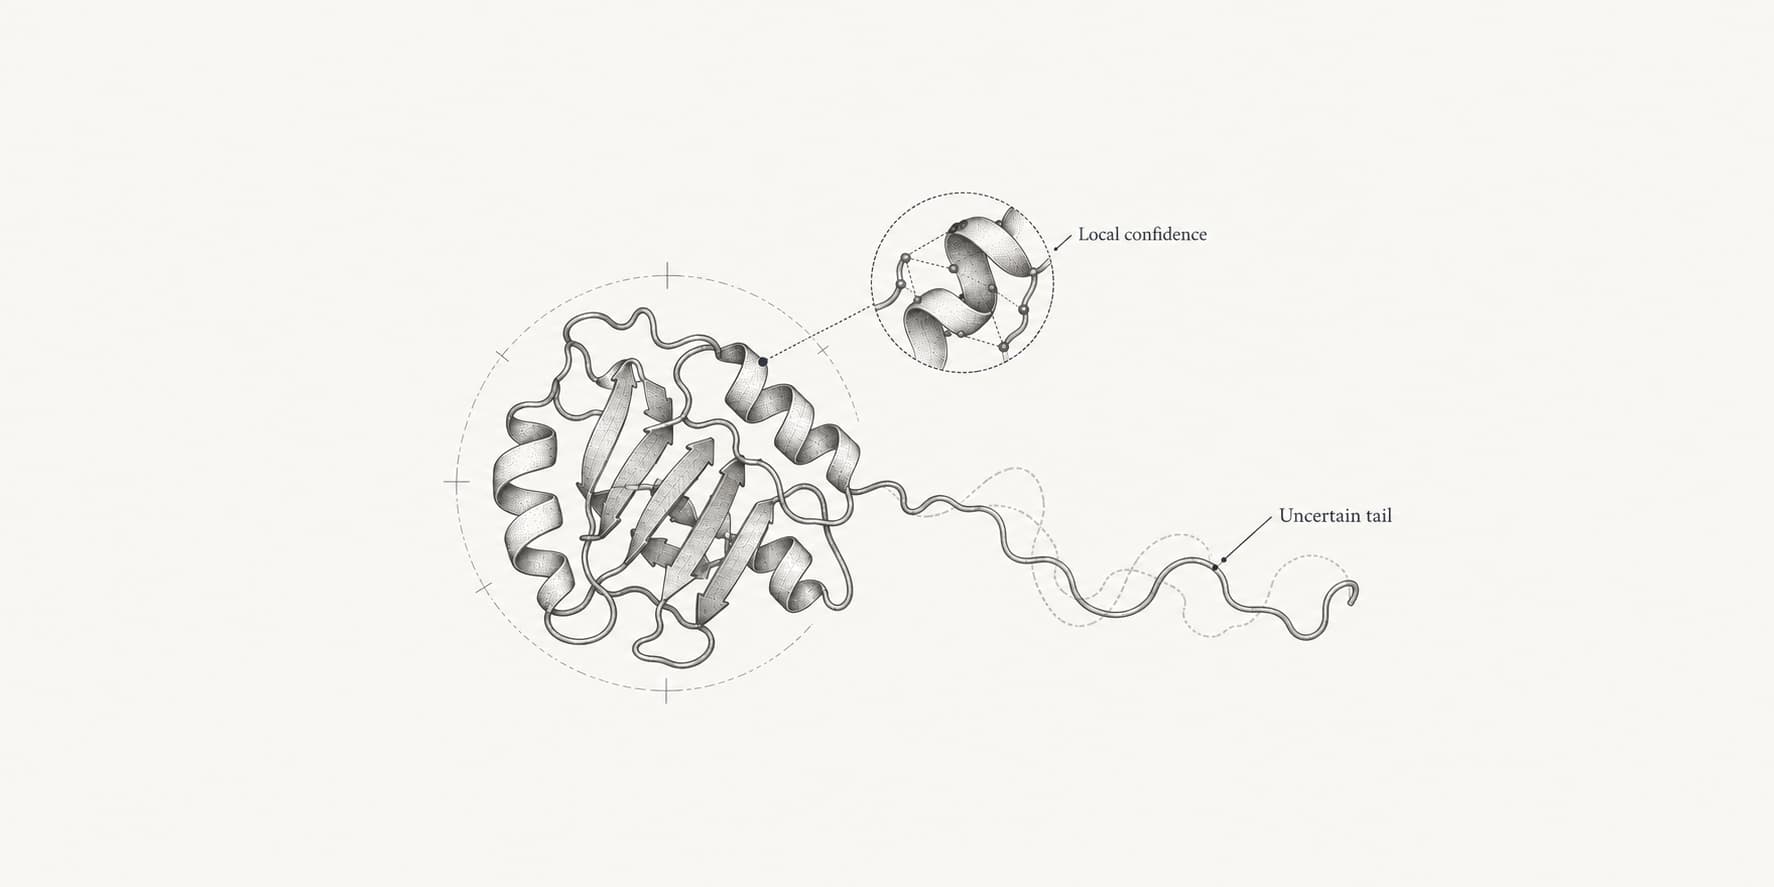
What is pLDDT, and what counts as a good score
pLDDT is the per-residue confidence score that AlphaFold, ESMFold and Boltz attach to predicted structures. Learn what the 90, 70 and 50 cutoffs mean and why a low score is not always a failure.
Structures ·
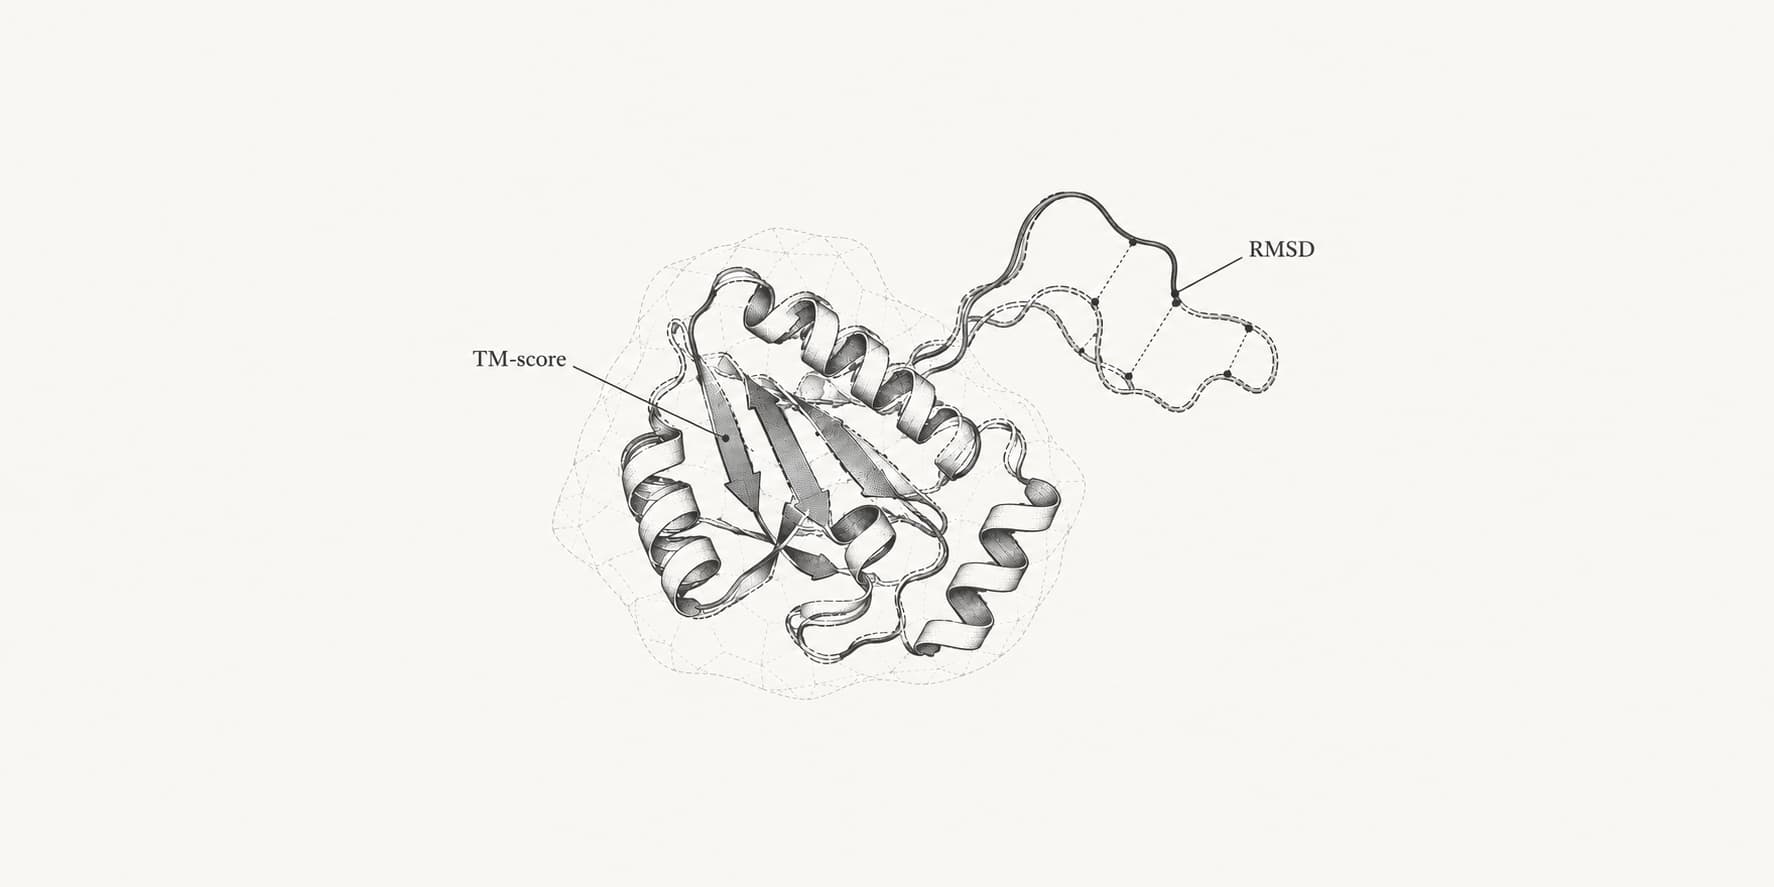
TM-score vs RMSD
RMSD and TM-score both compare two protein structures, but they answer different questions. Learn how each is calculated, what values count as good, and which one to use for prediction, fold search, docking or design.
Structures ·
AlphaFold database statistics [2026]
AlphaFold DB lists 261,552,403 predicted models as of September 24, 2026. See the collection breakdown, human proteome coverage, and how the database compares with the PDB.
Drugs ·
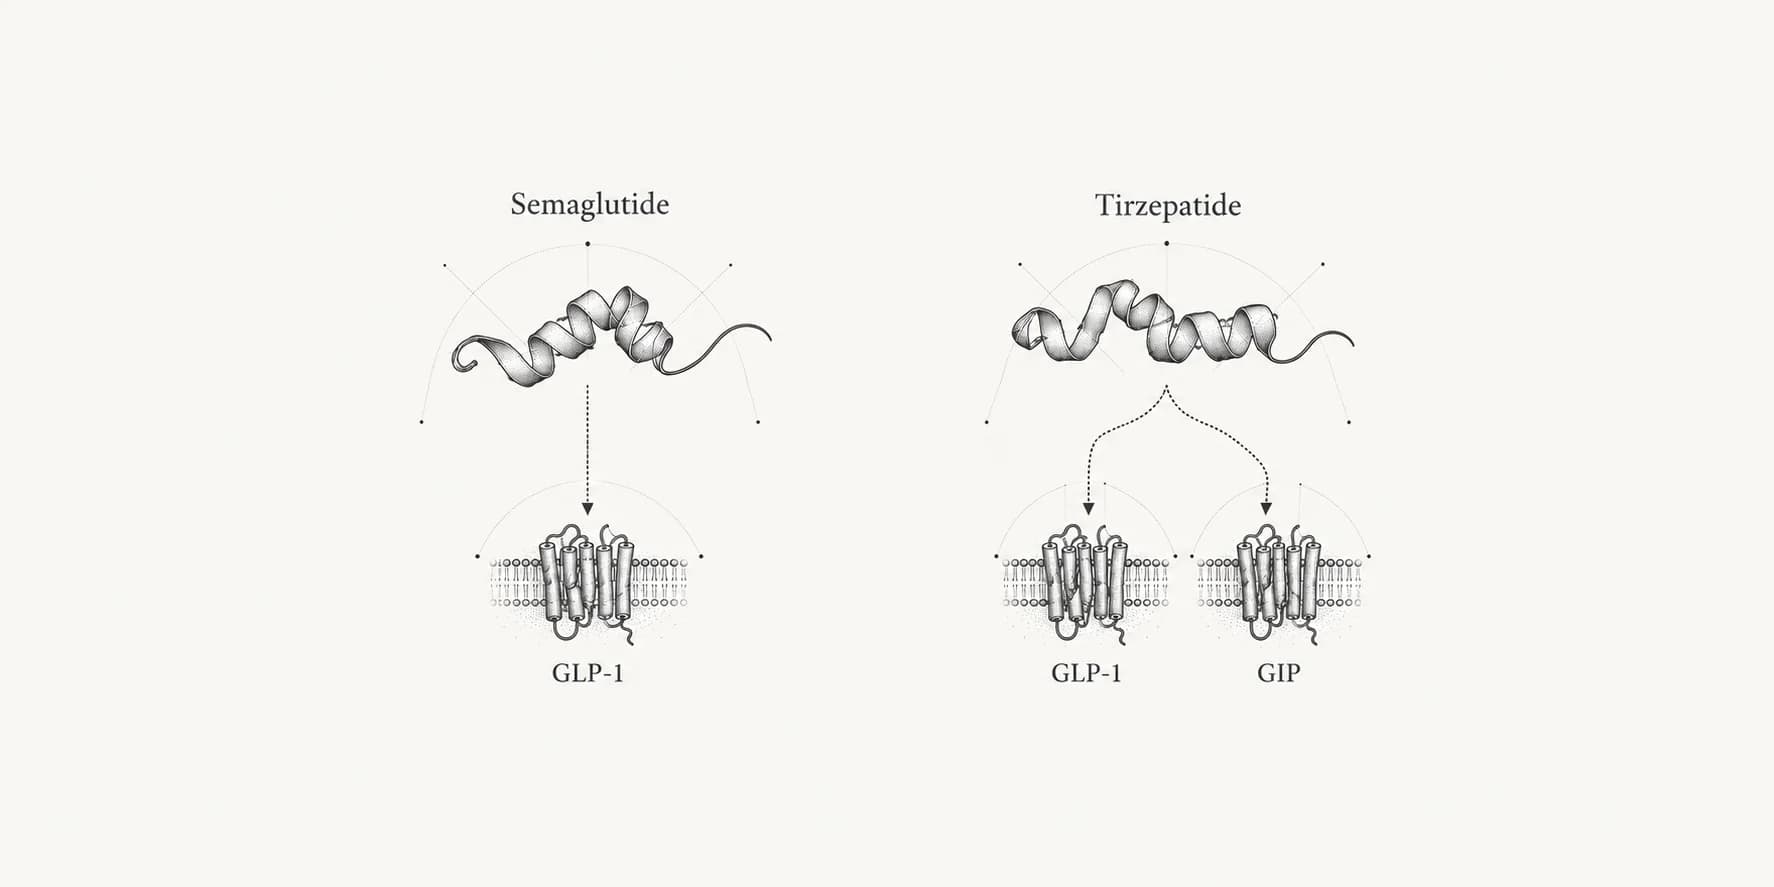
Semaglutide vs tirzepatide
Semaglutide (Ozempic, Wegovy) vs tirzepatide (Mounjaro, Zepbound): head-to-head weight loss and diabetes results, side effects and U.S. prices, with sources.
Drugs ·
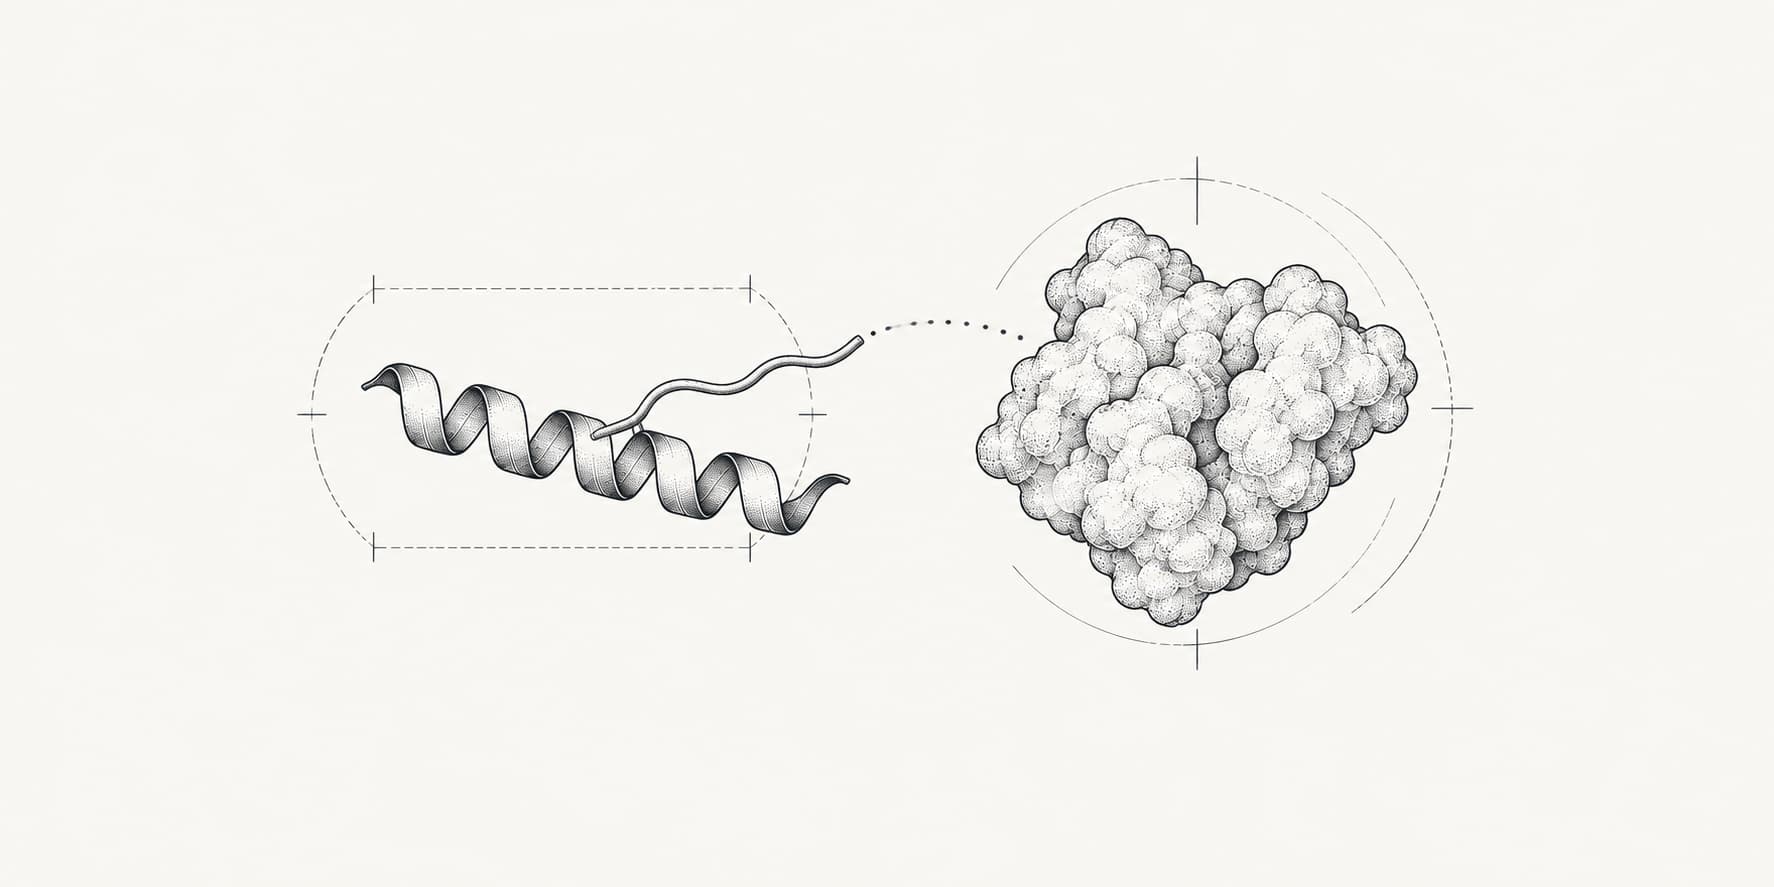
What is semaglutide?
Semaglutide’s amino-acid sequence, molecular weight, GLP-1 mechanism and oral delivery, with our molecular calculations and audit of two PDB structures.

Structures ·
Protein Data Bank statistics 2026: size and coverage
Current Protein Data Bank statistics for archive size, protein sequence coverage, experimental methods, growth, usage, computed models, and structure data formats.