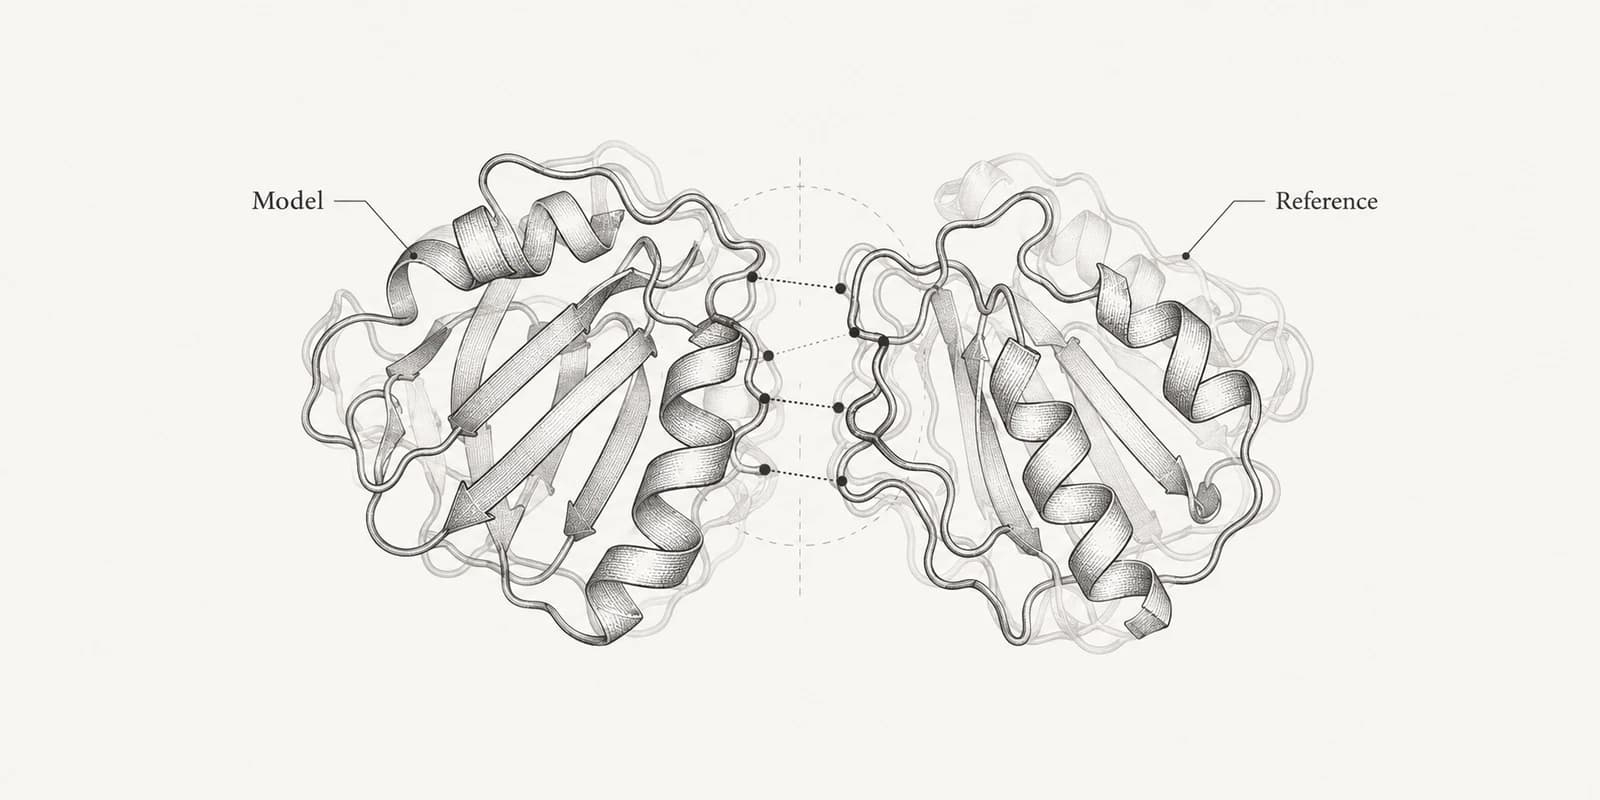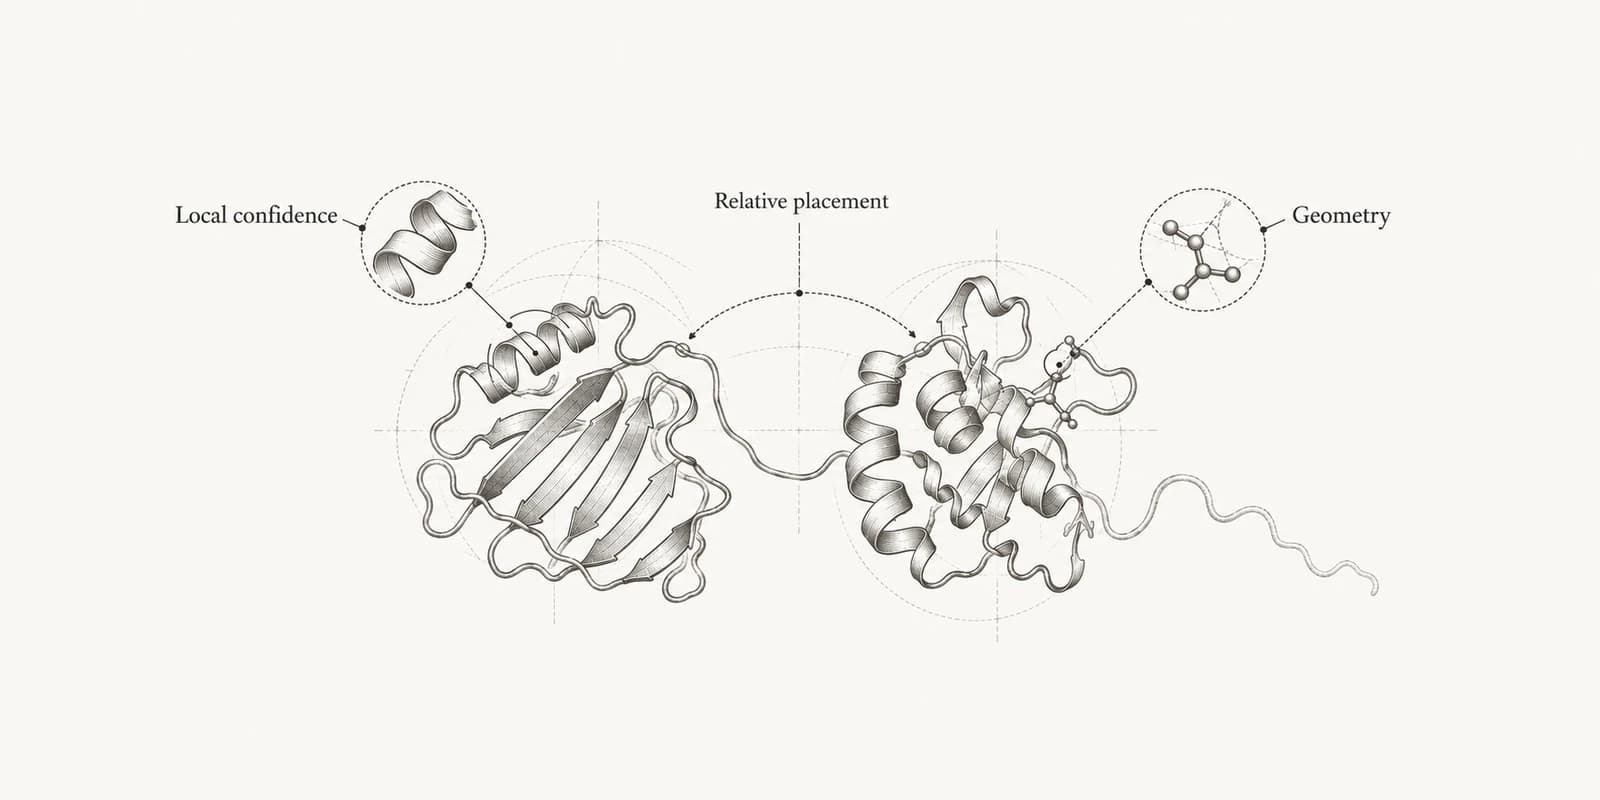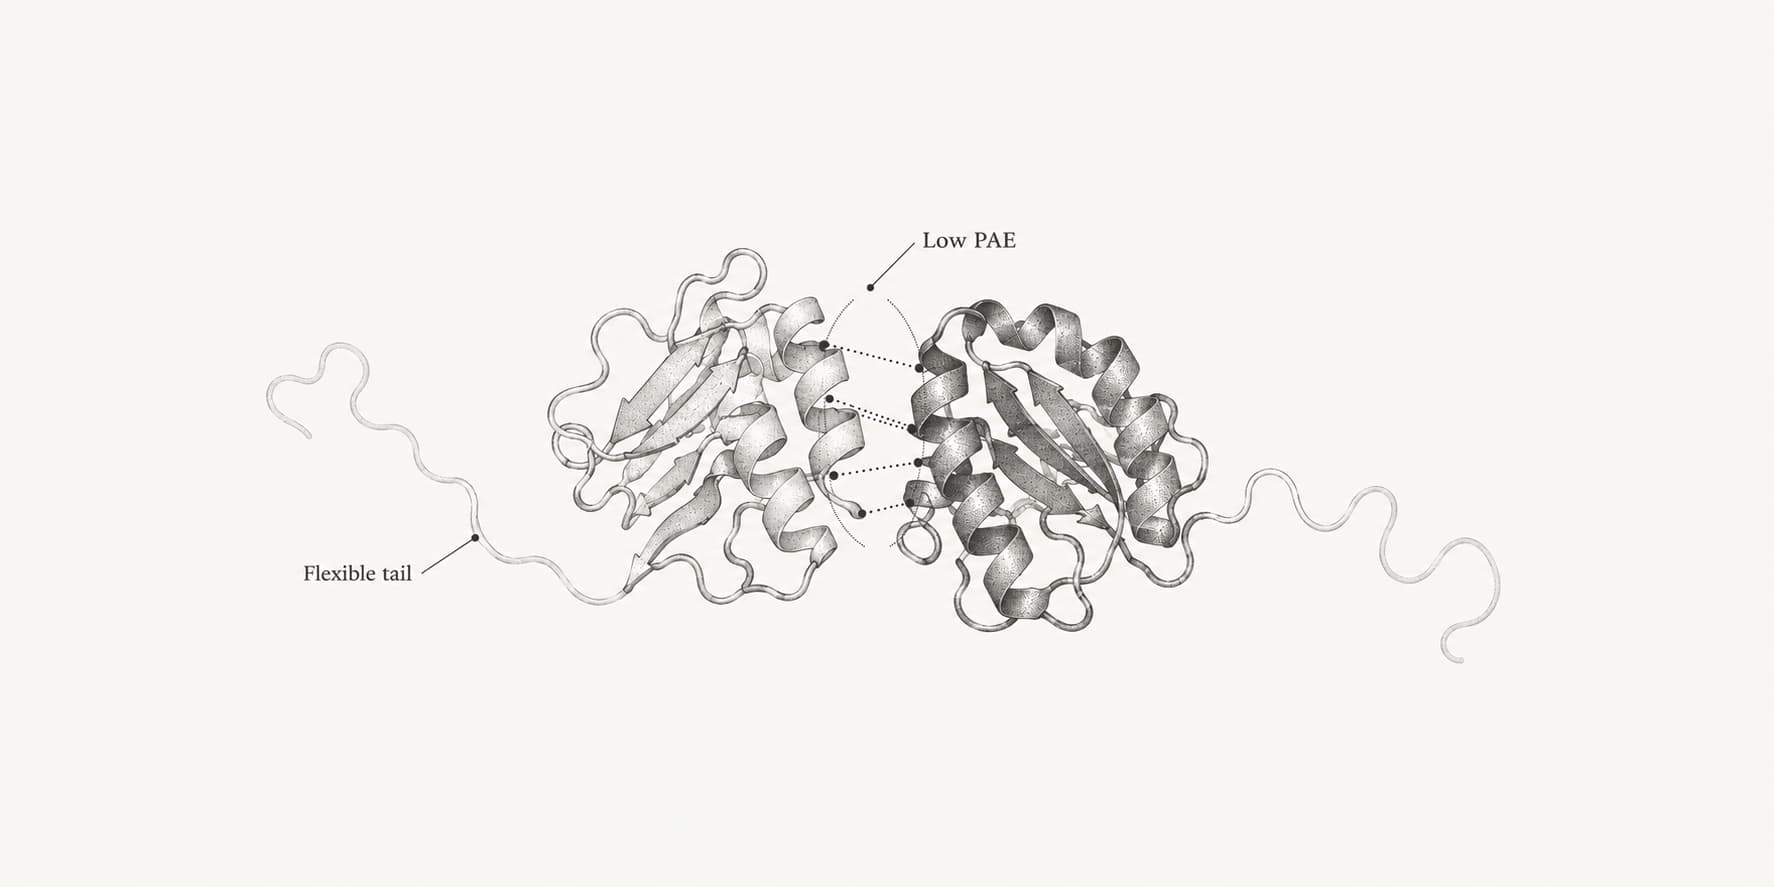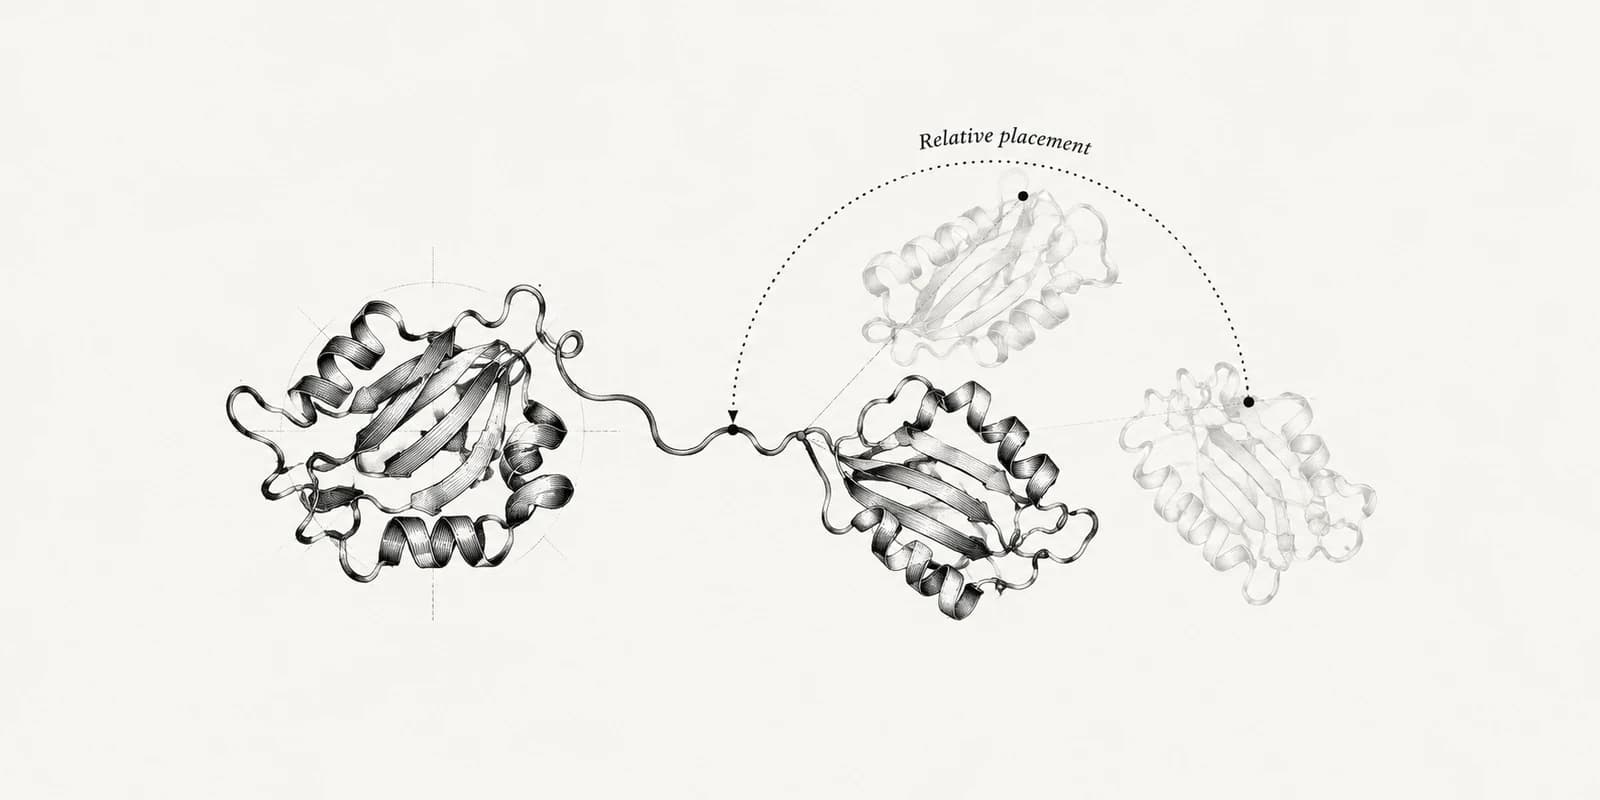
PAE (predicted aligned error) is a structure predictor's estimate, in ångströms, of how far one residue would be from its true position if the predicted and true structures were superimposed on another residue. Every predicted structure from AlphaFold2, Boltz-2, Chai-1, ESMFold and similar models can come with a PAE matrix holding one such value for every pair of residues, usually drawn as a green square plot.[1][2]
Low PAE between two residues means the model is confident about where they sit relative to each other. High PAE means it is not, even if both residues are well folded locally. That makes PAE the score to read for questions pLDDT cannot answer: whether two domains are oriented correctly, whether a linker is flexible, and whether two chains in a complex are docked in the right place. It is also the raw material for pTM, ipTM and ipSAE.
What one PAE value means
Take two residues, i and j. To compute the aligned error during training, AlphaFold2 superimposes the predicted structure on the experimental one using only residue i's backbone (its N, Cα and C atoms), then measures how far the predicted Cα of residue j lands from its true position. PAE is the model's prediction of that distance before any true structure exists.[1] AlphaFold3 uses the same definition for proteins and nucleic acids, and builds a frame for each ligand atom from its nearest neighbors.[3]
The network does not output a single number directly. It predicts a probability for each of 64 error bins, 63 of them 0.5 Å wide covering 0 to 31 Å and a final bin for anything larger, and the reported PAE is the expected value of that distribution.[4] The ceiling of an AlphaFold2 PAE is therefore 31.75 Å, which is the max_predicted_aligned_error written in AlphaFold Database files.[5] A value near that ceiling does not mean the residues are 31 Å apart. It means the model has essentially no idea where one is relative to the other.
Three properties follow from the definition.
- PAE is about relative position, not distance. A PAE of 3 Å between two residues 40 Å apart says the model is confident about that 40 Å placement. The PAE plot is not a contact map or a distance map.[2]
- PAE is directional. The error in j after aligning on i is not the same quantity as the error in i after aligning on j, so the matrix is not symmetric.[3]
- PAE between a residue and itself is near zero by construction, which is why every PAE plot has a dark diagonal that carries no information.[2]
How to read a PAE plot
A PAE plot puts the residues along both axes and colors each cell by expected error, with dark green for low error and white or pale green for high error in the AlphaFold Database convention.[2] In the matrix, the row is the residue used for alignment and the column is the residue being scored; AlphaFold3's documentation defines element (i, j) as the error in token j when the prediction is aligned on token i.[3] Most viewers keep that layout, with aligned residues down the side and scored residues along the top.
Read the plot by its shapes rather than by individual cells. The patterns below cover most of what you will see.
| Pattern on the plot | What it usually means |
|---|---|
| Dark square block on the diagonal | A rigid unit, such as a domain, whose internal arrangement the model is confident about |
| Pale off-diagonal block between two dark blocks | Two confident domains whose relative orientation is uncertain |
| Dark off-diagonal block | Two regions packed against each other in a confident arrangement |
| Pale stripes in both directions across the plot | A disordered tail or flexible loop, usually also low in pLDDT |
| Pale band only in rows, or only in columns | Asymmetry: the region is a poor alignment frame, or is poorly placed from other frames |
| In a complex, dark blocks off the chain boundaries | A confident interface between chains |
A useful check is to ask which question you want answered and look only at the block that answers it. If you care about a domain, read its diagonal block. If you care about how two domains or two chains sit together, read the off-diagonal block between them, in both directions.
Worked example: calmodulin
Calmodulin is a small calcium sensor made of two lobes, each holding two EF-hand calcium-binding motifs. UniProt places EF-hands 1 and 2 at residues 8 to 79 and EF-hands 3 and 4 at residues 81 to 149.[6] The AlphaFold Database model of human calmodulin-1 has a mean pLDDT of about 85, which on its own suggests a solid prediction.[5]
The PAE matrix tells a more specific story. Averaged over the block for each lobe, the expected error is 4.3 Å within the N-terminal lobe and 4.5 Å within the C-terminal lobe. Between the lobes it is 21.5 Å when aligning on the N-terminal lobe and 21.1 Å when aligning on the C-terminal lobe, and not a single cross-lobe pair falls below 5 Å.[5] The model is confident about each lobe and has no confident opinion about how they face each other. The analysis script and data reproduce these numbers from the downloaded files.
| Region pair (aligned → scored) | Mean PAE | Pairs below 5 Å | Mean pLDDT of scored lobe |
|---|---|---|---|
| N-lobe → N-lobe | 4.3 Å | 64.5% | 85.8 |
| C-lobe → C-lobe | 4.5 Å | 67.3% | 87.5 |
| N-lobe → C-lobe | 21.5 Å | 0% | 87.5 |
| C-lobe → N-lobe | 21.1 Å | 0% | 85.8 |
pLDDT alone would hide this. Both lobes score in the high 80s, and only the linker between them dips, reaching 50 at residue 80. A reader looking at the colored ribbon would see two well-folded lobes joined by a slightly less certain stretch and might measure the distance between the lobes or dock a peptide between them. The PAE says that the drawn orientation is one of many the model considers possible.
That uncertainty matches the biology. NMR relaxation experiments found that the middle of the "central helix" seen in crystal structures is highly mobile in solution, residues K77 to S81 in the numbering of the mature protein (78 to 82 in UniProt numbering), and that the two lobes tumble almost independently.[7] When calmodulin binds a target peptide, the central helix unwinds and both lobes wrap around the peptide in a compact arrangement unlike the extended one.[8] PAE cannot predict which arrangement you will find, but it correctly flags that the lobe orientation is not fixed.
What counts as a good PAE
There is no official PAE cutoff in the AlphaFold documentation. The EMBL-EBI guide describes dark green as a good prediction and light green as a poor one, and the AlphaFold3 documentation only says that higher values mean lower confidence.[2][3] In practice, values below about 5 Å between two regions are read as a confident relative placement, values above about 15 Å as little information, and the middle as worth checking against other evidence. These are rules of thumb, and they apply to blocks of residues rather than single cells.
Tools that turn PAE into a score do use fixed cutoffs, and they are a better guide than a single number:
| Score or filter | How it uses PAE |
|---|---|
| pTM and ipTM | Converts every PAE into a TM-score term scaled by structure size, then averages |
| ipSAE | Counts only interchain pairs below a cutoff, 10 Å by default |
| LIS | Averages (12 − PAE) / 12 over interchain pairs below 12 Å |
| pDockQ2 | Combines interface pLDDT with PAE-derived terms for contacting residues |
AlphaFold3 chain_pair_pae_min | Lowest PAE between two chains; correlates with whether they interact |
The length scaling in pTM explains why a single cutoff is crude. In a 300-residue protein, a pair with a PAE of 6.4 Å still contributes half its maximum to pTM, while in a 100-residue protein the halfway point is 3.7 Å. The ipTM vs pTM guide has the full table.
PAE compared with pLDDT
pLDDT and PAE are complementary. pLDDT asks whether the local geometry around one residue is right. PAE asks whether two residues, possibly far apart, are placed correctly relative to each other.[1][2]
The two usually agree on disorder. A tail with pLDDT below 50 has high PAE to everything, and shows up as pale stripes across the plot.[2] They disagree in the case calmodulin shows: well-folded domains with high pLDDT whose arrangement is uncertain. The reverse case, low pLDDT with low PAE, is rare, because a region whose local structure is unknown is also hard to place.
| Question | Score to read |
|---|---|
| Is this loop or side chain modeled correctly? | pLDDT |
| Is the fold of this domain right? | pLDDT, plus the domain's diagonal PAE block |
| Are these two domains oriented correctly? | Off-diagonal PAE between the domains |
| Are these two chains docked correctly? | Interchain PAE, ipTM and ipSAE |
| Is this the region a ligand or partner contacts? | pLDDT at the site and PAE to the partner |
PAE in complexes
For a complex, the PAE matrix is laid out chain by chain, and the off-diagonal blocks between chains describe the interface. A complex with a confident interface shows dark patches in those blocks where the contacting residues meet. A complex where the model has folded each chain but not docked them shows dark diagonal blocks and pale interchain blocks, much like the two calmodulin lobes.
AlphaFold-Multimer's ipTM is calculated from these interchain pairs.[9] Because ipTM averages over every residue of the partner chain, disordered tails and domains outside the interface lower it even when the interface block itself is dark. Reading the interchain block directly, or scoring it with ipSAE, avoids that problem.[10] The ipSAE guide shows the calculation with real examples.
Read both interchain blocks, chain A aligned with chain B scored and the reverse. A small peptide can be well placed when the model aligns on the receptor while still being a poor frame for placing the receptor, and the difference shows up as one block darker than the other. Interface scores like ipSAE handle this by calculating both directions; the lower of the two, ipSAE_min, is the stricter value.[10]
AlphaFold3, Boltz-2 and other models that handle ligands and nucleic acids compute PAE over tokens rather than residues. A token is one residue for proteins and one nucleotide for DNA or RNA, while ligands are split into one token per heavy atom, so a 30-atom ligand adds 30 rows and columns to the matrix.[13] Boltz also writes PDE (predicted distance error), a related matrix that estimates errors in pairwise distances rather than aligned positions.[14]
Using PAE to find domains
Because rigid units appear as dark diagonal blocks, PAE can split a model into pieces that move together. phenix.process_predicted_model uses the PAE matrix this way to break AlphaFold models into confidently predicted domains before molecular replacement or cryo-EM docking, and ISOLDE uses the same confidence values to weight restraints when fitting the whole model.[15] Experimentalists use the domains individually because the arrangement between them is the part most likely to be wrong.
The same idea helps outside crystallography. Before using a multidomain model for protein-ligand docking, a pocket that spans two domains needs low PAE between them. Before trimming a sequence for a complex prediction, the PAE plot shows where one domain ends and a flexible linker starts more clearly than the pLDDT trace does.
Where PAE falls short
PAE is the model's confidence, not a measurement of flexibility. A high value between two domains is consistent with a flexible hinge, as in calmodulin, but also with a rigid arrangement the model lacks the information to predict, for example because the multiple sequence alignment is shallow. The plot cannot tell those apart.
Low PAE does not prove the arrangement is the one you need. A protein with two well-defined states, open and closed, or free and bound, can be predicted confidently in one of them. Treat a confident domain arrangement as a strong hypothesis, the same way you would treat high pLDDT.
Averaging the whole matrix loses most of the information. A mean PAE for a multidomain protein mixes confident domains with uncertain linkers and tails. Summaries such as pTM or a region mean are only useful when you know which block they come from.
Finally, each model calibrates its PAE separately. A 5 Å PAE from AlphaFold2 and one from Boltz-2 are not guaranteed to mean the same thing, so compare values within one model.
Where PAE appears on ProteinIQ
| Tool | PAE output |
|---|---|
| AlphaFold2 | PAE JSON for each ranked model, alongside pLDDT, pTM and, for multimers, ipTM |
| AlphaFold DB Download | The precomputed PAE JSON for any AlphaFold Database entry |
| ESMFold | Maximum PAE in the summary; the full matrix as JSON when Save PAE matrix is enabled |
| ESMFold2 | A PAE JSON file when Include PAE matrix is enabled, with pTM, iPTM and pair-chain iPTM |
| Boltz-2 | PAE and PDE matrices as NPZ files when their full-matrix settings are enabled |
| Chai-1, RoseTTAFold3 | PAE with each sample, together with pLDDT, pTM and ipTM; RoseTTAFold3 also reports interface PAE |
| ipSAE | Turns AlphaFold2, AlphaFold3 or Boltz PAE files into ipSAE, ipTM, pDockQ, pDockQ2 and LIS |
| BindCraft, FreeBindCraft | Average and interface PAE as design filters, on a normalized 0 to 1 scale rather than in ångströms |
When a job returns a PAE file, the structure viewer adds a PAE tab next to the 3D model. Drag over a block of the heatmap to read the mean PAE for that range of aligned and scored residues and to highlight those residues on the structure.
A quick check of a predicted structure on ProteinIQ looks like this:
- Predict the structure with AlphaFold2, or with ESMFold or Boltz-2 with the PAE matrix setting turned on.
- Color the model by pLDDT to find well-folded regions and disordered tails.
- Open the PAE tab and find the dark diagonal blocks, which are the units you can trust internally.
- Select the off-diagonal block between any two regions you care about and read its mean PAE in both directions.
- For complexes, read ipTM, then score the interface with ipSAE if either chain has long disordered regions.
The protein structure prediction and protein complex structure prediction use cases cover choosing a predictor, and the AlphaFold2 and Boltz-2 guides show where the PAE files appear in the results.
Frequently asked questions
What does PAE stand for?
Predicted aligned error. "Aligned" refers to superimposing the predicted and true structures on one residue before measuring the error in another.[1]
Is a low or high PAE good?
Low. PAE is an expected error in ångströms, so lower values mean the model is more confident about the relative position of the two residues.[2][3]
Why is the PAE plot not symmetric?
Each value depends on which residue is used for alignment. Aligning on a residue in a rigid domain and scoring a residue in a floppy loop gives a different error from the reverse, so the (i, j) and (j, i) values can differ.[3] In the calmodulin model the two directions differ by 3.1 Å on average.[5]
What is the maximum PAE value?
For AlphaFold2 it is 31.75 Å, the center of the last error bin, which collects all errors above 31 Å. Values near the maximum mean the model has no information about the relative placement.[4][5]
Can PAE tell me whether two proteins interact?
It helps, but it is not proof. Low interchain PAE means the model is confident about one docked arrangement, and AlphaFold3 notes that the minimum interchain PAE correlates with whether two chains interact.[3] Scores built on interchain PAE, such as ipSAE and LIS, separate true from false pairs better than ipTM, but an interaction still needs experimental support.[10][11]
How do I open a PAE file?
AlphaFold2 and AlphaFold Database PAE files are JSON with a predicted_aligned_error matrix. Boltz writes NumPy NPZ files, and AlphaFold3 stores the pae array in its full confidence JSON.[3][14] The ProteinIQ structure viewer reads both JSON and NPZ PAE files from a job, and the ipSAE tool accepts them as inputs.