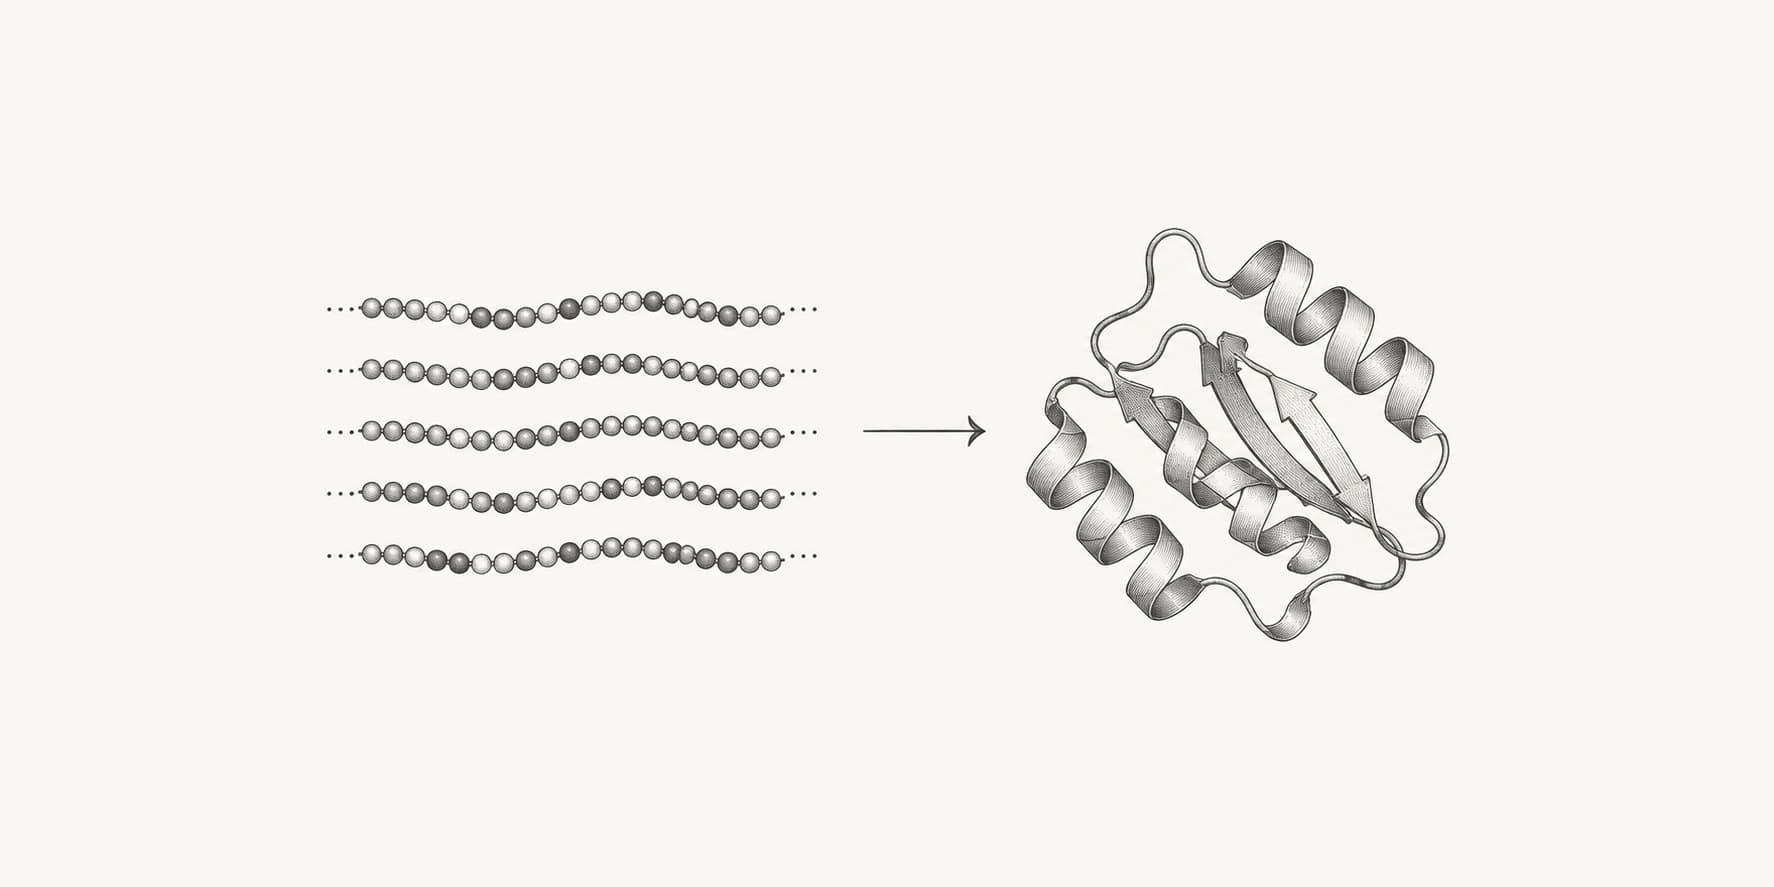
pLDDT (predicted local distance difference test) is a per-residue confidence score from 0 to 100 that structure prediction models attach to every residue they place. It is the model's own estimate of how closely the local neighborhood of that residue would match an experimental structure. AlphaFold2 introduced it, and ESMFold, Boltz-2, Chai-1, OpenFold3 and most newer predictors report the same score.[1][4][5]
The standard reading is: above 90 is very high confidence, where the backbone and most side chains are usually right; 70 to 90 means the backbone is generally correct; 50 to 70 is low confidence; and below 50 is very low, which often marks a region that is disordered on its own.[3] What counts as a good score depends on the question you are asking of the model. A fold-level question can tolerate scores in the 70s. Placing a ligand among side chains needs the pocket residues above 90.
What pLDDT measures
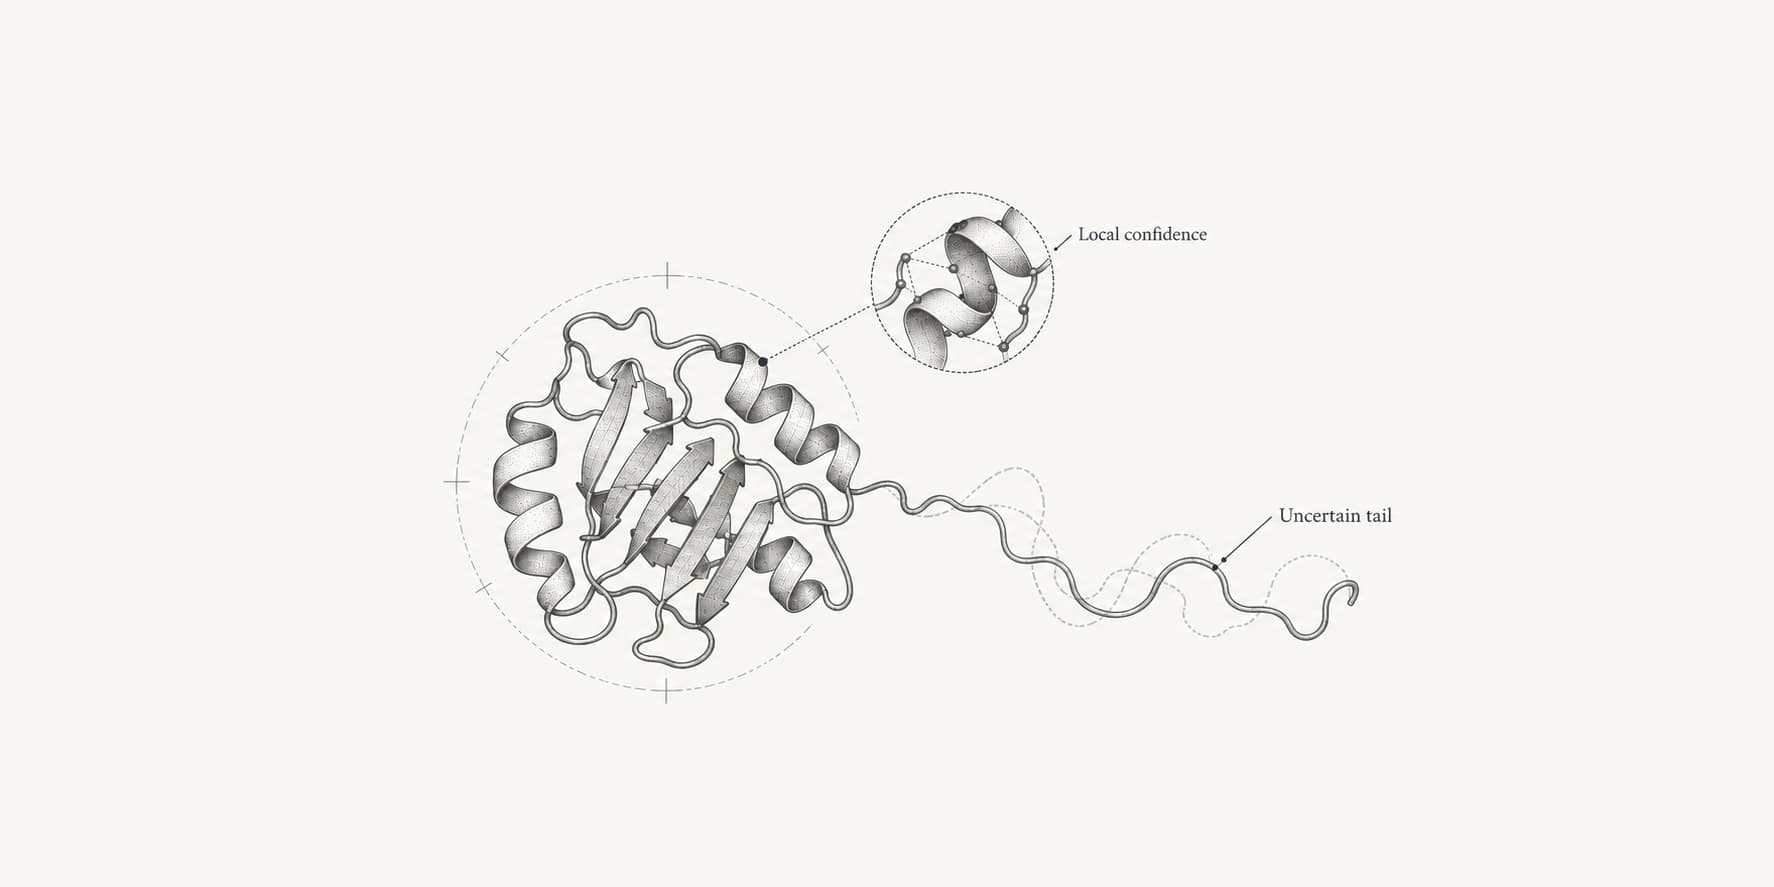
pLDDT is a prediction of lDDT, a score for comparing a model with a reference structure. lDDT looks at every pair of atoms that sit within 15 Å of each other in the reference and checks whether the same distance is preserved in the model. It counts a distance as preserved at four tolerances (0.5, 1, 2 and 4 Å) and averages the four fractions.[2] Because it compares internal distances instead of superimposing two whole structures, lDDT is not thrown off when a hinge or a domain moves. It scores each residue's local geometry.
During training, AlphaFold2 learned to predict the lDDT of each residue's Cα atom against the true structure. At prediction time no true structure exists, so the model outputs its estimate, the pLDDT. On 10,795 test chains, chain-level pLDDT tracked the measured lDDT-Cα closely (Pearson's r = 0.76, with a fitted slope of 0.997), so a value of 85 means the model expects about 85% of local distances to be preserved.[1]
Two practical consequences follow from the definition. pLDDT is local, so it does not tell you whether two domains or two chains are placed correctly relative to each other. And it is the model's opinion about its own output. It is well calibrated on average, but it is not a measurement.
What counts as a good pLDDT score
The DeepMind team set the cutoffs below when they released the human proteome predictions. Above 90, AlphaFold2's χ1 side-chain rotamers were correct about 80% of the time on recent PDB structures, and above 70 the backbone was generally correct.[3] Structure viewers usually color models by the same bands, a convention the AlphaFold papers also use.[4]
| pLDDT | Label | Color in most viewers | What you can usually trust |
|---|---|---|---|
| Above 90 | Very high | Dark blue | Backbone and most side-chain orientations |
| 70 to 90 | Confident | Light blue | Backbone trace and secondary structure; individual side chains less so |
| 50 to 70 | Low | Yellow | Rough location at best; treat coordinates as a sketch |
| Below 50 | Very low | Orange | Not a structure; often a disordered region or one the model cannot resolve |
These bands are guidance rather than sharp boundaries. A residue at 69 is not meaningfully worse than one at 71, and the right threshold depends on the task. The table below pairs common uses with the scores they need.
| What you want to do | Check |
|---|---|
| Identify the fold, domain boundaries or secondary structure | Most residues in the region above 70 |
| Interpret a point mutation or a catalytic site | The residue and its neighbors above 90 |
| Dock a small molecule into a pocket | Pocket-lining residues above 90, then confirm the pocket conformation separately |
| Model a protein complex or interface | pLDDT on both sides of the interface, plus ipTM and inter-chain PAE |
| Filter designed binders or sequences | A mean cutoff, often around 80, together with pTM, ipTM and interface PAE filters |
| Find disordered regions | Stretches below 50, cross-checked with a dedicated disorder predictor |
BindCraft, for example, rejects binder designs whose average pLDDT falls below 80 by default, and it applies separate pTM, ipTM and interface PAE filters at the same time. pLDDT alone would let through binders that fold well but do not touch the target.
Why a protein's mean pLDDT can mislead
Many tools summarize a prediction with its mean pLDDT. That number is useful for ranking several models of the same sequence, but it blends very different regions. The AlphaFold Database model of human p53 has a mean pLDDT of 75.1, which sounds merely "confident". Underneath, 52.7% of its residues score above 90 and 29.8% score below 50.[9] The protein contains a near-perfect DNA-binding domain and long disordered segments, and the average describes neither.
Always look at the per-residue profile, or color the structure by pLDDT, before deciding what part of a model to use.
Worked example: reading a p53 prediction
Human p53 (UniProt P04637, 393 residues) is a good teaching case because one chain contains every pLDDT band. UniProt annotates a DNA-binding region at residues 102 to 292, an oligomerization (tetramerization) region at 325 to 356, and disordered stretches at the N- and C-termini.[13] If you predict p53 with AlphaFold2 or ESMFold, or download the database model with AlphaFold DB Download, the confidence values sit in the B-factor column of the structure file:
ATOM   1328  CA  ARG A 175       4.335  -7.532  -4.313  1.00 96.62           C
ATOM   2948  CA  HIS A 380      55.269  19.277  -9.517  1.00 44.91           C
The second-to-last number on each line is pLDDT. Arg175, a residue frequently mutated in tumors, scores 96.6. His380, in the C-terminal tail, scores 44.9.[9]
Averaged over the regions, the DNA-binding domain scores 95.5, with 179 of its 191 residues above 90. The tetramerization domain scores 90.9. The N-terminal transactivation domain (1 to 44) averages 49.4, and the C-terminal region (357 to 393) averages 43.4.[9] The well-studied hotspot residues R175, R248 and R273 all score between 96 and 99, so the model gives a sound basis for asking where a mutation sits and which contacts it might break. The C-terminal tail is drawn as a loose ribbon that should not be read as a shape.
The transactivation domain holds a subtler signal. Residues 20 to 25 rise into the low 70s while the surrounding sequence stays in the 40s and 50s.[9] That short stretch is the segment that folds into an amphipathic helix when p53 binds MDM2.[8] A brief rise in pLDDT inside a low-confidence region can point to a motif that becomes structured only in a complex.
Low pLDDT does not always mean the prediction failed
Low scores have two common causes, and the model cannot tell you which one applies.
The first is genuine disorder. Many proteins contain regions that have no fixed structure on their own. In the human proteome predictions, pLDDT worked as a disorder predictor about as well as dedicated tools, with an area under the curve of 0.897 on the CAID benchmark. Long stretches below 50 take on a recognizable ribbon-like appearance, which the AlphaFold authors described as a prediction of disorder, not a structure.[3] Cross-checking such regions with a disorder predictor such as DR-BERT is a quick way to confirm.
The second is missing information. AlphaFold2's accuracy drops substantially when the multiple sequence alignment has fewer than about 30 sequences.[1] Single-sequence models like ESMFold avoid the alignment step but can still struggle with sequences unlike anything they were trained on.[5] In these cases the region may well be folded in reality, and the model simply cannot say how.
Preproinsulin shows how a well-known folded protein can score low. Its AlphaFold Database model has a mean pLDDT of 52.9, and the B and A chains, which form the compact hormone after processing, average 48.3 and 51.2 inside the precursor.[11] The mature hormone is two chains held together by disulfide bonds after the C-peptide is cut out, as the insulin amino acid guide describes. Whatever the reason for the low scores, the right reading is that this model does not know the structure. It is not evidence that insulin is disordered.
There is also a practical difference between model families. Diffusion-based predictors such as AlphaFold3, Boltz-2 and Chai-1 generate coordinates for every atom, and the AlphaFold3 authors note that generative models can produce plausible-looking compact structure in unstructured regions.[4] With these tools, check the pLDDT of a region instead of trusting its shape.
High pLDDT does not always mean the structure is right
A high score means the model is confident about local geometry. It does not guarantee that the structure matches the protein in your experiment.
α-Synuclein is the classic example. It is an intrinsically disordered protein in solution, yet the AlphaFold Database model scores 89.2 on average across its N-terminal 60 residues, drawn as a long helix.[10] Alderson and colleagues showed that this helix matches the conformation α-synuclein adopts when it binds lipid membranes. More broadly, AlphaFold2 assigned confident structures to nearly 15% of human intrinsically disordered regions, many of which fold only under specific conditions such as binding or phosphorylation.[6] A high pLDDT can describe a state that exists only some of the time.
Confident predictions also differ from experiment in smaller ways. Terwilliger and colleagues compared AlphaFold predictions directly with experimental density maps. In regions above 70, distances between nearby atoms matched deposited models to about 0.1 Å, but the deviation grew to about 0.7 Å for atoms 50 Å apart, a typical distortion of 0.5 to 1 Å across the molecule.[7] The predictions also do not account for ligands, covalent modifications or other environmental factors.[7] Treat a very high confidence model as a strong hypothesis, not as an experimental structure.
pLDDT compared with pTM, ipTM and PAE
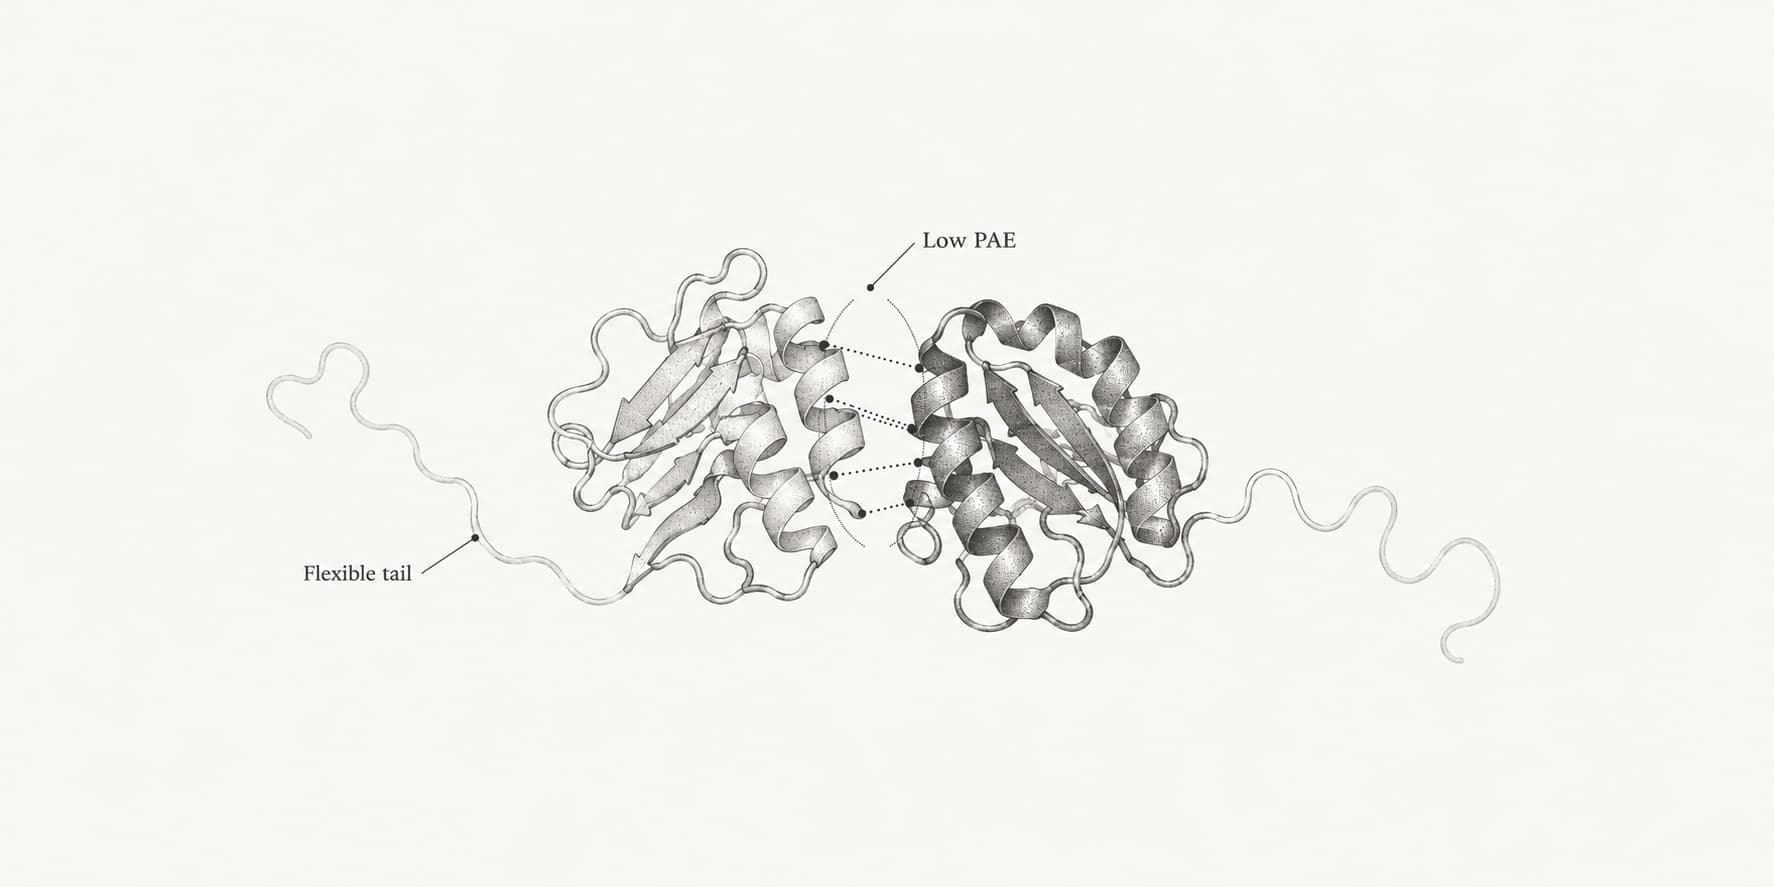
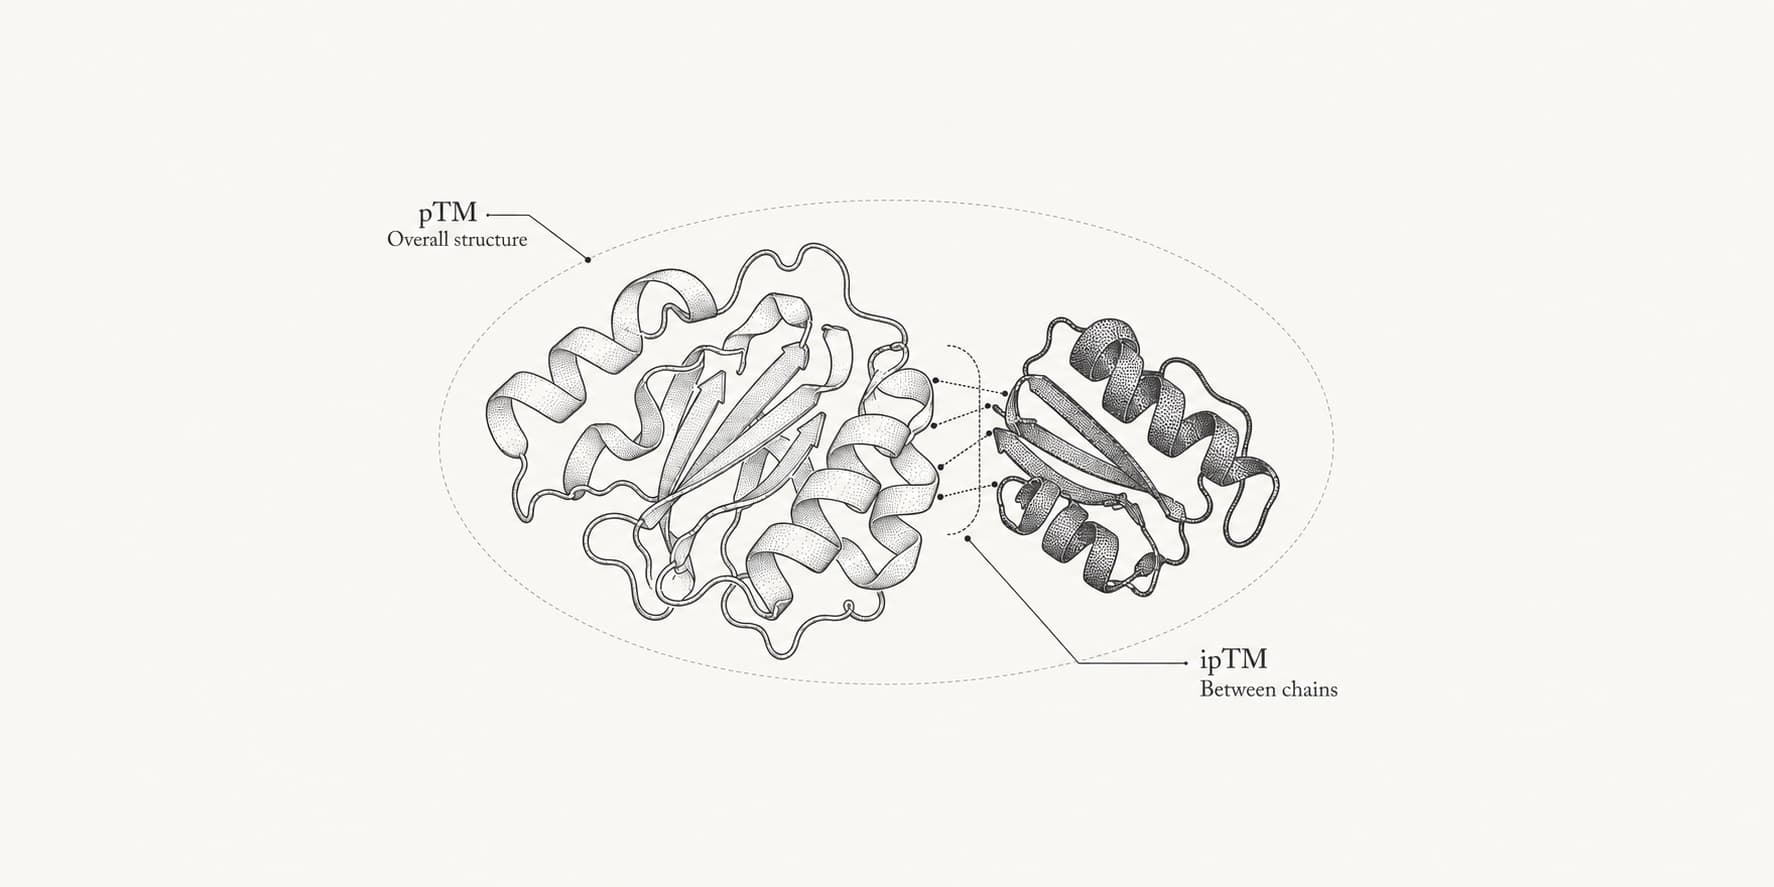
Structure predictors report several confidence scores because each answers a different question. pLDDT asks whether the local geometry around a residue is right. PAE (predicted aligned error) asks how confident the model is about the position of one residue relative to another, which is what you need for domain arrangement. pTM summarizes the global fold, and ipTM summarizes how chains are placed relative to each other in a complex.[1]
| Score | Scope | Scale | Answers |
|---|---|---|---|
| pLDDT | Per residue or atom | 0 to 100 (or 0 to 1) | Is the local structure around this residue right? |
| PAE | Per residue pair | Ångströms, lower is better | Are these two parts placed correctly relative to each other? |
| pTM | Whole structure | 0 to 1 | Is the overall fold right? |
| ipTM | Between chains | 0 to 1 | Is the arrangement of the chains right? |
The distinction matters most for complexes. Two chains can each score above 90 while the interface between them is a guess, because each chain's local structure can be right even when the docking is wrong. Interface scores built on PAE, such as those in ipSAE, are better suited to that question. Interface-weighted pLDDT does carry some information, though. The pDockQ score combines the average pLDDT of interface residues with the number of interface contacts to estimate complex quality.[15]
How pLDDT appears in different tools
The core meaning is the same across predictors, but the details of where and how the score is reported vary.
| Tool | How pLDDT is reported |
|---|---|
| AlphaFold2 | Per residue, 0 to 100, in the B-factor column; mean pLDDT ranks monomer models |
| ESMFold | Per residue, 0 to 100, in the B-factor column of the PDB file |
| ESMFold2 | Per residue, summarized as mean, minimum and maximum, alongside pTM and ipTM |
| Boltz-2 | Per token in the CIF; complex summaries on a 0 to 1 scale |
| Chai-1 | In the CIF structure file, with a mean pLDDT column for each ranked model |
| OpenFold3, Protenix, RoseTTAFold3 | Per atom or residue in the structure file, alongside PAE and interface scores |
| ABodyBuilder3 | Per residue from a dedicated pLDDT checkpoint, useful for spotting uncertain CDR-H3 loops |
Watch the scale. Boltz writes a complex_plddt such as 0.84 in its confidence file, which corresponds to 84 on the usual scale. Its default ranking score is 0.8 × complex pLDDT + 0.2 × ipTM.[14] AlphaFold3 and the models that follow it predict pLDDT for every atom, including ligand and nucleic acid atoms, instead of one value per residue.[4]
Short peptides, cyclic peptides and antibody loops often score lower than globular domains. A long CDR-H3 loop in an ABodyBuilder3 model can fall below 70 while the framework scores much higher. That pattern is expected for flexible loops, and it is the region to validate before docking.
The B-factor column normally stores atomic displacement in crystal structures. When a predicted model reuses it for pLDDT, high numbers mean high confidence, which is the opposite of a crystallographic B-factor. Keep that in mind before passing a predicted model to software that reads the column as a physical B-factor.
Checking pLDDT on ProteinIQ
Each protein structure prediction tool on ProteinIQ returns pLDDT with the structure, and the results viewer can color the model by confidence. A practical workflow looks like this:
- Predict the structure with a fast single-sequence model such as ESMFold or MiniFold. If large regions score below 70, try an alignment-based model such as AlphaFold2 before drawing conclusions.
- Color the model by pLDDT in the viewer or the PDB Viewer, and note which regions fall below 50 and below 70.
- Check low-confidence regions against a disorder predictor such as DR-BERT.
- For complexes, use Boltz-2, Chai-1 or OpenFold3 and read pLDDT together with ipTM and PAE, or score the interface with ipSAE.
- Before docking or mutation analysis, confirm that the residues you care about score above 90.
Single-sequence and complex predictions are covered in more depth in the single-sequence structure prediction and protein complex structure prediction use cases. The step-by-step guides for AlphaFold2 and Boltz-2 show where each confidence file appears in the results.
Frequently asked questions
What does pLDDT stand for?
Predicted local distance difference test. lDDT is a published score for comparing a model with a reference structure, and pLDDT is the model's prediction of that score for each residue.[2][1]
Is a pLDDT of 70 good?
It is the lower edge of the confident band. At 70 and above the backbone is generally correct, which is enough to read the fold and secondary structure. It is not enough to trust individual side-chain positions, which needs scores above 90.[3]
What does a pLDDT below 50 mean?
The model has very low confidence in the region. Long stretches below 50 usually correspond to intrinsically disordered regions, but they can also reflect too few related sequences or a protein unlike the training data.[3][1]
Can I compare pLDDT between different proteins or tools?
Within the same model, comparing proteins is reasonable as long as you compare regions rather than whole-protein means, because disordered tails pull the mean down. Across tools, the scale is shared but each model is calibrated separately, so a 75 from one predictor is not guaranteed to match a 75 from another.
Why is my pLDDT between 0 and 1?
Some tools and files store pLDDT as a fraction. Boltz confidence files, for example, report values from 0 to 1.[14] Multiply by 100 to read them with the usual 90, 70 and 50 cutoffs.
Does high pLDDT mean the protein binds my ligand in that conformation?
No. pLDDT describes the model's confidence in the protein structure it predicted, usually without your ligand or any modification present. Pockets can change shape when a ligand binds, so a high score supports the backbone but not a particular binding pose.[7]