TL;DR
- To run Boltz-2 online, add at least one protein, DNA, or RNA chain plus any ligands (SMILES, SDF, MOL2, PubChem, or CCD code), keep the default settings, and submit. No GPU or installation is needed.
- For a result you plan to interpret, turn on MSA generation at Normal depth and request 3 to 5 samples, then check whether the samples agree.
- Affinity is predicted only for one small molecule bound to a protein. Use affinity_probability_binary to separate binders from decoys and affinity_pred_value (log10 IC50 in μM) to rank related active compounds.
- Boltz-2 scores are model predictions, not measurements. Inspect the pose, check its geometry, and calibrate against known binders for your target before trusting a ranking.
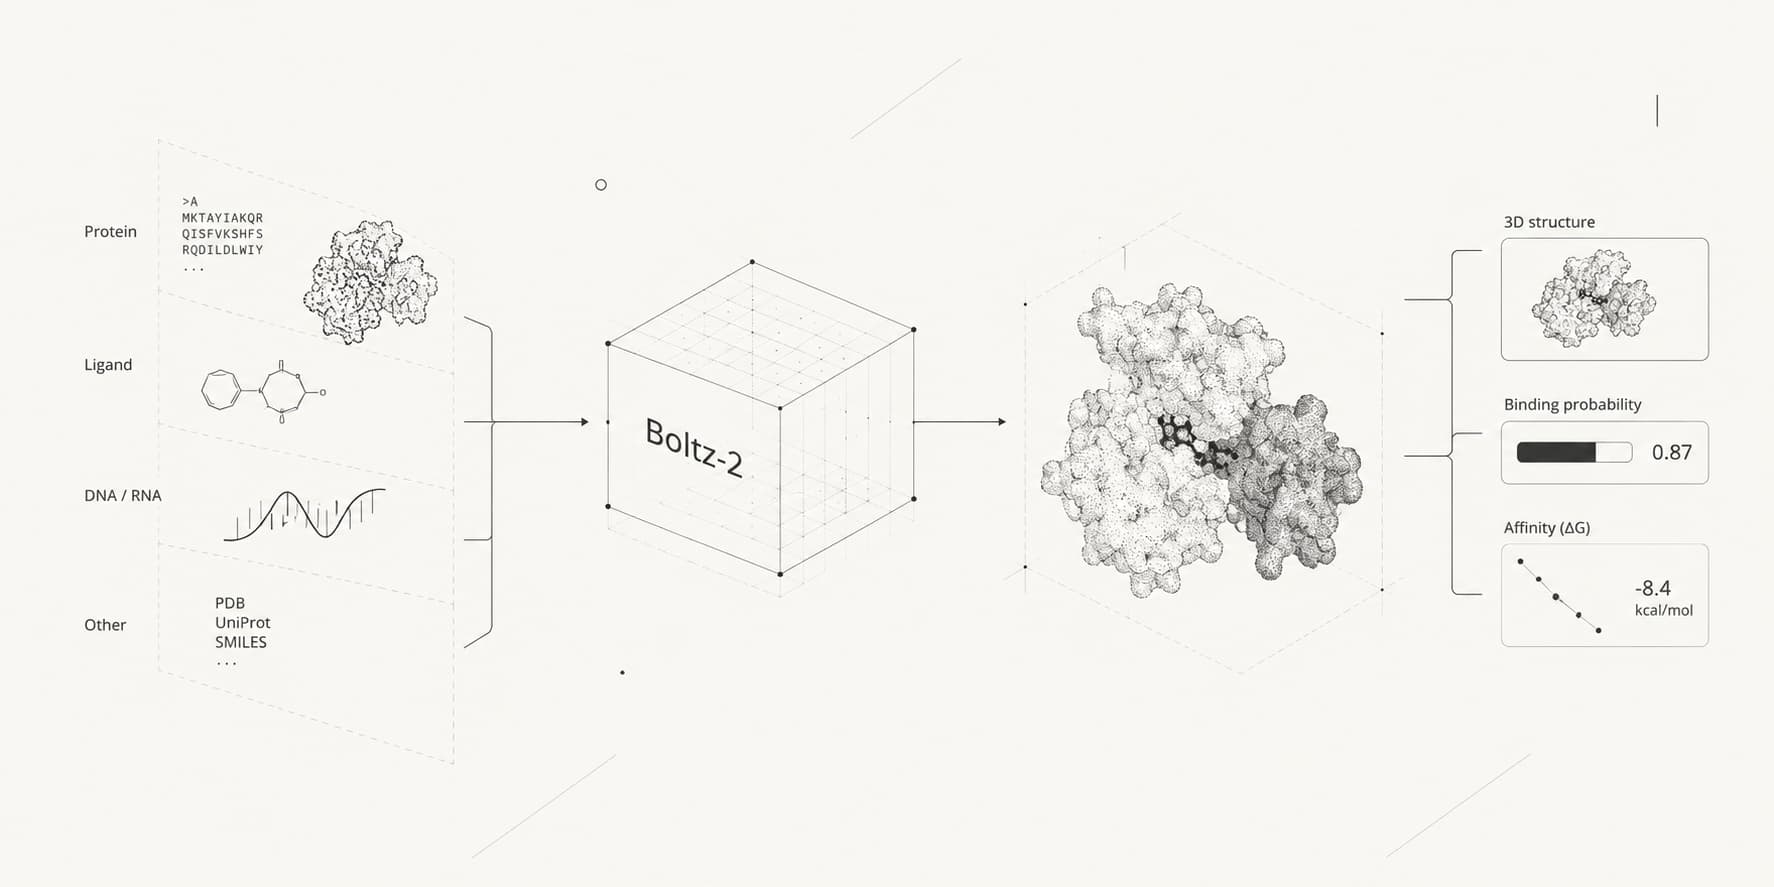
Boltz-2 is an open-source cofolding model that predicts the 3D structure of complexes made of proteins, DNA, RNA, and small molecules, and estimates how strongly a small molecule binds its protein target. Running it yourself means installing the Python package, generating multiple sequence alignments, and providing a CUDA GPU with enough memory for your complex.
The ProteinIQ Boltz-2 webserver runs the same model in a browser. You add the molecules, choose the settings, and get the predicted complex in an interactive viewer together with confidence scores, affinity values, and downloadable CIF or PDB files.[1]
Open Boltz-2 online
Open the ProteinIQ Boltz-2 webserver and create a free account. The free plan includes 200 credits, and a small Boltz-2 job starts at 50 credits.
Build the complex
Use the Add molecule button to add each protein, ligand, DNA, or RNA chain that belongs in the prediction.
Configure the settings
Keep the defaults for a first test run. For a result you plan to interpret, turn on MSA generation and request 3 to 5 samples. Templates and constraints are optional.
Submit the job
Review the chain IDs, ligand identity, and settings, then start the prediction.
Inspect and download the results
Examine the predicted structure before reading confidence or affinity scores, then download the structures and data files.
Boltz-2 answers several different questions, and its outputs are not interchangeable. Use the predicted coordinates to study how a complex might assemble, the binary affinity score to separate likely binders from decoys, and the continuous affinity value to compare related active compounds. None of these outputs is an experimental binding measurement.[2]
What is Boltz-2?
Boltz-2 is a biomolecular structure prediction model developed by researchers at MIT, Recursion, Valence Labs, and collaborating institutions. It was released in 2025 under the MIT license as the successor to Boltz-1. Like AlphaFold 3 and other all-atom cofolding models, it predicts complexes containing proteins, small molecules, DNA, and RNA from sequence and chemical inputs.[3]
Its distinguishing feature is a separate affinity module for protein-small-molecule interactions. A single run can therefore produce a proposed complex structure and two affinity outputs:
| Output | What it answers |
|---|---|
| Binding probability | Is this molecule more likely to behave like a binder or a decoy? |
| Affinity value | How does this molecule compare with other active compounds for the same target and assay context? |
The original paper reported an average Pearson correlation of 0.66 on a four-target subset of an FEP benchmark, with inference more than 1,000 times faster than the compared free-energy calculations. Results varied substantially outside that benchmark. On eight blinded internal assays, correlations exceeded 0.55 on three assays and were lower on the remaining five. The paper is a preprint, so treat these numbers as reported model results rather than a universal estimate of real-world accuracy.[3]
Boltz-2 is therefore most useful for generating and prioritizing hypotheses. It can suggest a pose, highlight uncertain regions, and help rank compounds before more expensive calculations or experiments.
How does Boltz-2 work?
Boltz-2 combines a shared molecular representation, an all-atom diffusion model, and separate confidence and affinity modules.
The trunk represents the complete complex
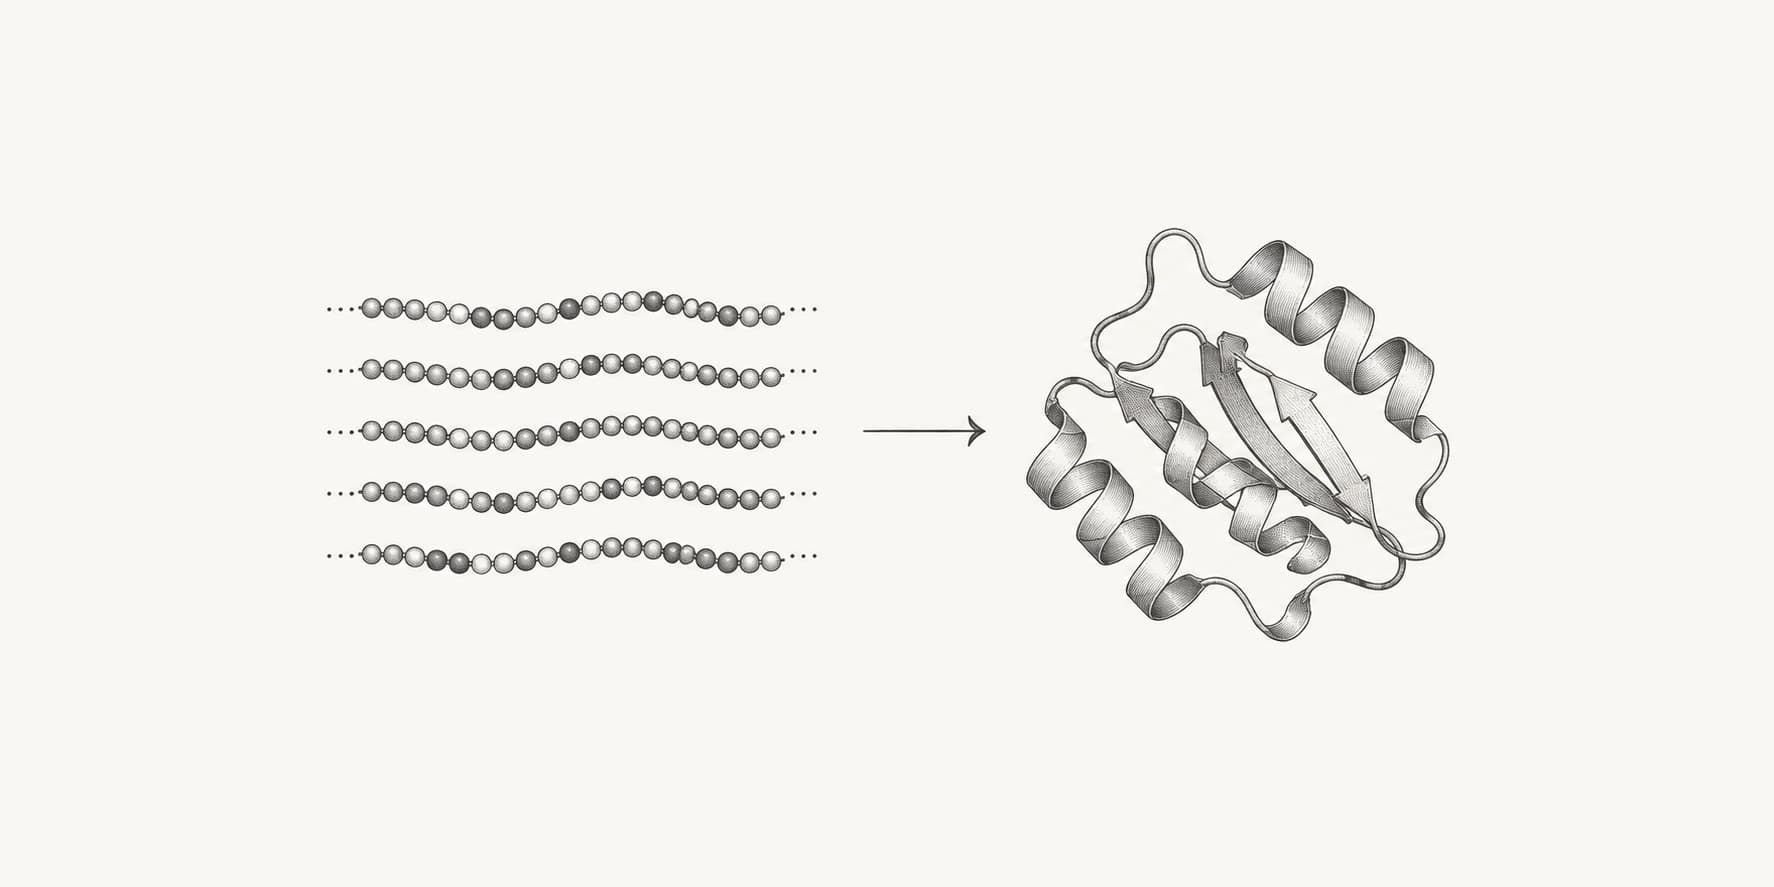
Boltz-2 first converts the input into molecular tokens. Protein residues, nucleotides, ligand atoms, templates, multiple sequence alignments, and constraints are represented together.
A neural network called the trunk repeatedly updates two kinds of information:
- A representation of each individual token
- A pairwise representation describing how every token may relate to every other token
This lets the model reason about relationships within a protein, between protein chains, and across protein-ligand or protein-nucleic-acid interfaces. The trunk is built from PairFormer blocks and can incorporate evolutionary information from an MSA when one is provided.[3]
A diffusion model generates atomic coordinates
The structure module begins with noisy atomic coordinates and gradually denoises them into a complete three-dimensional structure. The process resembles diffusion-based image generation, except that the model generates atom positions rather than pixels.
Boltz-2 performs 200 diffusion sampling steps and three recycling iterations by default. Recycling sends the model's intermediate representation through the network again so it can refine the predicted geometry. These defaults are sensible for most first runs.[2]
Boltz-2 can also apply inference-time potentials. These steer sampled structures toward physically plausible geometry and toward user-defined pocket or contact constraints, which helps when an experiment, homologous structure, or mutational study already identifies the likely interface.[2]
The confidence module scores the prediction
After generating a structure, Boltz-2 estimates several forms of uncertainty:
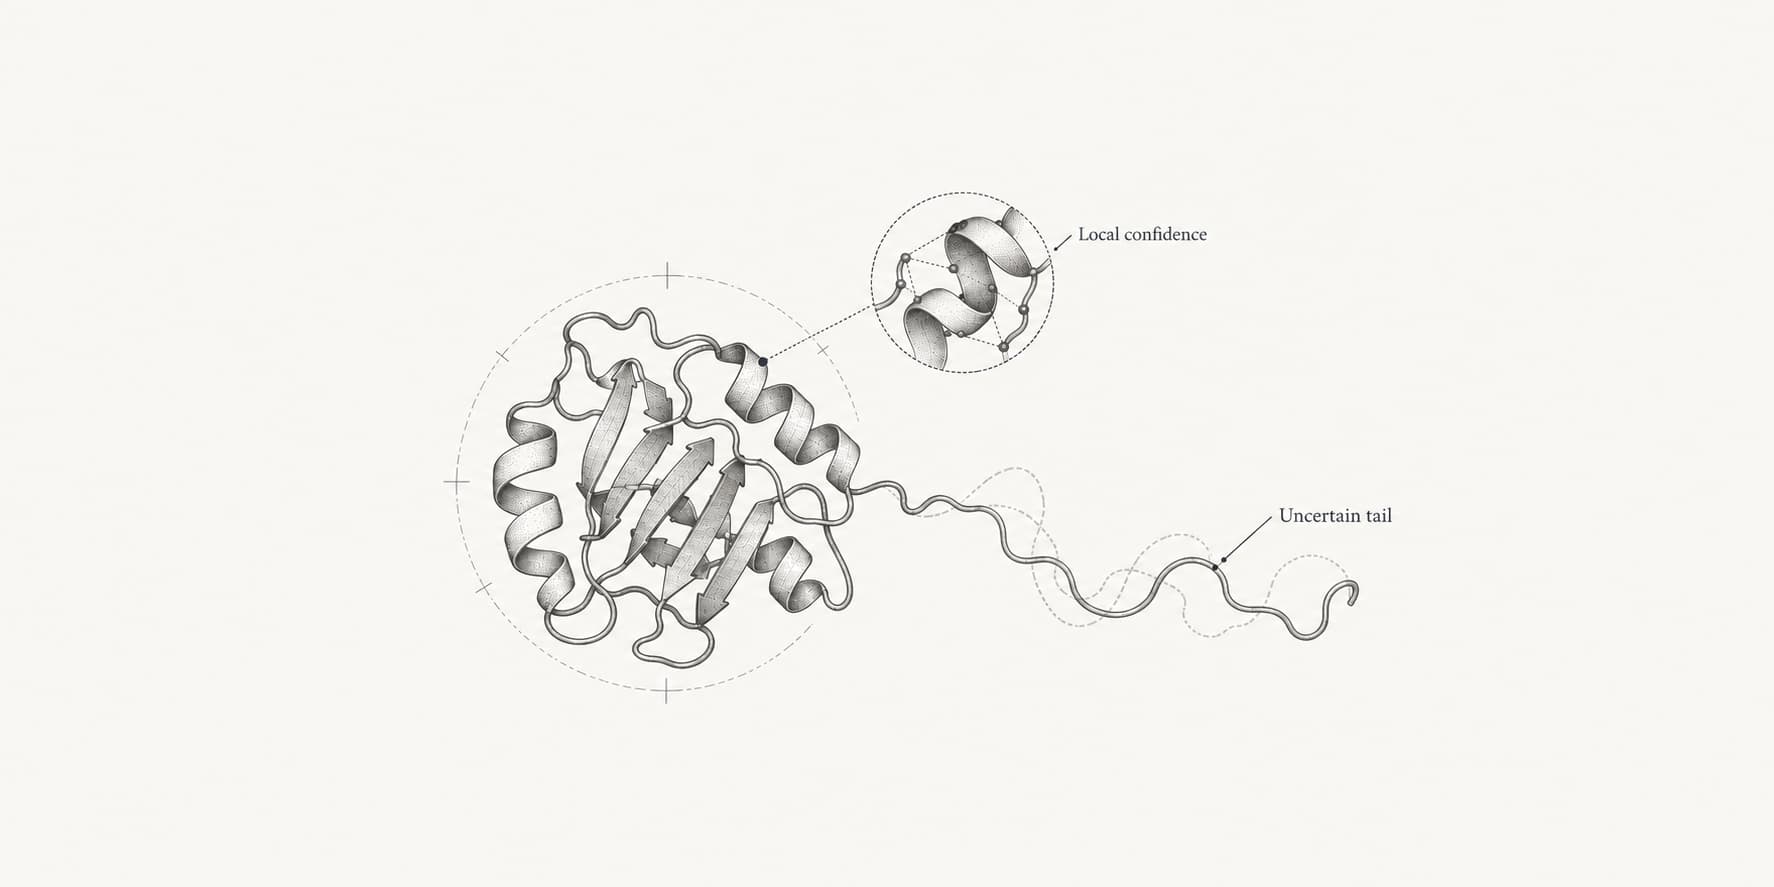
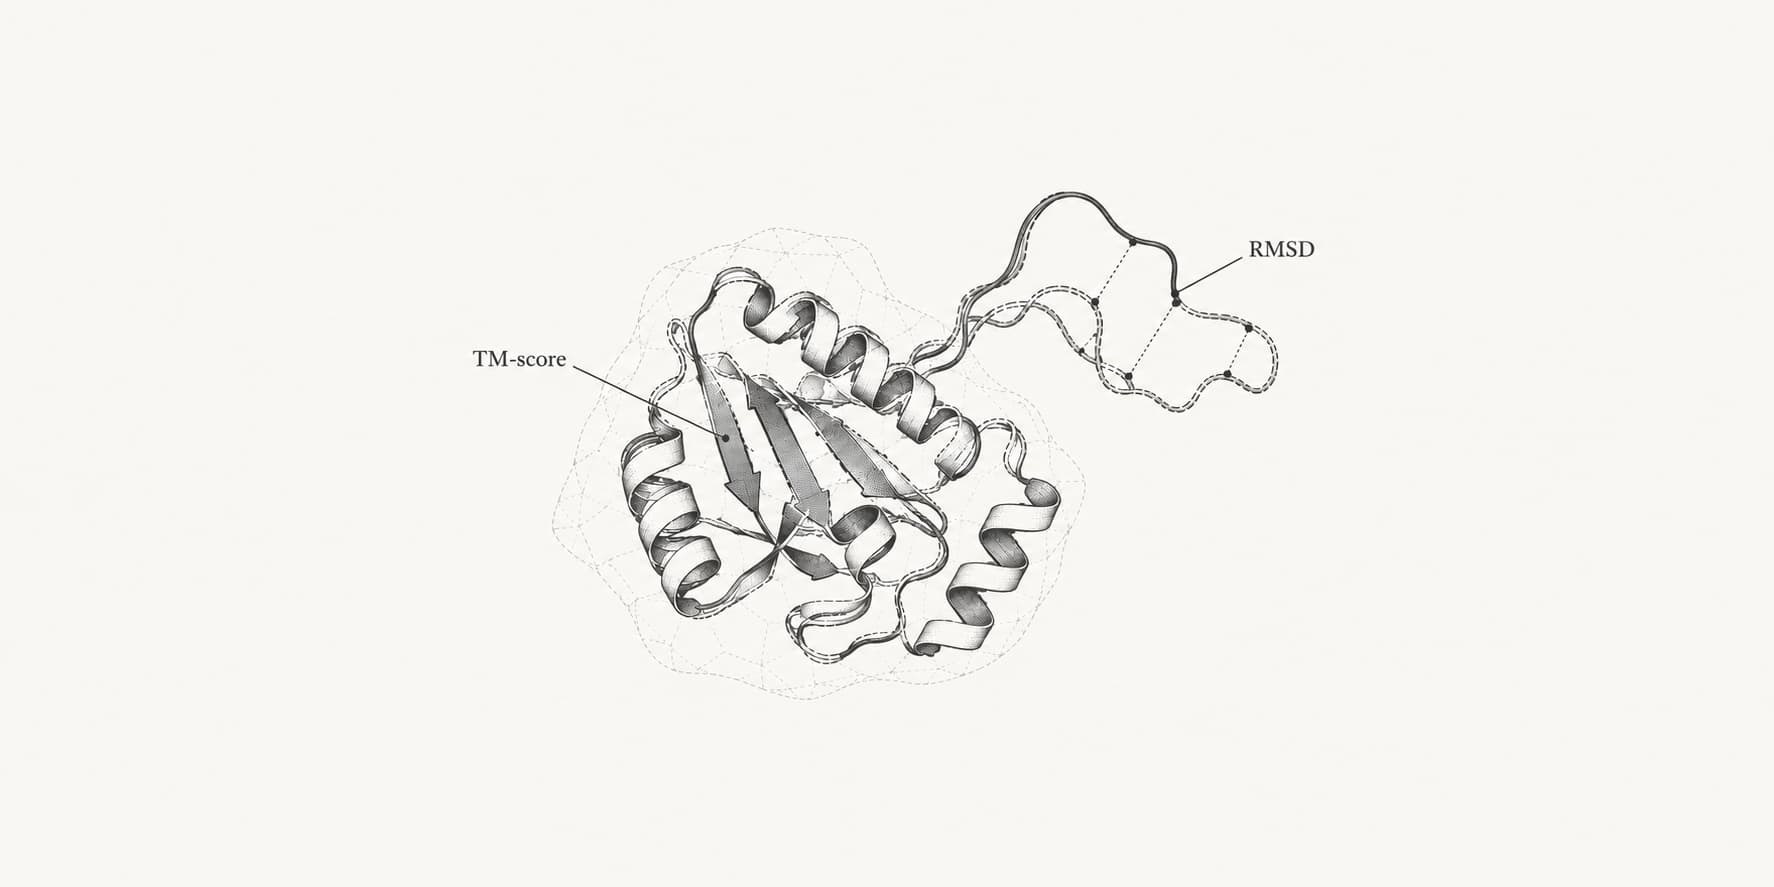
pLDDTmeasures confidence in local atomic or residue-level geometry.pTMestimates confidence in the overall fold.ipTMfocuses on the arrangement of separate chains or molecular components.PAEestimates uncertainty in the relative positions of pairs of residues or tokens.PDEestimates pairwise distance error in ångströms.
Most confidence scores run from 0 to 1, with higher values indicating greater model confidence. PAE and PDE are errors, so lower values are better. Confidence is not the same as correctness, but it shows which regions and interfaces deserve the most scrutiny.[2]
The affinity module evaluates protein-ligand binding
The affinity module receives the predicted structure and the pairwise representation of the protein-ligand interface. It then uses two prediction heads:
- A binary head trained to distinguish binders from decoys
- A continuous head trained to predict relative binding strength
The continuous head was trained on several experimental endpoint types, including IC50, Ki, Kd, and AC50, standardized onto a common logarithmic scale. Read its output as an IC50-like estimate of binding strength, not a literal prediction of the endpoint a particular assay would measure.[3]
How to use Boltz-2 online
1. Open the Boltz-2 webserver
Go to Boltz-2 online.
The form assembles a complex one molecule at a time. Each component receives a chain ID such as A, B, or C. Keep track of these IDs because templates, covalent bonds, pocket definitions, and contact constraints refer to them.
A job must contain at least one protein, DNA, or RNA chain. A ligand by itself is not a foldable system.
2. Add the molecules in your complex
Choose the input type that matches each component:
| Component | Accepted input | Current ProteinIQ limit |
|---|---|---|
| Protein | FASTA, .fa, PDB, or an RCSB chain | 10 chains |
| Ligand | SMILES, SDF, MOL, MOL2, or PubChem | 10 ligands |
| Ligand from the PDB Chemical Component Dictionary | CCD code such as ATP, NAD, HEM, or SAH | 10 ligands |
| DNA | FASTA or plain nucleotide sequence | 10 chains |
| RNA | FASTA or plain nucleotide sequence | 10 chains |
| Template | PDB, mmCIF, or an RCSB structure | 5 templates |
| Precomputed protein MSA | A3M | 10 alignments |
ProteinIQ accepts complexes of up to 5,000 residues in total. Memory use grows quickly with complex size, so removing irrelevant chains or long disordered tails makes large jobs more manageable. For very large assemblies, LMI4Boltz runs Boltz-style predictions with lower memory requirements.[1]
Paste protein sequences in the one-letter amino-acid alphabet. Headers are optional for a single sequence, but valid FASTA is easier to reuse and audit. The TXT to FASTA converter can clean up unformatted sequence lists before submission.
When starting from a PDB entry, specify the exact biological chain rather than assuming every chain in the deposited structure belongs in the prediction.
Each molecule also has a few per-molecule controls. Copies duplicates a chain for homodimers and other homo-oligomers, Cyclic marks a head-to-tail cyclic peptide or nucleic acid, and residue modifications place a CCD component such as a phosphorylated residue at a given position.[1]
3. Add the ligand correctly
For a custom compound, paste a SMILES string or upload an SDF, MOL, or MOL2 file. You can also retrieve a compound from PubChem.
Use a CCD code when the ligand is a standardized PDB component such as ATP, NAD, HEM, or an existing covalent inhibitor. CCD input is required for covalent-bond constraints because Boltz needs standardized atom names from the component definition.
For affinity prediction, keep the intended binder unambiguous. Boltz-2 predicts affinity for one small-molecule binder per job, and only for a ligand binding to a protein. It does not predict protein-protein, protein-DNA, protein-RNA, or ligand-RNA binding affinity.[2]
Ligand size also matters. The official implementation cannot compute affinity for ligands with more than 128 atoms and advises against molecules much larger than 56 atoms, the upper limit represented during affinity training. ProteinIQ accepts ligands of up to 300 heavy atoms for structure prediction, but affinity scores for large molecules are outside the model's recommended range.[2]
For peptide ligands, add the peptide as a protein chain rather than encoding it as a large small molecule.
4. Check which ligand receives an affinity score
When a job contains several ligands, ProteinIQ requests affinity for the first ligand in the job. Add the compound you want scored first, and add cofactors, ions, or other ligands after it.
The results will not include an affinity score when:
- The same ligand appears more than once, including through
Copies - The ligand SMILES contains several disconnected parts, such as a salt with its counterion (
.in the SMILES); remove the counterion before submitting - The job uses the legacy Boltz-1 model, which predicts structure only
- The job contains no small-molecule ligand
The structure is still predicted in each of these cases.[1]
5. Decide whether to generate an MSA
A multiple sequence alignment gives the model evolutionary information about which residues tend to vary together.
ProteinIQ can generate an MSA through ColabFold. The available search depths are:
| Setting | Maximum sequences | When to use it |
|---|---|---|
| Shallow | 2,048 | Fast exploratory runs |
| Normal | 8,192 | Default choice for most proteins |
| Deep | 16,384 | Difficult targets where added search time is acceptable |
You can also provide a precomputed A3M alignment. When several protein chains are present, alignments are assigned in protein-chain submission order.
For a natural protein with known homologs, use an MSA whenever prediction quality matters. The Boltz documentation states that single-sequence mode reduces accuracy. For designed proteins, orphan proteins, or a quick input check, an MSA may add little value.[2]
A practical workflow is to run one inexpensive single-sequence prediction first. Once the input and chain arrangement look correct, repeat the job with a Normal-depth MSA and compare the results.
6. Add templates only when they provide useful information
A structural template can guide Boltz-2 toward a known fold or conformational state. Upload a PDB or mmCIF file, or retrieve a structure from RCSB.
Templates are useful when:
- A close homolog has already been solved
- You need a particular domain orientation
- The protein has several known conformational states
- You want to preserve an experimentally supported backbone arrangement
Map each template to the intended query chain. Do not assume that a template automatically applies to every chain in the job.
A poor template can bias the result in the wrong direction. Run an untemplated prediction as a control whenever the template's relevance is uncertain.
7. Add pocket, contact, or covalent constraints when justified
Constraints give Boltz-2 information it would otherwise have to infer.
A pocket constraint identifies a ligand and the residues expected to form its binding site:
C|A:45,A:46|6.0|trueThis example asks ligand chain C to stay near residues 45 and 46 of protein chain A, with a maximum distance of 6 Å.
A residue contact constraint connects two positions:
A:10,B:5|8.0|trueA covalent-bond constraint identifies the exact atoms to connect:
A:12:SG,B:1:C22This example connects the sulfur atom of cysteine 12 in protein chain A to atom C22 in CCD ligand B.
Pocket and contact entries marked force=true become strict steering restraints only when Use constraint potentials is enabled. Without the potential, the model receives the constraint but may not satisfy it closely. Check even forced constraints in the completed structure rather than assuming they worked.[2]
Custom SMILES, SDF, MOL, and MOL2 ligands cannot currently be used for covalent atom constraints on ProteinIQ. Use a CCD component whose standardized atom names match the RCSB component definition.
8. Choose the sampling settings
For the first meaningful run, change as little as possible.
| Setting | Recommended starting value | When to change it |
|---|---|---|
| Number of samples | 1 for input testing, then 3 to 5 | Increase when poses or interfaces are uncertain |
| Recycling steps | 3 | Increase only when testing whether extra refinement helps |
| Sampling steps | 200 | Increase for a deliberate quality-versus-runtime comparison |
| Step scale | 1.5 | Lower values produce more diverse samples |
| Affinity sampling steps | 200 | Keep at default unless benchmarking |
| MW-corrected affinity | Off | Consider when comparing ligands of very different sizes |
| Random seed | Not set | Fix it when you need a reproducible rerun |
| Output format | CIF | Use PDB only for software that cannot read CIF |
| Save PAE matrix | Off | Enable for domain and interface uncertainty analysis |
| Method conditioning | None | Set only when targeting a specific experimental structural style |
The official defaults are three recycling steps, 200 structure sampling steps, a Boltz-2 step scale of 1.5, 200 affinity sampling steps, and five affinity diffusion samples. CIF is the default structure format.[2]
More samples are usually more useful than more diffusion steps. Multiple samples show whether the same fold, interface, or ligand pose appears consistently.
Leave confidence filtering disabled for the first run. A low-confidence sample can still reveal alternative conformations or explain why the model is uncertain.
9. Submit the job
Give the run a descriptive name that identifies the target, ligand, and important settings. For example:
KRAS_G12C_U4U_MSA_5samplesReview the chain order and ligand identity one last time, then submit the job.
The completed result opens with three main views:
- Viewer: interactive inspection of the predicted structures
- Data: confidence and affinity results in tabular form
- Files: structures, JSON data, matrices, and the run log
All result files can be downloaded for downstream analysis.[1]
How to interpret Boltz-2 results
Inspect the structure first
Start with the highest-ranked sample, but also compare the alternatives.
Check:
- Whether the expected domains are folded
- Whether separate chains form a plausible interface
- Whether the ligand occupies a chemically sensible pocket
- Whether covalent or contact constraints were satisfied
- Whether the ligand has the expected stereochemistry and geometry
- Whether different samples converge on the same pose
A high confidence score cannot rescue a chemically impossible ligand pose. Inspect the structure and check its geometry before interpreting affinity.
For ligand complexes, run PoseBusters on the predicted complex to check bond geometry, clashes, stereochemistry, and other physical plausibility issues. PLIP lists the hydrogen bonds, hydrophobic contacts, salt bridges, and stacking interactions in the pose, which makes it easier to compare samples or check a pose against known structure-activity data.
Read confidence at the right level
pLDDT is mainly a local confidence measure. It identifies uncertain loops or flexible termini, but it does not by itself show that two chains are arranged correctly.
For multicomponent complexes, pay particular attention to ipTM and the cross-chain regions of the PAE matrix. A protein can have confident local folds while the relative placement of its chains or ligand remains uncertain.
The combined confidence_score is useful for ranking samples from the same job. It is not a calibrated probability that the entire structure is correct.[2]
Use affinity probability for hit discovery
affinity_probability_binary estimates how binder-like the ligand appears relative to decoys, on a scale from 0 to 1.
Use it when screening diverse molecules and asking which compounds are worth investigating further. Higher values indicate greater binder-like probability, but the official documentation does not define a universal cutoff that works across targets.
Calibrate the score with known binders and presumed non-binders for your own target. A threshold that works for one protein family or assay may perform poorly for another.[2]
Use affinity value for related active compounds
affinity_pred_value is intended for comparing compounds that are already active, particularly within a chemically related series.
The output is:
log10(IC50 in μM)Lower values indicate stronger predicted binding. Convert the output back to micromolar units with:
IC50 (μM) = 10 ^ affinity_pred_value| Boltz-2 value | Converted concentration |
|---|---|
| -3 | 0.001 μM = 1 nM |
| -2 | 0.01 μM = 10 nM |
| -1 | 0.1 μM = 100 nM |
| 0 | 1 μM |
| 1 | 10 μM |
| 2 | 100 μM |
For example, a predicted value of -1.5 corresponds to approximately 0.032 μM, or 32 nM.
This conversion does not make the result an experimental IC50. Because the training data combines several measurement types and assay conditions, use the score for relative prioritization within a consistent target and compound series. The official documentation specifically discourages using the continuous value to rank mixtures of active and inactive molecules.[2]
Boltz-2 examples
KRAS G12C with a covalently attached ligand
This example predicts human KRAS G12C with the U4U ligand from the PDB Chemical Component Dictionary. It demonstrates a protein-ligand run with an explicit covalent bond between the mutated cysteine and a named ligand atom.
- Inputs: one 168-residue KRAS G12C protein chain and U4U as a CCD ligand
- Non-default settings:
Number of samples=5to compare repeated predictions;Generate MSA= on withNormaldepth to add evolutionary context;Step scale=1.638to preserve the submitted sampling configuration;Use constraint potentials= on;Covalent bonds=A:12:SG,B:1:C22
The Structure view keeps the U4U ligand and the surrounding KRAS fold visible while retaining all five ranked predictions. The covalent-bond definition tells Boltz-2 which atoms should be connected; the image does not establish that the predicted geometry or binding mode is experimentally correct.
This historical result repeats the same run-level estimate across its five rows: an Affinity Pred Value of -0.401 log10(IC50) μM, roughly 0.4 μM, and an Affinity Probability Binary of 0.950. This is one affinity evaluation from the native rank-0 complex, not five independent affinity measurements. Their average Complex Plddt is 0.960, with a standard deviation of 0.002. This consistency is useful for inspecting the run, but predicted affinity and confidence are model outputs rather than experimental measurements of potency or covalent engagement.
Transcription-factor dimer on a DNA duplex
This four-chain example combines two complementary 15-nucleotide DNA strands with two copies of the same transcription-factor construct. It demonstrates joint prediction of a protein dimer and a sequence-specific DNA duplex.
- Inputs: DNA strands
TGGGTCACGTGTTCCandAGGAACACGTGACCC, plus two identical 89-residue protein chains - Non-default settings:
Number of samples=5to assess prediction consistency;Generate MSA= on withNormaldepth for the protein chains;Step scale=1.638to preserve the submitted sampling configuration
The Structure view shows the two protein chains arranged around the predicted DNA duplex. It is useful for examining the overall assembly and whether the nucleic acid remains duplex-like, but it does not prove sequence-specific recognition or identify experimentally validated contacts.
The top-ranked prediction has pTM = 0.912 and Iptm = 0.913. Across all five predictions, average Complex Plddt is 0.966 and average Complex Iplddt is 0.979, indicating consistent confidence in the returned assembly. Because this job has no ligand, the displayed affinity value 0.000 and probability 0.500 are placeholders, not protein-DNA binding results.
Human U1A protein bound to a U1 snRNA hairpin
This example uses the 97-residue human U1A RNA-recognition domain and the 21-nucleotide U1 snRNA hairpin from PDB 1URN. It adds a compact protein-RNA workflow to the protein-ligand and protein-DNA examples above.
- Inputs: U1A protein sequence from PDB 1URN and RNA sequence
AAUCCAUUGCACUCCGGAUUU - Non-default settings: none; the job uses one structure sample, no generated MSA, no constraints, and CIF output
The Structure view shows a compact protein-RNA assembly for the single returned prediction. It demonstrates that Boltz-2 accepts RNA as a first-class polymer input rather than treating it as a small-molecule ligand.
The result reports Confidence Score = 0.934, pTM = 0.935, Iptm = 0.881, Complex Plddt = 0.947, and Complex Iplddt = 0.953. These values support inspection of the predicted overall fold and interface, but they do not validate the exact base contacts, binding specificity, or agreement with the experimental 1URN structure.
What can you use Boltz-2 for?
Predicting protein-ligand complexes from sequence
Boltz-2 can start from a protein sequence and a ligand rather than a prepared receptor structure, which makes it useful when no experimental structure is available. This is the main difference from classical protein-ligand docking.
The result provides an initial binding-pose hypothesis for later docking, molecular dynamics, free-energy calculations, mutagenesis planning, or experimental structure determination.
Ranking a lead series
For a group of related active molecules tested against the same target, the continuous affinity output can help prioritize compounds before more expensive calculations.
Keep the protein sequence, templates, constraints, and model settings constant across the series. Changing the structural context between compounds introduces variation that can obscure the comparison.
Screening for likely binders
The binary affinity probability is better suited to broad hit discovery than the continuous value. Use known positive and negative controls to check whether the score separates compounds on your target before expanding to a larger virtual screening library.
Predicting protein-protein and protein-nucleic-acid structures
Boltz-2 predicts complexes containing multiple proteins, DNA, or RNA, including transcription factor-DNA complexes, protein-RNA complexes, and assemblies that mix several biomolecule types. See protein complex structure prediction for how it compares with other complex predictors.
These jobs produce structures and confidence estimates, but not protein-protein or nucleic-acid binding affinity.[2]
Modeling covalent complexes
When the ligand exists in the PDB Chemical Component Dictionary, Boltz-2 can model a specified covalent connection between a protein residue and a ligand atom.
This is useful for covalent inhibitors, cofactors, and other systems where the bond is already known. It does not establish that a covalent reaction will occur. The bond is an input assumption.
What are the limitations of Boltz-2?
Boltz-2 is fast enough to test many hypotheses, but its affinity output has a narrower scope than its structure model.
The main limitations are:
- Affinity prediction supports one small molecule binding to a protein.
- Ligands much larger than 56 atoms are outside the recommended training range.
- Affinity depends on the model generating the correct pocket, pose, protonation context, and protein state.
- The affinity module does not explicitly model waters, ions, cofactors, multimeric partners, or assay conditions.
- Large ligand-induced conformational changes can be missed.
- A confident structure does not guarantee an accurate affinity estimate.
- The original Boltz-2 paper remains a preprint.[3]
Independent evaluations reinforce the need for target-specific calibration. A 2026 benchmark of 10,933 ChEMBL compounds across 356 targets, chosen to avoid overlap with the Boltz-2 training data, reported a mean absolute error of about 0.9 log units and found no clear link between prediction error and how novel a target or compound was.[4]
A separate 2026 study screened 16,780 compounds against SARS-CoV-2 3CLpro and 21,702 against TNKS2. Boltz-2 correlated only weakly to moderately with physics-based binding free energies (Pearson r = 0.24 and 0.45), and its top 100 compounds shared just 2 and 1 compounds with the physics-based top 100. Against experimental TNKS2 affinities from BindingDB, however, Boltz-2 reached r = 0.77.[5]
These studies used different datasets and reference methods, so they should not be collapsed into one accuracy number. The practical rule is simple: test Boltz-2 against compounds with known outcomes on your target before trusting its ranking of unknown compounds.
Boltz-2 alternatives
The best alternative depends on what information you already have.
| Tool | Choose it when |
|---|---|
| OpenFold-3 | You want an independent all-atom complex structure prediction |
| Chai-1 | You want to cross-check a biomolecular complex with another cofolding model |
| Protenix | You want an open AlphaFold 3-style model as a second structural opinion |
| DiffDock-L | You already have a receptor structure and want blind ligand-pose prediction |
| GNINA | You know the binding region and want docking with convolutional-neural-network scoring |
| AutoDock Vina | You want a conventional, configurable docking search within a defined box |
| AlphaFold2 | You only need a protein or protein complex, with no ligands or nucleic acids |
| BoltzGen | You want to design new protein or peptide binders rather than predict a known complex |
Boltz-2 differs from conventional docking because it generates the receptor and complex together from sequence. This helps when there is no experimental structure, but it also means errors in the predicted protein conformation can propagate into the ligand pose and affinity score.
When a high-quality receptor structure and known pocket are available, AutoDock Vina or GNINA gives more direct control over the search region. DiffDock-L is useful when the pocket is unknown but the receptor structure is already prepared.
For important decisions, agreement between structurally different methods is more informative than a single high score. A ligand pose supported by Boltz-2, a docking model, structural constraints, and experimental structure-activity relationships is more credible than one supported by Boltz-2 alone.
A practical first-run recipe
For a first protein-ligand prediction:
- Add one protein sequence.
- Add one ligand as SMILES or SDF, without counterions.
- Leave templates and constraints empty.
- Run one sample without an MSA to verify the input.
- Repeat with a Normal-depth MSA and five samples.
- Keep three recycling steps and 200 sampling steps.
- Inspect the ligand pose and interface, then check it with PoseBusters.
- Use affinity probability for binder classification.
- Use affinity value only when comparing related active molecules.
Frequently asked questions
Can I use Boltz-2 without coding?
Yes. The ProteinIQ Boltz-2 webserver provides sequence, ligand, MSA, template, constraint, sampling, and output settings in a browser interface. You do not need to install the command-line package or manage GPU infrastructure.
Is Boltz-2 free to use online?
The model itself is free and open source under the MIT license. Running it still needs GPU compute. On ProteinIQ, the free plan includes 200 credits and a small Boltz-2 job starts at 50 credits, with the exact price shown before you submit.[1]
Does Boltz-2 need a protein structure?
No. You can provide a protein sequence and let Boltz-2 predict the protein and ligand complex together. A known structure can still help as a template, while conventional docking tools generally require a prepared receptor structure.
Does Boltz-2 need an MSA?
No, but single-sequence mode reduces accuracy according to the official documentation. Start without an MSA when checking an input or working with a designed protein, then compare the result with an MSA-enabled run when suitable homologs exist.[2]
Why are there no affinity results for my job?
Affinity is only computed for a single small-molecule ligand bound to a protein with the Boltz-2 model. It is skipped when the job has no ligand, when the same ligand appears more than once, when the SMILES contains a salt or other disconnected parts, or when the legacy Boltz-1 model is selected.
Can Boltz-2 predict protein-protein binding affinity?
No. It can predict the structure of a protein-protein complex, but its affinity module is designed for a small molecule binding to a protein.[2]
Is Boltz-2 better than AlphaFold 3?
Not across every structure prediction task. In the Boltz-2 paper, the model was competitive with other cofolding systems but remained behind AlphaFold 3 overall on the authors' structure benchmark, including antibody-antigen prediction. Boltz-2's main distinction is its open implementation and integrated protein-small-molecule affinity module, not universal structural superiority.[3]
How many samples should I generate?
Use one sample to verify that the input runs. For a real prediction, three to five samples give a basic view of structural consistency without making the job unnecessarily large. Increase to 10 or 20 when alternative poses, flexible interfaces, or constraint satisfaction are central to the question, and compare whether the samples converge rather than picking the highest score without inspection.