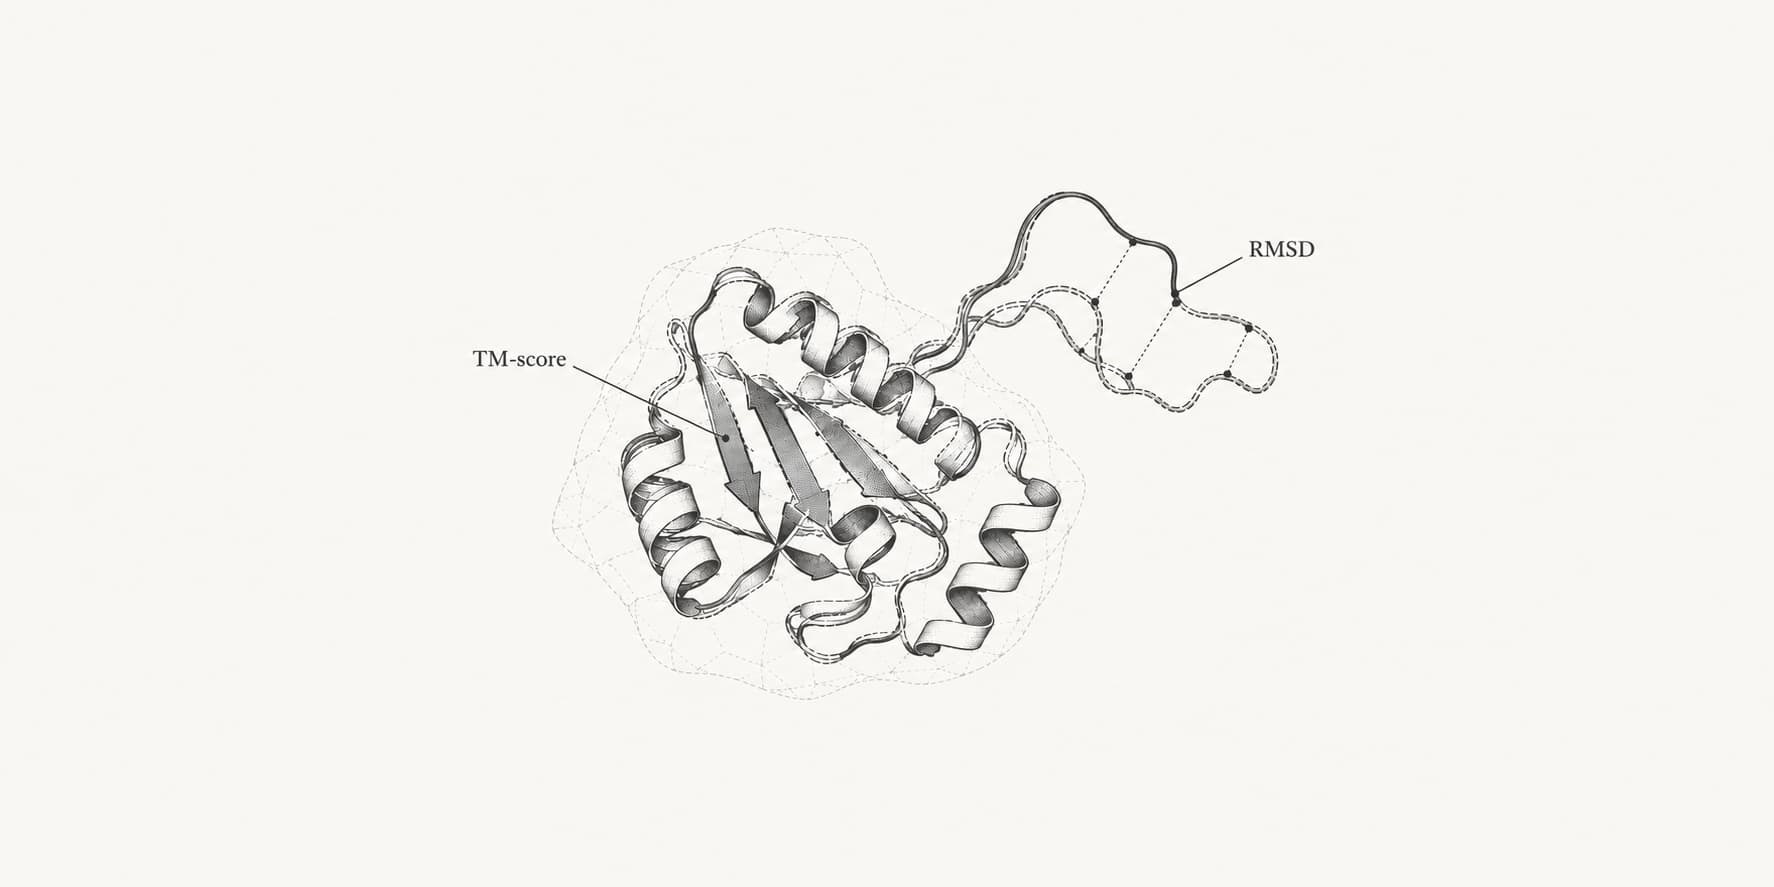
RMSD (root-mean-square deviation) is the average distance, in ångströms, between matched atoms of two structures after they have been superimposed. TM-score (template modeling score) is a number from 0 to 1 that rates how much of one structure's fold is reproduced in the other. Lower RMSD is better, and 0 Å means identical coordinates. Higher TM-score is better, and 1 means a perfect match.
The two answer different questions. RMSD is the right tool when the structures are nearly the same and you want to know by how much they differ: a docked ligand against its crystal pose, a molecular dynamics frame against the starting model, a redesigned protein against its design. TM-score is the right tool when you want to know whether two structures share a fold, especially when they differ in size or only partly agree. A TM-score above 0.5 means the two proteins almost always have the same fold, and scores below about 0.17 are what unrelated proteins get by chance.[2][8] Most structure comparison tools, including US-align, report both, and the most reliable reading uses them together with the number of residues that were actually compared.
RMSD and TM-score at a glance
| RMSD | TM-score | |
|---|---|---|
| What it measures | Average distance between matched atoms after superposition | Fraction of residues placed close to their partners, with closer pairs counting more |
| Units and range | Ångströms, 0 to unbounded | Unitless, 0 to 1 |
| Better value | Lower | Higher |
| Effect of protein size | Grows with length for unrelated structures | Normalized so random pairs score about 0.17 at any length |
| Effect of one badly placed region | Large, because distances are squared | Small, because each residue's contribution saturates |
| Common reference points | Under 2 Å for a docked ligand pose; under 2 Å backbone for a refolded design | Above 0.5 for the same fold; below 0.17 for unrelated proteins |
| Typical uses | Docking poses, MD trajectories, NMR ensembles, design self-consistency | Prediction accuracy, fold search, clustering, comparing homologs of different length |
How RMSD works
RMSD takes N pairs of matched atoms, usually the Cα atom of each residue, measures the distance between each pair and combines them:
Before measuring, one structure is rotated and translated onto the other to make the RMSD as small as possible. The standard way to find that superposition is the Kabsch algorithm, which solves for the optimal rotation directly.[5] Without superposition the number mostly reflects where each file happens to sit in space. The RMSD Calculator reports both values, labeled RMSD and unfitted RMSD, so you can see the difference.
The atoms you choose change the answer. A Cα RMSD describes the backbone trace, a backbone RMSD adds the N, C and O atoms, and an all-atom RMSD includes side chains, which move more and push the value up. A 2 Å all-atom RMSD and a 2 Å Cα RMSD are not the same result. Molecular dynamics packages such as GROMACS often report RMSD in nanometers, so 0.2 nm is 2 Å.
A good example of RMSD in its element is ubiquitin. The X-ray structure 1UBQ and the first model of the NMR ensemble 1D3Z were solved by different methods, in a crystal and in solution, yet all 76 Cα atoms agree to 0.52 Å after superposition.[11][12] At that level of similarity RMSD is precise and easy to read, which is why the RMSD Calculator docs use this pair as their worked example.
Where RMSD misleads
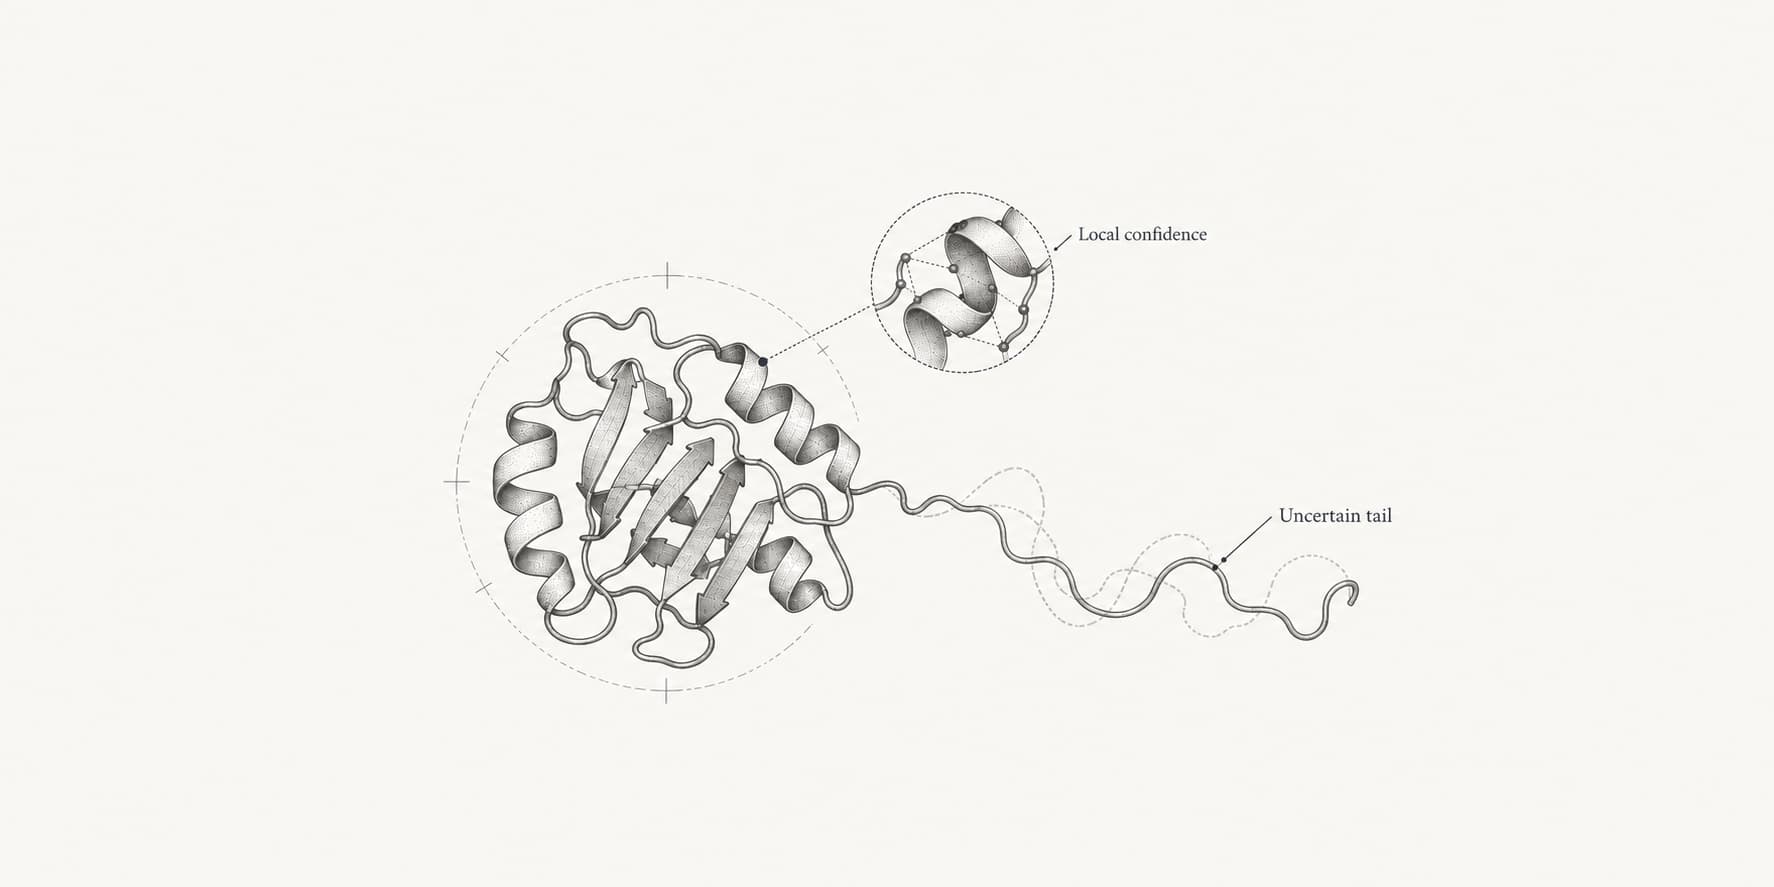
RMSD squares every distance before averaging, so the largest deviations dominate. One loop or terminus that swings 15 Å away can raise the RMSD of an otherwise perfect model to several ångströms. It is also an average over whatever atoms were matched. A tool that aligns only the agreeing part of two structures can report a small RMSD that describes a small fraction of the protein.
RMSD also depends on size. Two unrelated compact proteins of 50 residues cannot be very far apart, while two unrelated 500-residue proteins can, so a given RMSD means something different at different lengths. Maiorov and Crippen discussed how hard it is to set a meaningful RMSD cutoff for globular proteins, and Carugo and Pongor proposed RMSD100, a version rescaled to a 100-residue protein, to make values comparable across sizes.[6][7]
How TM-score works
TM-score was introduced by Zhang and Skolnick in 2004 to fix both problems.[1] Instead of averaging squared distances, it gives each aligned residue a score between 0 and 1 that falls off with distance, then divides the sum by the length of the reference structure:
A residue sitting exactly on its partner contributes 1. A residue at distance contributes 0.5. A residue 20 Å away contributes almost nothing, but it cannot drag the score below zero, so one misplaced loop costs only its own share. Residues that were not aligned at all contribute 0, and because the sum is divided by the full reference length , a partial match is penalized for what it leaves out.
The scale grows with protein length:
It works out to about 2.3 Å for a 50-residue protein, 3.7 Å at 100 residues, 5.3 Å at 200 and 7.9 Å at 500. For chains of 21 residues or fewer, US-align fixes at 0.5 Å, the smallest value it allows.[10] This scaling is what makes the score size-independent for random pairs: the average TM-score of two unrelated proteins is about 0.17 regardless of length.[8]
The same scaling also means that a fixed RMSD gives very different TM-scores depending on size. The chart below shows an idealized case in which every residue is displaced by exactly the same distance, so the RMSD equals that distance. A uniform 2 Å error gives a TM-score of 0.56 for a 50-residue protein and 0.94 for a 500-residue protein. A uniform 4 Å error is a different fold at 50 residues (0.24) and still the same fold at 150 (0.57).
What counts as a good TM-score
| TM-score | Reading |
|---|---|
| 1.0 | Identical structures |
| Above 0.8 | Very close match, like the ubiquitin and globin examples below |
| 0.5 to 0.8 | Same fold, with differences in loops, domain orientation or packing |
| 0.17 to 0.5 | Partial or ambiguous similarity; usually a different fold |
| Below 0.17 | Indistinguishable from unrelated proteins |
The 0.5 boundary is not arbitrary. Xu and Zhang compared 6,684 non-homologous single-domain proteins and found that the probability of two proteins sharing a SCOP or CATH fold jumps sharply around a TM-score of 0.5. A score of 0.5 has a P-value of 5.5 × 10⁻⁷, meaning you would need about 1.8 million random protein pairs to see one score that high by chance.[2] For RNA, the equivalent TM-score threshold is 0.45.[9]
Which length to normalize by
TM-score depends on which structure's length goes in the denominator, so most programs report two values. US-align and TM-align print one TM-score normalized by the first structure and one by the second.[3][4] When you compare a prediction against an experimental structure, use the score normalized by the experimental structure. When you ask whether a small domain occurs inside a larger protein, normalizing by the smaller one tells you how much of the domain is found, and normalizing by the larger one tells you how much of the big protein it explains.
Worked examples with real structures
The table below compares five pairs of PDB entries using the US-align source code (commit 1fa25a9). "Aligned" is US-align's own structural alignment, which picks the residue pairs itself. "Matched" uses residue numbers to pair every residue, which is how the RMSD Calculator works by default. All values are for Cα atoms.
| Pair | What differs | Residues | TM-score | RMSD over the aligned residues | RMSD over all matched residues |
|---|---|---|---|---|---|
| Ubiquitin, 1UBQ vs 1D3Z model 1 | Crystal vs NMR | 76 | 0.97 | 0.52 Å (76 aligned) | 0.52 Å |
| Myoglobin 1A6M vs hemoglobin α chain 1A3N | 27% sequence identity | 151 and 141 | 0.85 to 0.91 | 1.48 Å (141 aligned) | Not applicable |
| Adenylate kinase, 4AKE vs 1AKE | Open vs closed | 214 | 0.68 | 3.57 Å (179 aligned) | 7.13 Å |
| Calmodulin, 1CLL vs 1CDL | Extended vs wrapped around a peptide | 144 and 142 | 0.51 to 0.52 | 1.73 Å (79 aligned) | 14.82 Å |
| Ubiquitin 1UBQ vs myoglobin 1A6M | Unrelated folds | 76 and 151 | 0.22 to 0.36 | 3.91 Å (47 aligned) | Not applicable |
Distant relatives: myoglobin and hemoglobin
Sperm whale myoglobin and the α chain of human hemoglobin share only 27% of their aligned amino acids, which sits in the twilight zone where sequence comparison alone becomes unreliable.[17][18] Structurally, they are plainly the same globin fold. US-align aligns all 141 residues of the α chain with an RMSD of 1.48 Å, and the TM-score is 0.91 normalized by the α chain and 0.85 normalized by the slightly longer myoglobin. This is the kind of relationship that structure search with Foldseek or US-align finds and sequence search can miss.
A hinge motion: adenylate kinase
Adenylate kinase from E. coli closes two small domains, called LID and NMP, over its substrates. The apo structure 4AKE is open, and 1AKE is closed around the inhibitor Ap5A.[13][14] Matched residue by residue, the global Cα RMSD is 7.13 Å, which on its own would suggest two quite different proteins. The TM-score of 0.68 says the opposite: the same fold with something moved.
Splitting the protein shows what moved. Fitting and measuring only the CORE domain (residues 1 to 29, 60 to 121 and 160 to 214) gives 1.98 Å. With that core held fixed, the LID domain (122 to 159) sits 15.6 Å from its closed position and the NMP domain (30 to 59) 11.2 Å. Superimposed on their own, the LID domain differs by only 0.47 Å and the NMP domain by 1.58 Å. Every domain keeps its shape and the global RMSD is almost entirely the hinge motion.
The 3.57 Å that US-align reports is not a contradiction. US-align optimizes TM-score and reports RMSD only over the 179 residues it chose to align, leaving out residues that do not fit the superposition. Always read an RMSD next to the number of residues it covers.
When both global scores struggle: calmodulin
Calmodulin has two lobes joined by a long linker. In the calcium-bound crystal structure 1CLL the molecule is an extended dumbbell. In 1CDL the linker bends and both lobes wrap around a target peptide.[15][16] Each lobe barely changes: the N-terminal lobe superimposes to 0.89 Å and the C-terminal lobe to 0.67 Å. Matched across the whole chain, the RMSD is 14.82 Å.
The TM-score of 0.52 is better but still sits right at the same-fold boundary. US-align's structural alignment covers only 79 residues, essentially one lobe, at 1.73 Å. Neither global score describes this pair well, because any single rigid superposition can fit only one lobe at a time. For multi-domain proteins, align and score each domain separately, or use a superposition-free local score such as lDDT, which compares distances within each structure instead of after a global fit.[20]
Unrelated proteins: ubiquitin and myoglobin
Ubiquitin is a β-grasp fold and myoglobin is all α-helical. US-align still finds 47 residue pairs it can superimpose to 3.91 Å, an RMSD that would look respectable without context. The TM-score is 0.22 normalized by myoglobin and 0.36 normalized by the shorter ubiquitin, both well below 0.5. This example shows why an RMSD without coverage is not evidence of similarity, and why the normalization choice can move a TM-score by more than 0.1 when the lengths differ by a factor of two.
Which metric to use for each task
| Task | Primary metric | What to check | ProteinIQ tools |
|---|---|---|---|
| Compare a predicted structure with an experimental one | TM-score normalized by the experimental structure | RMSD over the well-predicted core, lDDT for local accuracy | US-align, RMSD Calculator |
| Decide whether two proteins share a fold | TM-score above 0.5 | Coverage and both normalizations | US-align, Foldseek |
| Search a database for similar structures | TM-score or alignment probability | E-value, sequence identity | Foldseek |
| Cluster many structures | TM-score threshold, often 0.5 | Coverage threshold | Foldseek |
| Follow a molecular dynamics run | RMSD over time | Atom selection, reference frame, units | MD Trajectory Analysis, pyRMSD |
| Compare conformational ensembles | Pairwise RMSD matrix | Core vs flexible regions | pyRMSD, AlphaFlow, BioEmu |
| Judge a docked ligand pose | Ligand RMSD under 2 Å | Physical validity of the pose | PoseBusters |
| Judge a protein-protein docking model | DockQ | Interface RMSD, fraction of native contacts | DockQ |
| Check whether a design folds as intended | Backbone RMSD between design and prediction | pLDDT, pAE, ipTM | ESMFold, AlphaFold2, BindCraft |
Structure prediction
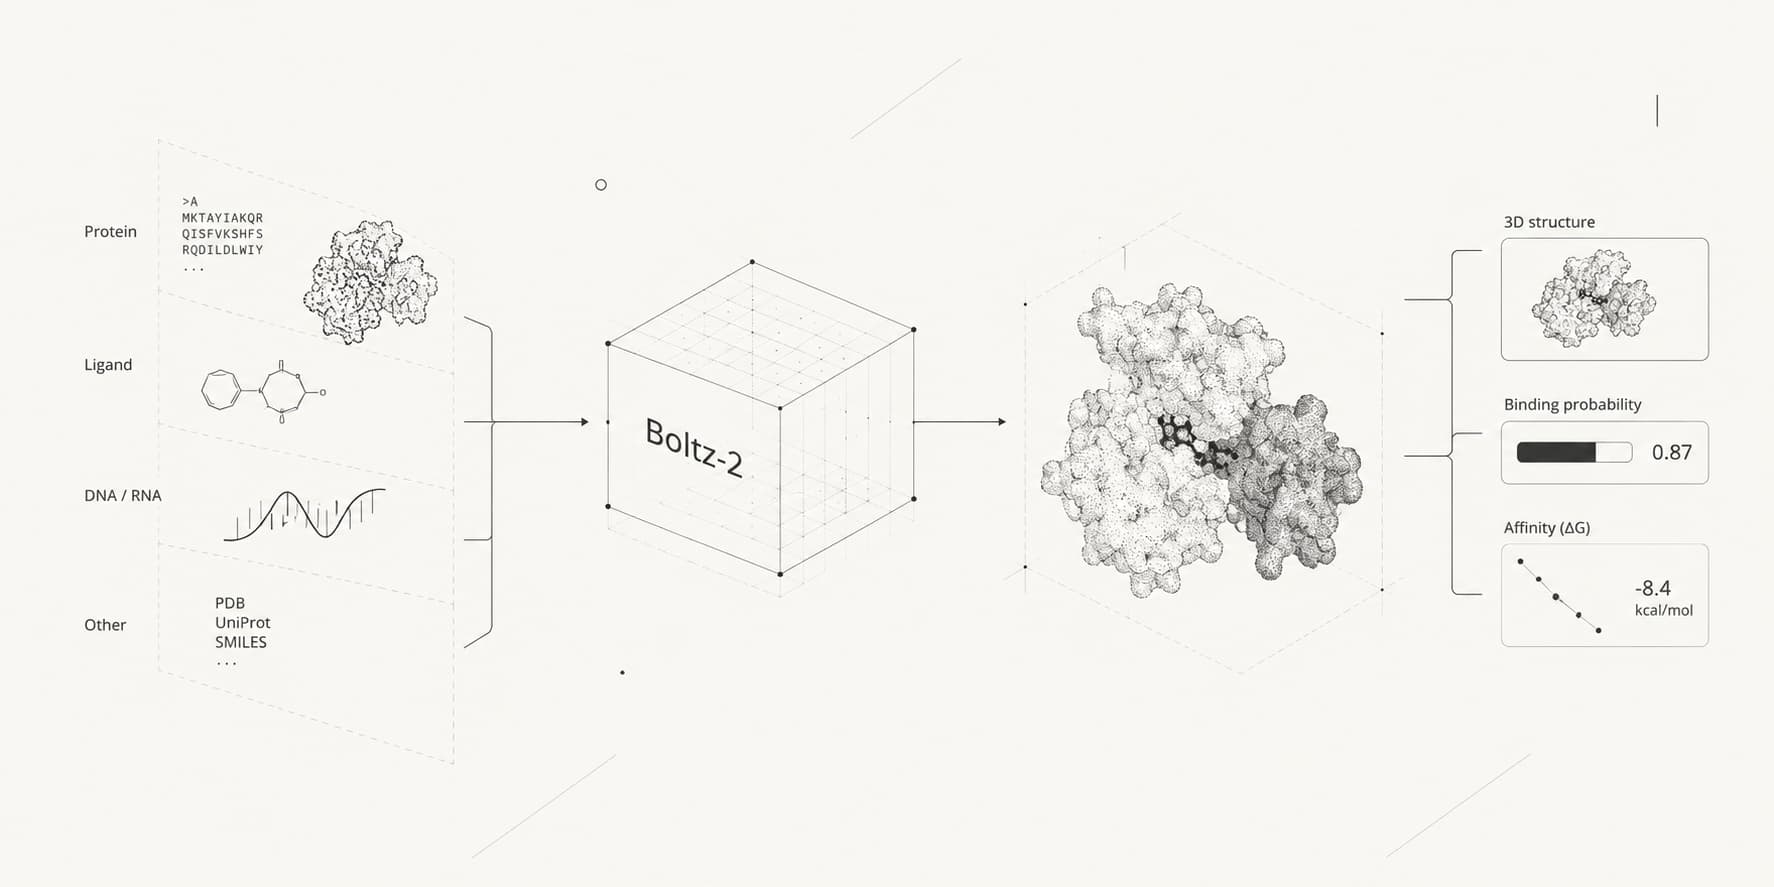
When a predicted model from AlphaFold2, ESMFold or Boltz-2 can be checked against an experimental structure, TM-score is the better headline number because flexible termini and loops do not dominate it. The adenylate kinase example applies here as well: a model with one domain rotated can have a large RMSD and still a TM-score near 0.7. Report RMSD as well, but over a defined region such as the structured core, and say how many residues it covers. For multi-domain proteins, compare domains separately.
Fold search and clustering
Foldseek finds similar structures in databases such as the AlphaFold Database and the PDB, and its pairwise and clustering modes report TM-score and lDDT. Foldseek reaches 88% of the sensitivity of TM-align while running four to five orders of magnitude faster.[22] When clustering, a TM-score threshold of 0.5 groups structures with the same fold. A higher threshold, such as 0.7 or 0.8, groups closer variants.
Molecular dynamics and ensembles
In a simulation every frame contains the same atoms in the same order, so RMSD is the natural measure and the size problem disappears. A backbone RMSD that rises and then plateaus usually means the structure has relaxed from its starting coordinates and is now fluctuating around a stable state. MD Trajectory Analysis plots RMSD over time from a GROMACS or OpenMM run, and pyRMSD builds an all-against-all RMSD matrix that reveals clusters of conformations. If one floppy tail dominates the curve, align on the core and measure it separately, as in the adenylate kinase example.
Ligand docking
Small-molecule docking uses RMSD almost exclusively, and the conventional success criterion is a ligand pose within 2 Å of the crystal pose. The ligand RMSD is measured in the frame of the receptor, without superimposing the ligand itself, so it captures both the ligand's shape and where it sits in the pocket. Symmetric groups such as a phenyl ring or a carboxylate must be matched symmetry-aware, or a correctly placed ligand can look wrong.
RMSD alone is not enough here either. The PoseBusters authors found that AI docking methods often produced poses near the crystal ligand that were still physically implausible, with distorted bonds, wrong stereochemistry or clashes with the protein.[24] PoseBusters checks both the 2 Å criterion and physical validity. Note that the RMSD columns in AutoDock Vina output and the minimized RMSD in GNINA measure distance from another docked pose or from the pre-minimization pose. They are not accuracy against an experimental structure.
Protein complexes
For protein-protein docking or predicted complexes, neither global RMSD nor global TM-score isolates the interface. DockQ combines three measures into one score from 0 to 1: the fraction of native interface contacts, the ligand RMSD of the smaller partner after superimposing the larger one, and the interface RMSD over residues at the interface.[23] Models above 0.23 are acceptable, above 0.49 medium quality and above 0.80 high quality. US-align's oligomer mode reports a TM-score for whole complexes after matching chains.[4]
Protein design
Design pipelines use RMSD as a self-consistency test. A backbone is generated with a tool such as RFdiffusion, a sequence is designed for it with ProteinMPNN, and the sequence is folded again with a structure predictor. The RFdiffusion authors counted a design as an in silico success when the predicted structure was within 2 Å backbone RMSD of the design, had a mean pAE below 5, and reproduced any scaffolded functional site within 1 Å.[25] BoltzGen applies a refolding RMSD filter of 2.0 Å for peptides and 2.5 Å for other designs by default, and BindCraft filters on the RMSD of the binder predicted alone against the designed binder.
pTM and ipTM are predicted TM-scores
Structure predictors cannot compute a true TM-score because no experimental structure exists at prediction time. AlphaFold2 instead predicts the TM-score its model would get, and reports it as pTM.[21] ipTM applies the same idea to the arrangement of chains in a complex. Both run from 0 to 1 and inherit the same meaning, so a pTM above 0.5 suggests the overall fold is likely right. AlphaFold2, Boltz-2 and OpenFold3 all report pTM and ipTM, and BindCraft rejects binder designs below a pTM of 0.55 by default.
These are confidence estimates, not measurements. The per-residue counterpart is pLDDT, which predicts the local lDDT score. Interface scores such as ipTM can be skewed by disordered regions outside the interface, which is the problem ipSAE was developed to address.
Other structure similarity scores
| Score | Range | What it measures | Where you see it |
|---|---|---|---|
| GDT_TS | 0 to 100 | Average percentage of residues within 1, 2, 4 and 8 Å after superposition[19] | CASP assessment |
| lDDT | 0 to 1 or 0 to 100 | Preserved local distances, without a global superposition[20] | CASP, Foldseek, pLDDT |
| DockQ | 0 to 1 | Interface quality of a docked complex[23] | Protein docking benchmarks |
| RMSD100 | Ångströms | RMSD rescaled to a 100-residue protein[7] | Comparing RMSD across sizes |
GDT_TS behaves much like TM-score but uses fixed distance cutoffs. lDDT is the best choice when domains move, because it never superimposes the whole structure at once. In the calmodulin example, where both lobes are nearly identical but rearranged, a superposition-free score avoids the problem that one rigid fit cannot match both lobes.
Reporting a structure comparison
A single number without context is hard to reuse. A comparison that someone else can interpret states:
- which atoms were compared (Cα, backbone or all heavy atoms)
- how residues were paired (by number, by sequence alignment or by structural alignment)
- how many residues or atoms contributed, out of how many
- which structure the TM-score is normalized by
- whether a superposition was applied, and on which region
Frequently asked questions
Is a lower RMSD always better?
For the same pair of proteins compared the same way, yes. Across different proteins or different atom selections, no. A 2 Å RMSD is a close match for a 300-residue protein and a loose one for a 40-residue peptide, and an RMSD over half the residues says nothing about the other half.
What is a good TM-score?
Above 0.5 means the same fold, and above about 0.8 means a very close match. Below 0.17 is what unrelated proteins score by chance.[2][8]
What RMSD counts as similar?
There is no universal cutoff for proteins, because the meaning of an RMSD depends on length, atom selection and coverage. As a sense of scale from the examples above, the same protein solved twice differs by 0.52 Å, and two globins with 27% sequence identity differ by 1.48 Å over 141 residues. For designs refolded by a structure predictor, 2 Å backbone RMSD is a common success threshold, and for docked ligands 2 Å is the standard threshold.[25][24]
Why does US-align report a smaller RMSD than the RMSD Calculator?
US-align reports RMSD only over the residues in its structural alignment, which leaves out the regions that do not superimpose. The RMSD Calculator includes every matched residue. In the adenylate kinase example, the two values are 3.57 Å over 179 residues and 7.13 Å over all 214.
Can I convert RMSD to TM-score?
Not in general. TM-score depends on how the deviations are distributed and on how many residues were aligned. Only in the idealized case where every residue deviates by the same amount does one determine the other, as in Figure 1.
Should I use TM-score for small molecules?
No. TM-score is defined for chains of residues or nucleotides. Ligand poses are judged by RMSD, ideally symmetry-corrected, together with physical checks such as those in PoseBusters.