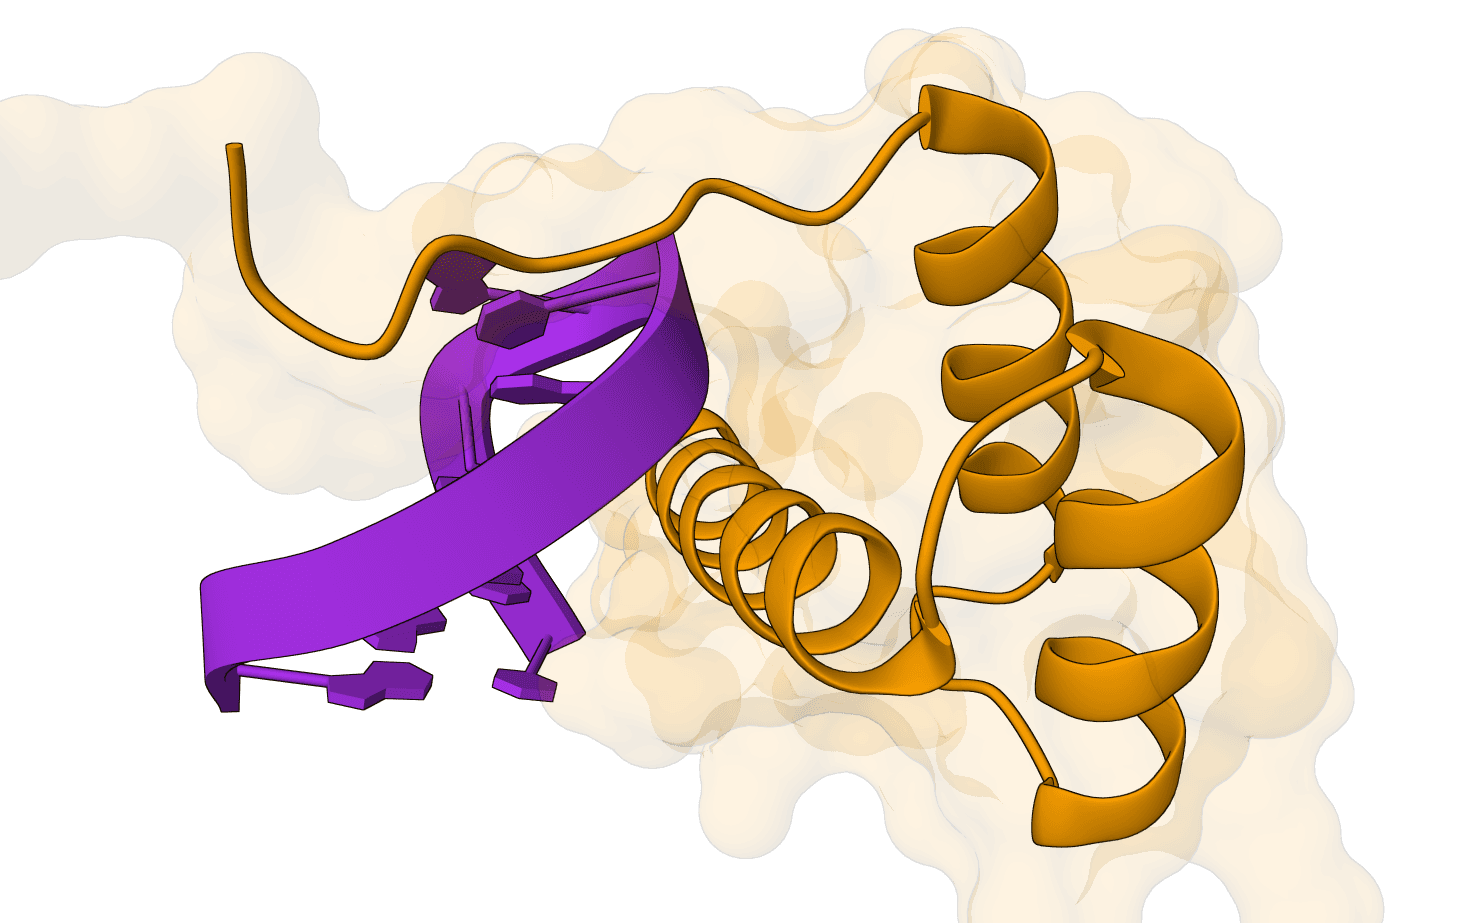
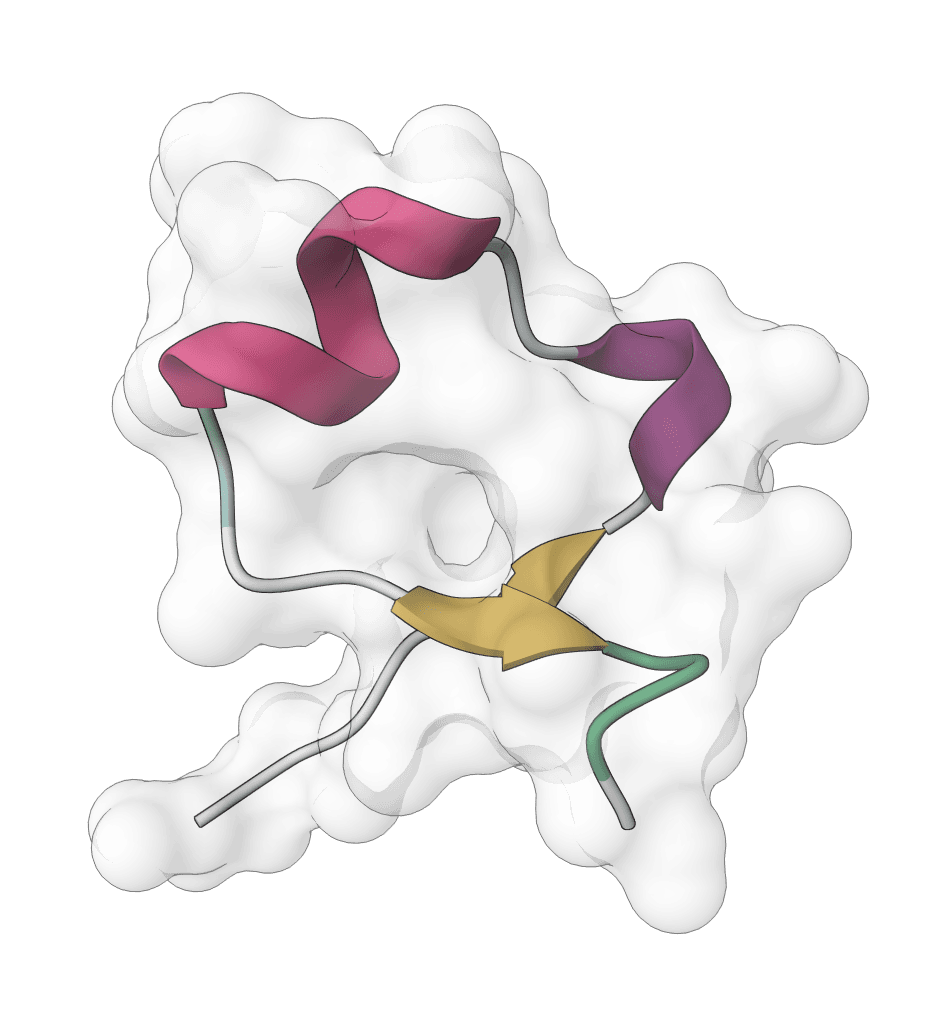
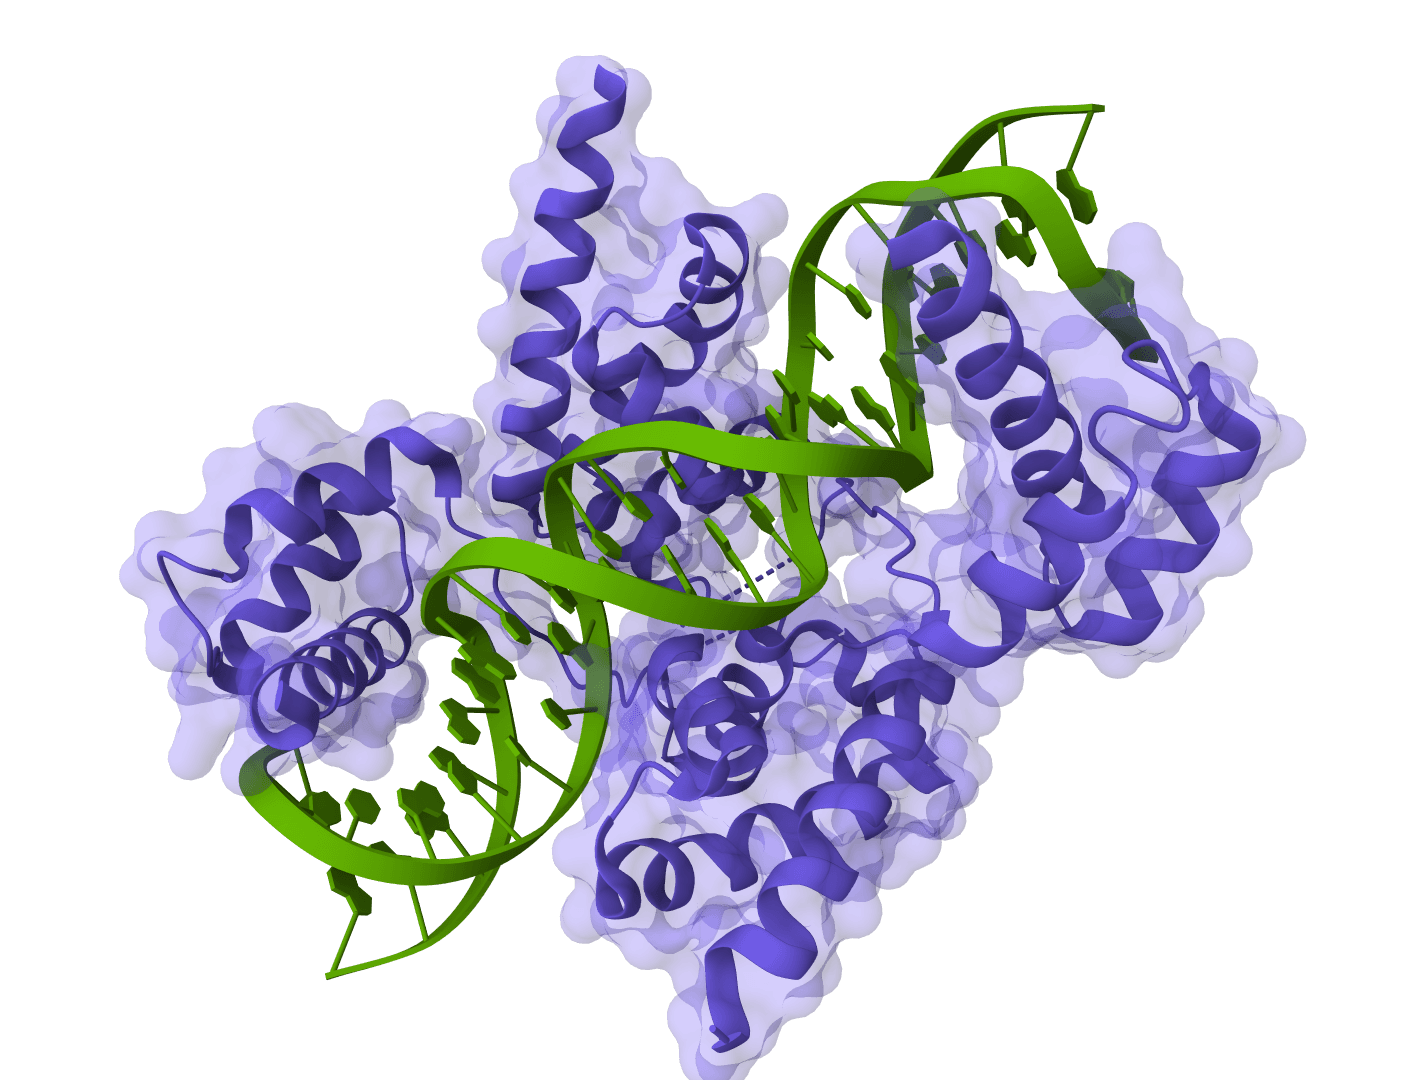
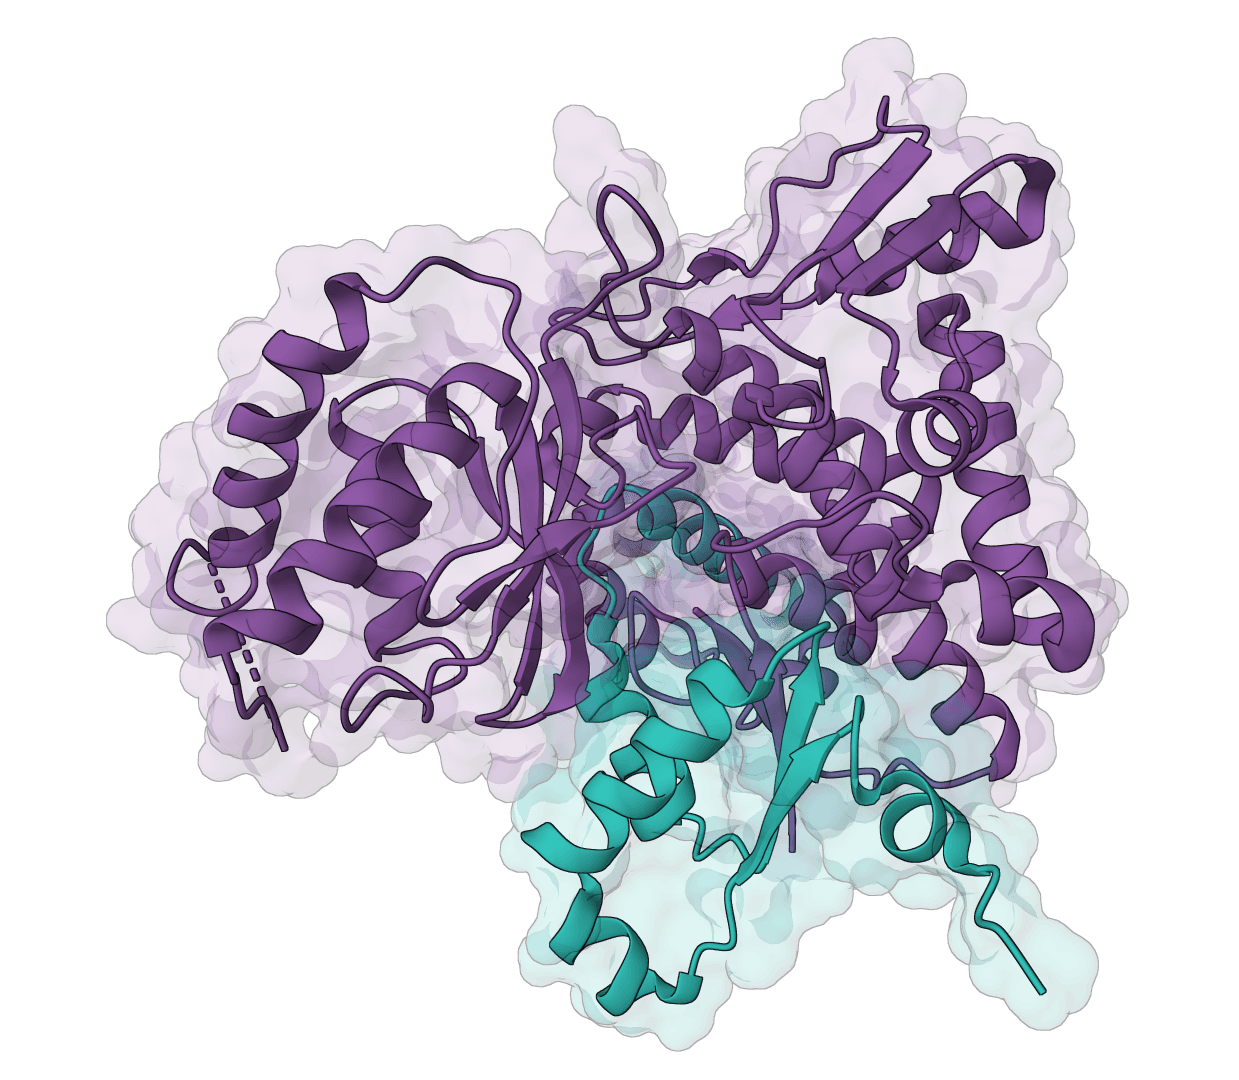
OpenFold-3 is an open-source reproduction of DeepMind's AlphaFold3, developed by the AlQuraishi Lab at Columbia University and the OpenFold Consortium. It predicts 3D structures of biomolecular complexes including proteins, DNA, RNA, and small molecule ligands.
A key advantage is its Apache 2.0 license. Unlike AlphaFold3, which restricts commercial use, OpenFold-3 is fully open for both academic and industry applications. The model was trained on over 300,000 experimentally determined structures plus 13 million synthetic structures curated by OpenFold.
OpenFold-3 achieves competitive accuracy with AlphaFold3, reaching parity on protein-nucleic acid benchmarks and monomeric RNA structures. For related tools, see Boltz-2 for binding affinity predictions, Chai-1 for general multi-modal prediction, ESMFold for fast single-sequence predictions, and Protenix for another AlphaFold3 reproduction.
OpenFold-3 replicates the AlphaFold3 architecture, which represents a fundamental shift from AlphaFold2. Rather than predicting backbone frames and torsion angles, it operates directly on raw atom coordinates using a diffusion-based generative approach.
The model learns to reverse a diffusion process that gradually corrupts molecular structures with noise. During training, the network sees atomic coordinates at various noise levels, learning local stereochemistry from low-noise examples and large-scale structure from high-noise examples.
During inference, the model starts from random atomic coordinates and iteratively denoises them through multiple steps to produce a coherent 3D structure. This generative approach allows OpenFold-3 to capture conformational diversity and handle multi-component complexes naturally.
OpenFold-3 uses a Pairformer module instead of AlphaFold2's Evoformer. The Pairformer operates only on pair and single representations; the MSA representation is not retained through the main network. This 48-block module simplifies the architecture while maintaining accuracy.
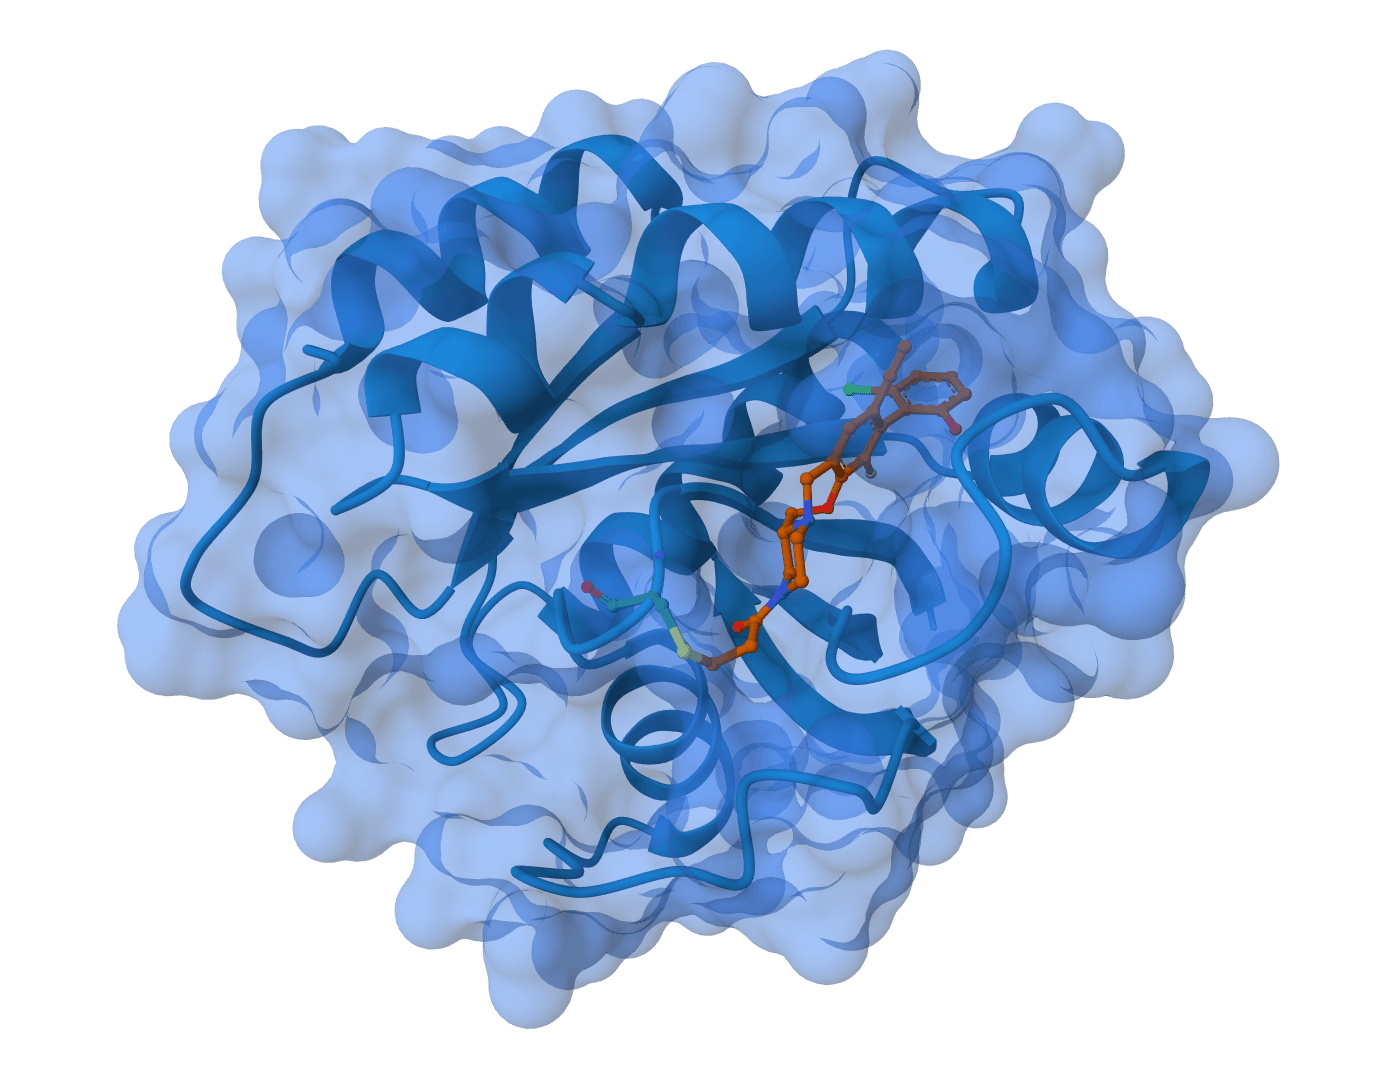
The pair representation captures relationships between all pairs of atoms or residues in the system. This is where inter-molecular interactions (such as protein-ligand contacts or protein-protein interfaces) are learned and refined.
MSA provides evolutionary information by aligning your target sequence against thousands of homologous sequences from other organisms. Coevolution patterns reveal which residues are spatially close in 3D: if two positions consistently mutate together across evolution, they're likely in contact.
OpenFold-3 uses a simplified MSA module with just four blocks, processing alignments through pair-weighted averaging. The ColabFold server handles MSA generation automatically, searching sequence databases to find homologs.
MSA substantially improves prediction accuracy for natural proteins but adds 2-5 minutes to runtime. For synthetic or designed proteins lacking natural homologs, you can disable MSA to speed up predictions.
Diffusion models can sometimes "hallucinate" compact structures for regions that should be disordered. OpenFold-3 addresses this through cross-distillation, where training data includes predictions from AlphaFold-Multimer. This teaches the model to represent unstructured regions as extended loops rather than inventing false structure.
OpenFold-3 accepts multiple molecule types that you can combine into a single prediction job. Chain IDs (A, B, C...) are assigned automatically and displayed in the UI.
ZN (zinc), MG (magnesium), CA (calcium), FE (iron).CIF (recommended for full metadata) or PDB (legacy compatibility).OpenFold-3 returns multiple ranked predictions, each with a structure file and associated confidence metrics. Higher confidence generally indicates more reliable predictions, though even low-confidence regions may be structurally meaningful.
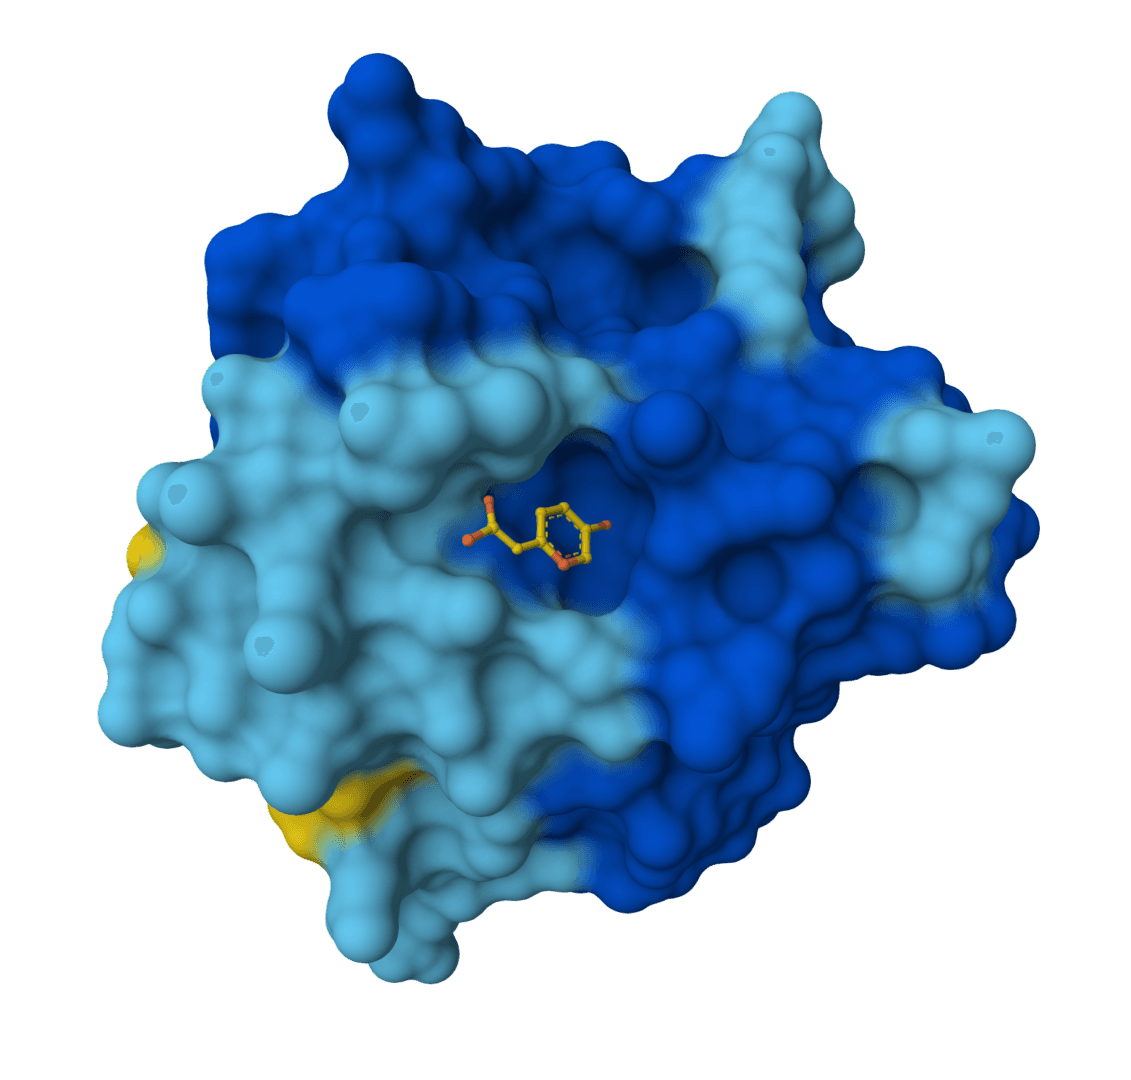
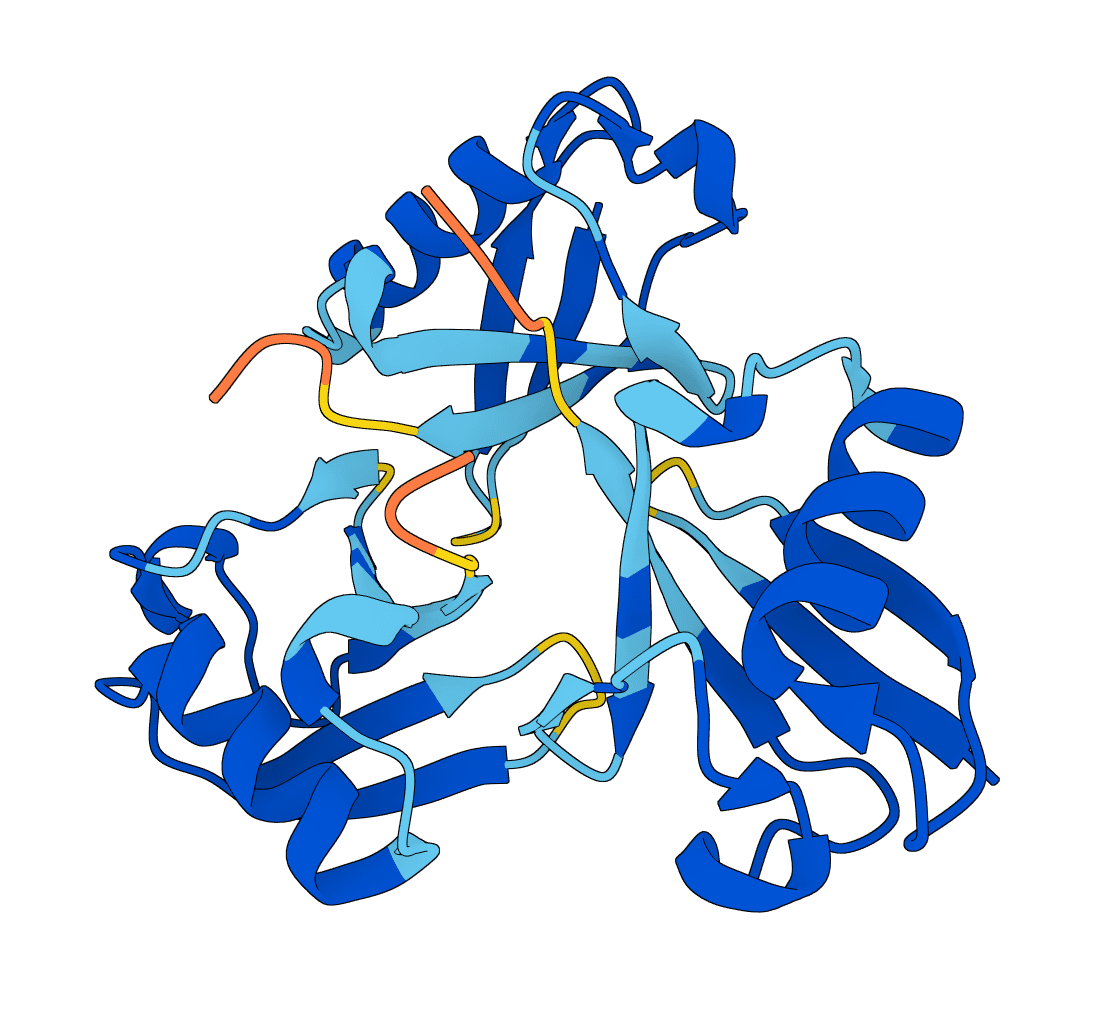
This per-residue confidence metric indicates how accurately each position is predicted. Values range from 0 to 100.
| pLDDT | Confidence | Interpretation |
|---|---|---|
| > 90 | Very high | Backbone and sidechain positions reliable |
| 70-90 | High | Backbone prediction accurate |
| 50-70 | Moderate | Treat with caution, consider alternatives |
| < 50 | Low | Likely disordered or prediction uncertain |
Regions with pLDDT below 50 often represent intrinsically disordered regions rather than prediction failures. These regions may only adopt defined structures when bound to interaction partners.
This score estimates overall structural accuracy, correlating with the TM-score you would obtain by comparing the prediction to the true structure. Values range from 0 to 1, with higher values indicating better global accuracy.
For single-chain proteins, pTM above 0.7 indicates a confident prediction. For multi-chain complexes, also consider ipTM.
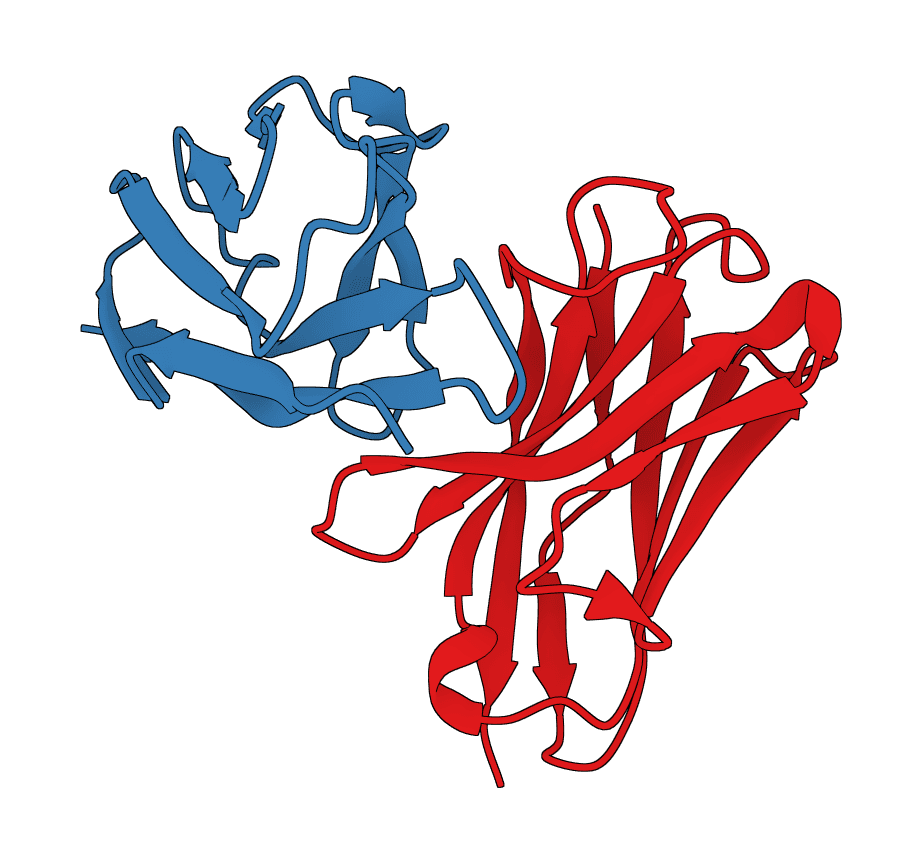
This metric specifically evaluates the quality of inter-chain interfaces in multi-component complexes. It correlates strongly with interface accuracy across different molecule types: protein-protein, protein-nucleic acid, and protein-ligand.
Higher ipTM values indicate more reliable interface predictions. When predicting complexes, prioritize structures with high ipTM scores.
Each prediction produces a structure file (CIF or PDB) containing atomic coordinates for all modeled molecules. The B-factor column contains per-residue pLDDT scores, which most molecular visualization tools can display as a color gradient. View your results in PDB Viewer or download for use in other software.
Enable MSA for natural proteins. The evolutionary information from MSA substantially improves prediction accuracy. Only disable it when working with designed proteins that lack natural homologs.
Use multiple seeds for important predictions. Running with 2-3 seeds helps assess prediction confidence. If structures from different seeds are similar, the prediction is likely reliable. Substantial differences indicate uncertainty.
Increase diffusion samples for flexible systems. Complexes with flexible binding modes or intrinsically disordered regions benefit from more diffusion samples to explore conformational space.
Check your SMILES stereochemistry. Ligand binding is stereospecific. Ensure your SMILES strings correctly represent the enantiomer you intend to model. An incorrect stereocenter will produce misleading results.
| Use case | Seeds | Diffusion samples | MSA | Notes |
|---|---|---|---|---|
| Quick screening | 1 | 3-5 | Off | Fast, lower accuracy |
| Standard prediction | 1 | 5 | On | Good balance for most cases |
| High-confidence | 2-3 | 5-10 | On | Use for important targets |
| Conformational diversity | 3-5 | 10 | On | Explores structural space |
Examine multiple predictions. Don't rely solely on the top-ranked structure. Comparing the top 2-3 predictions reveals which features are consistently predicted versus variable.
Check confidence metrics together. A structure with high pLDDT but low ipTM may have accurate individual chains but an unreliable interface. Consider all metrics when evaluating complex predictions.
Low confidence doesn't always mean wrong. Intrinsically disordered regions will show low pLDDT regardless of prediction quality. Cross-reference with known biology to interpret these regions.
| Feature | OpenFold-3 | Boltz-2 | Chai-1 | ESMFold |
|---|---|---|---|---|
| Proteins | Yes | Yes | Yes | Yes |
| Ligands | Yes | Yes | Yes | No |
| DNA/RNA | Yes | Yes | Yes | No |
| MSA support | Yes | Yes | Yes | No |
| Affinity prediction | No | Yes | No | No |
| Speed | Moderate | Moderate | Moderate | Very fast |
| License | Apache 2.0 | Apache 2.0 | Academic | MIT |
OpenFold-3 is a preview release, and the model is under active development. While it achieves strong benchmark performance, some edge cases may not be as well-handled as the proprietary AlphaFold3.
The model works best for well-folded proteins with evolutionary signatures. Predictions for intrinsically disordered proteins, membrane proteins, or sequences with unusual amino acid compositions may be less reliable.
For protein-ligand affinity prediction, OpenFold-3 does not provide binding strength estimates. Use Boltz-2 if you need quantitative affinity predictions.
Chai-1 is a multi-modal foundation model for molecular structure prediction. Predicts 3D structures for proteins, ligands, DNA, RNA, and multi-component complexes with high accuracy.
Controllable biomolecular structure prediction model for proteins, ligands, DNA, RNA, and multi-component complexes. IntelliFold 2 supports fast v2-Flash inference, optional MSA generation, and ranked confidence outputs.
Enhanced Protenix v2 biomolecular structure prediction by ByteDance. Predicts 3D structures for proteins, RNA, DNA, and small molecule ligands with high accuracy.
Open-source structure prediction neural network for proteins, nucleic acids, and small molecules. State-of-the-art accuracy with multi-chain support.
Boltz-2 is a biomolecular foundation model for structure and binding affinity prediction. Supports proteins, ligands, DNA, and RNA in multi-component complexes. Automatically scales GPU resources for large complexes. Predicts binding affinity with near-FEP accuracy at 1000x faster speed.
LMI4Boltz is a low-memory fork of Boltz for biomolecular structure and binding affinity prediction. It preserves Boltz inference behavior while reducing VRAM use with in-place pair updates, CPU offload, reduced precision pair representation, and aggressive chunking.
ABodyBuilder3 predicts antibody variable-domain structures from paired heavy and light chain sequences. It returns a PDB structure and, for the pLDDT checkpoint, per-residue confidence values.
Generate protein conformational ensembles with ESMFlow, the single-sequence AlphaFlow model family. Produces multiple diverse structures showing protein flexibility and dynamics.
AlphaFold2 via ColabFold for protein structure prediction. Free runs use single-sequence mode; paid plans add MMseqs2 MSA generation. Supports monomer and multimer prediction.
ESMfold is a fast, single-sequence protein structure predictor from Meta AI. Predicts 3D protein structures directly from amino acid sequences without requiring multiple sequence alignments (MSA), making it significantly faster than AlphaFold while automatically scaling GPU resources for larger proteins.
OpenFold-3 is an open-source reproduction of DeepMind's AlphaFold3, developed by the AlQuraishi Lab at Columbia University and the OpenFold Consortium. It predicts 3D structures of biomolecular complexes including proteins, DNA, RNA, and small molecule ligands.
A key advantage is its Apache 2.0 license. Unlike AlphaFold3, which restricts commercial use, OpenFold-3 is fully open for both academic and industry applications. The model was trained on over 300,000 experimentally determined structures plus 13 million synthetic structures curated by OpenFold.
OpenFold-3 achieves competitive accuracy with AlphaFold3, reaching parity on protein-nucleic acid benchmarks and monomeric RNA structures. For related tools, see Boltz-2 for binding affinity predictions, Chai-1 for general multi-modal prediction, ESMFold for fast single-sequence predictions, and Protenix for another AlphaFold3 reproduction.
OpenFold-3 replicates the AlphaFold3 architecture, which represents a fundamental shift from AlphaFold2. Rather than predicting backbone frames and torsion angles, it operates directly on raw atom coordinates using a diffusion-based generative approach.
The model learns to reverse a diffusion process that gradually corrupts molecular structures with noise. During training, the network sees atomic coordinates at various noise levels, learning local stereochemistry from low-noise examples and large-scale structure from high-noise examples.
During inference, the model starts from random atomic coordinates and iteratively denoises them through multiple steps to produce a coherent 3D structure. This generative approach allows OpenFold-3 to capture conformational diversity and handle multi-component complexes naturally.
OpenFold-3 uses a Pairformer module instead of AlphaFold2's Evoformer. The Pairformer operates only on pair and single representations; the MSA representation is not retained through the main network. This 48-block module simplifies the architecture while maintaining accuracy.
The pair representation captures relationships between all pairs of atoms or residues in the system. This is where inter-molecular interactions (such as protein-ligand contacts or protein-protein interfaces) are learned and refined.
MSA provides evolutionary information by aligning your target sequence against thousands of homologous sequences from other organisms. Coevolution patterns reveal which residues are spatially close in 3D: if two positions consistently mutate together across evolution, they're likely in contact.
OpenFold-3 uses a simplified MSA module with just four blocks, processing alignments through pair-weighted averaging. The ColabFold server handles MSA generation automatically, searching sequence databases to find homologs.
MSA substantially improves prediction accuracy for natural proteins but adds 2-5 minutes to runtime. For synthetic or designed proteins lacking natural homologs, you can disable MSA to speed up predictions.
Diffusion models can sometimes "hallucinate" compact structures for regions that should be disordered. OpenFold-3 addresses this through cross-distillation, where training data includes predictions from AlphaFold-Multimer. This teaches the model to represent unstructured regions as extended loops rather than inventing false structure.
OpenFold-3 accepts multiple molecule types that you can combine into a single prediction job. Chain IDs (A, B, C...) are assigned automatically and displayed in the UI.
ZN (zinc), MG (magnesium), CA (calcium), FE (iron).CIF (recommended for full metadata) or PDB (legacy compatibility).OpenFold-3 returns multiple ranked predictions, each with a structure file and associated confidence metrics. Higher confidence generally indicates more reliable predictions, though even low-confidence regions may be structurally meaningful.
This per-residue confidence metric indicates how accurately each position is predicted. Values range from 0 to 100.
| pLDDT | Confidence | Interpretation |
|---|---|---|
| > 90 | Very high | Backbone and sidechain positions reliable |
| 70-90 | High | Backbone prediction accurate |
| 50-70 | Moderate | Treat with caution, consider alternatives |
| < 50 | Low | Likely disordered or prediction uncertain |
Regions with pLDDT below 50 often represent intrinsically disordered regions rather than prediction failures. These regions may only adopt defined structures when bound to interaction partners.
This score estimates overall structural accuracy, correlating with the TM-score you would obtain by comparing the prediction to the true structure. Values range from 0 to 1, with higher values indicating better global accuracy.
For single-chain proteins, pTM above 0.7 indicates a confident prediction. For multi-chain complexes, also consider ipTM.
This metric specifically evaluates the quality of inter-chain interfaces in multi-component complexes. It correlates strongly with interface accuracy across different molecule types: protein-protein, protein-nucleic acid, and protein-ligand.
Higher ipTM values indicate more reliable interface predictions. When predicting complexes, prioritize structures with high ipTM scores.
Each prediction produces a structure file (CIF or PDB) containing atomic coordinates for all modeled molecules. The B-factor column contains per-residue pLDDT scores, which most molecular visualization tools can display as a color gradient. View your results in PDB Viewer or download for use in other software.
Enable MSA for natural proteins. The evolutionary information from MSA substantially improves prediction accuracy. Only disable it when working with designed proteins that lack natural homologs.
Use multiple seeds for important predictions. Running with 2-3 seeds helps assess prediction confidence. If structures from different seeds are similar, the prediction is likely reliable. Substantial differences indicate uncertainty.
Increase diffusion samples for flexible systems. Complexes with flexible binding modes or intrinsically disordered regions benefit from more diffusion samples to explore conformational space.
Check your SMILES stereochemistry. Ligand binding is stereospecific. Ensure your SMILES strings correctly represent the enantiomer you intend to model. An incorrect stereocenter will produce misleading results.
| Use case | Seeds | Diffusion samples | MSA | Notes |
|---|---|---|---|---|
| Quick screening | 1 | 3-5 | Off | Fast, lower accuracy |
| Standard prediction | 1 | 5 | On | Good balance for most cases |
| High-confidence | 2-3 | 5-10 | On | Use for important targets |
| Conformational diversity | 3-5 | 10 | On | Explores structural space |
Examine multiple predictions. Don't rely solely on the top-ranked structure. Comparing the top 2-3 predictions reveals which features are consistently predicted versus variable.
Check confidence metrics together. A structure with high pLDDT but low ipTM may have accurate individual chains but an unreliable interface. Consider all metrics when evaluating complex predictions.
Low confidence doesn't always mean wrong. Intrinsically disordered regions will show low pLDDT regardless of prediction quality. Cross-reference with known biology to interpret these regions.
| Feature | OpenFold-3 | Boltz-2 | Chai-1 | ESMFold |
|---|---|---|---|---|
| Proteins | Yes | Yes | Yes | Yes |
| Ligands | Yes | Yes | Yes | No |
| DNA/RNA | Yes | Yes | Yes | No |
| MSA support | Yes | Yes | Yes | No |
| Affinity prediction | No | Yes | No | No |
| Speed | Moderate | Moderate | Moderate | Very fast |
| License | Apache 2.0 | Apache 2.0 | Academic | MIT |
OpenFold-3 is a preview release, and the model is under active development. While it achieves strong benchmark performance, some edge cases may not be as well-handled as the proprietary AlphaFold3.
The model works best for well-folded proteins with evolutionary signatures. Predictions for intrinsically disordered proteins, membrane proteins, or sequences with unusual amino acid compositions may be less reliable.
For protein-ligand affinity prediction, OpenFold-3 does not provide binding strength estimates. Use Boltz-2 if you need quantitative affinity predictions.
Chai-1 is a multi-modal foundation model for molecular structure prediction. Predicts 3D structures for proteins, ligands, DNA, RNA, and multi-component complexes with high accuracy.
Controllable biomolecular structure prediction model for proteins, ligands, DNA, RNA, and multi-component complexes. IntelliFold 2 supports fast v2-Flash inference, optional MSA generation, and ranked confidence outputs.
Enhanced Protenix v2 biomolecular structure prediction by ByteDance. Predicts 3D structures for proteins, RNA, DNA, and small molecule ligands with high accuracy.
Open-source structure prediction neural network for proteins, nucleic acids, and small molecules. State-of-the-art accuracy with multi-chain support.
Boltz-2 is a biomolecular foundation model for structure and binding affinity prediction. Supports proteins, ligands, DNA, and RNA in multi-component complexes. Automatically scales GPU resources for large complexes. Predicts binding affinity with near-FEP accuracy at 1000x faster speed.
LMI4Boltz is a low-memory fork of Boltz for biomolecular structure and binding affinity prediction. It preserves Boltz inference behavior while reducing VRAM use with in-place pair updates, CPU offload, reduced precision pair representation, and aggressive chunking.
ABodyBuilder3 predicts antibody variable-domain structures from paired heavy and light chain sequences. It returns a PDB structure and, for the pLDDT checkpoint, per-residue confidence values.
Generate protein conformational ensembles with ESMFlow, the single-sequence AlphaFlow model family. Produces multiple diverse structures showing protein flexibility and dynamics.
AlphaFold2 via ColabFold for protein structure prediction. Free runs use single-sequence mode; paid plans add MMseqs2 MSA generation. Supports monomer and multimer prediction.
ESMfold is a fast, single-sequence protein structure predictor from Meta AI. Predicts 3D protein structures directly from amino acid sequences without requiring multiple sequence alignments (MSA), making it significantly faster than AlphaFold while automatically scaling GPU resources for larger proteins.