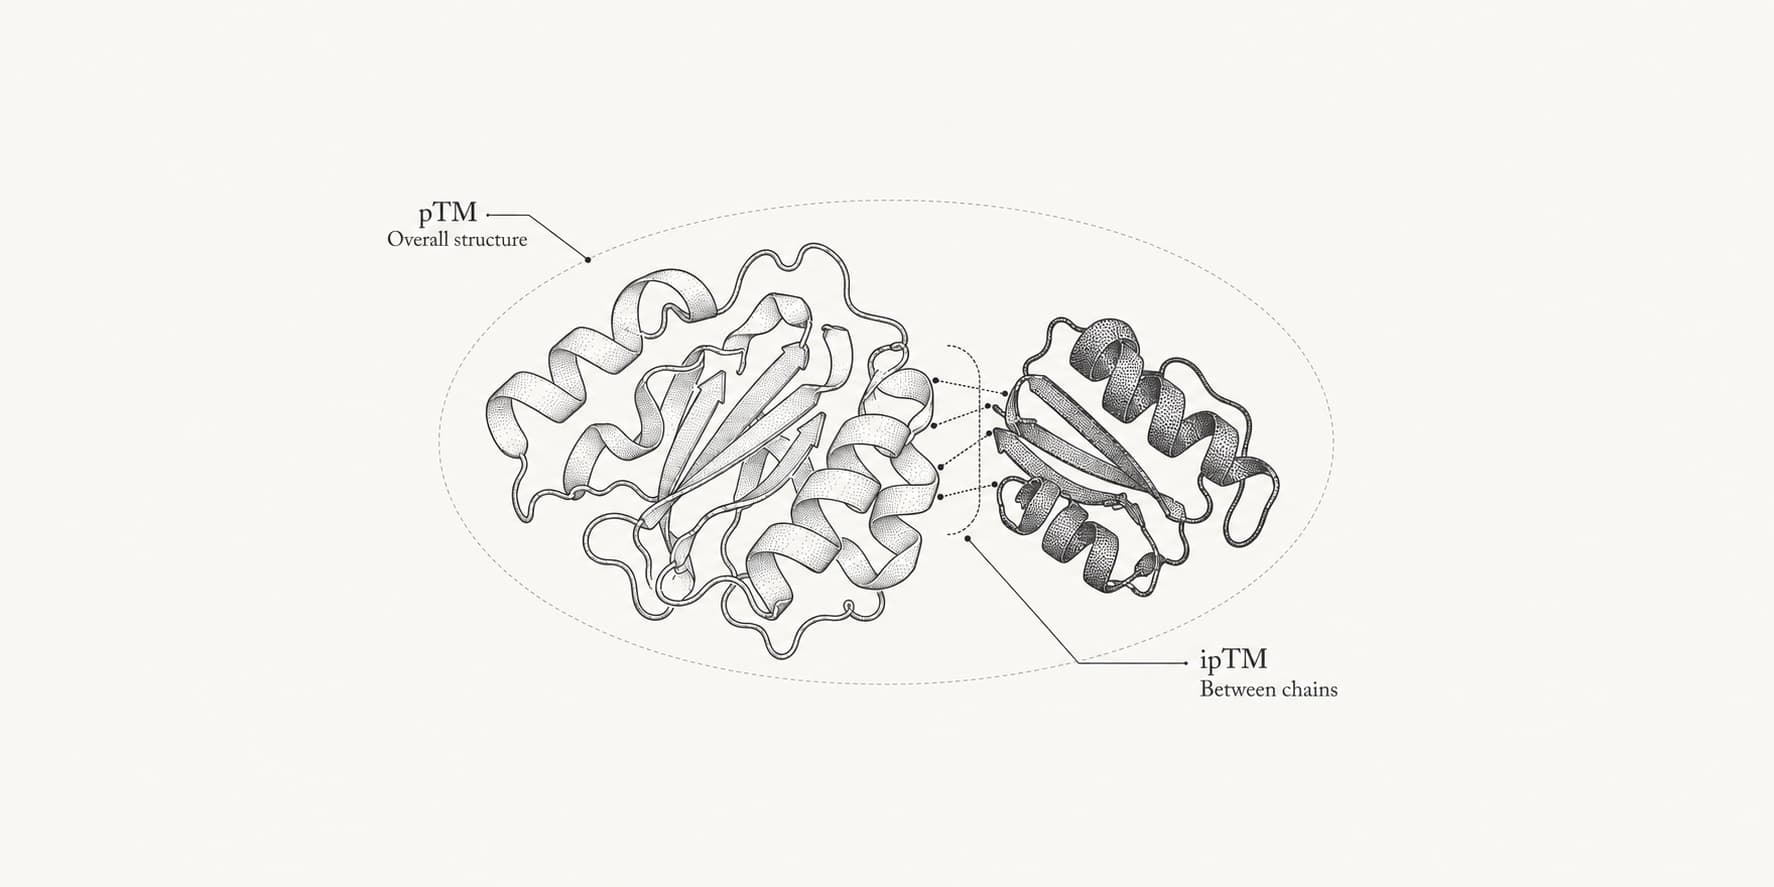
pTM and ipTM are two confidence scores, each between 0 and 1, that structure predictors attach to a whole model. pTM (predicted TM-score) is the model's estimate of how well the entire structure would superimpose on the true one. ipTM (interface pTM) is the same estimate counted only across pairs of residues in different chains, so it asks whether the chains are placed correctly relative to each other. For a single protein, read pTM. For a complex, read ipTM first, because a model can fold every chain correctly and still dock them in the wrong place.[1][4]
The usual reading, from the AlphaFold3 team, is that ipTM above 0.8 is a confident, high-quality prediction, below 0.6 suggests the complex prediction failed, and 0.6 to 0.8 is a gray zone. A pTM above 0.5 means the overall fold might be similar to the true structure.[6] AlphaFold2 multimer models, Boltz-2, Chai-1, OpenFold3, Protenix and ESMFold2 all report both scores. They complement pLDDT, which rates each residue's local geometry and says nothing about how chains fit together.
What pTM measures
pTM is a prediction of the TM-score, a number for comparing a model with a reference structure. After the two are superimposed, every residue contributes between 0 and 1 depending on how far it sits from its true position, and the contributions are averaged over the whole length. A residue that lands exactly right adds 1, and one that is far off adds almost nothing.[2] A TM-score above 0.5 generally means two structures share the same fold, and unrelated structures score around 0.17.[3]
What counts as "far off" depends on the size of the structure. The TM-score scales distances by d0 = 1.24 × (L − 15)^1/3 − 1.8 Å, where L is the number of residues, so an error of a few ångströms is forgiven in a large protein and punished in a small one.[2] The table below shows how much one residue adds to the score for a given positional error.
| Structure size | d0 | 1 Å error | 2 Å | 4 Å | 8 Å | 16 Å |
|---|---|---|---|---|---|---|
| 100 residues | 3.65 Å | 0.93 | 0.77 | 0.45 | 0.17 | 0.05 |
| 300 residues | 6.36 Å | 0.98 | 0.91 | 0.72 | 0.39 | 0.14 |
| 1,000 residues | 10.54 Å | 0.99 | 0.97 | 0.87 | 0.63 | 0.30 |
Each value is 1 / (1 + (error / d0)²), calculated from the TM-score definition. A 4 Å error costs a residue more than half its credit in a 100-residue protein but only about an eighth in a 1,000-residue complex.
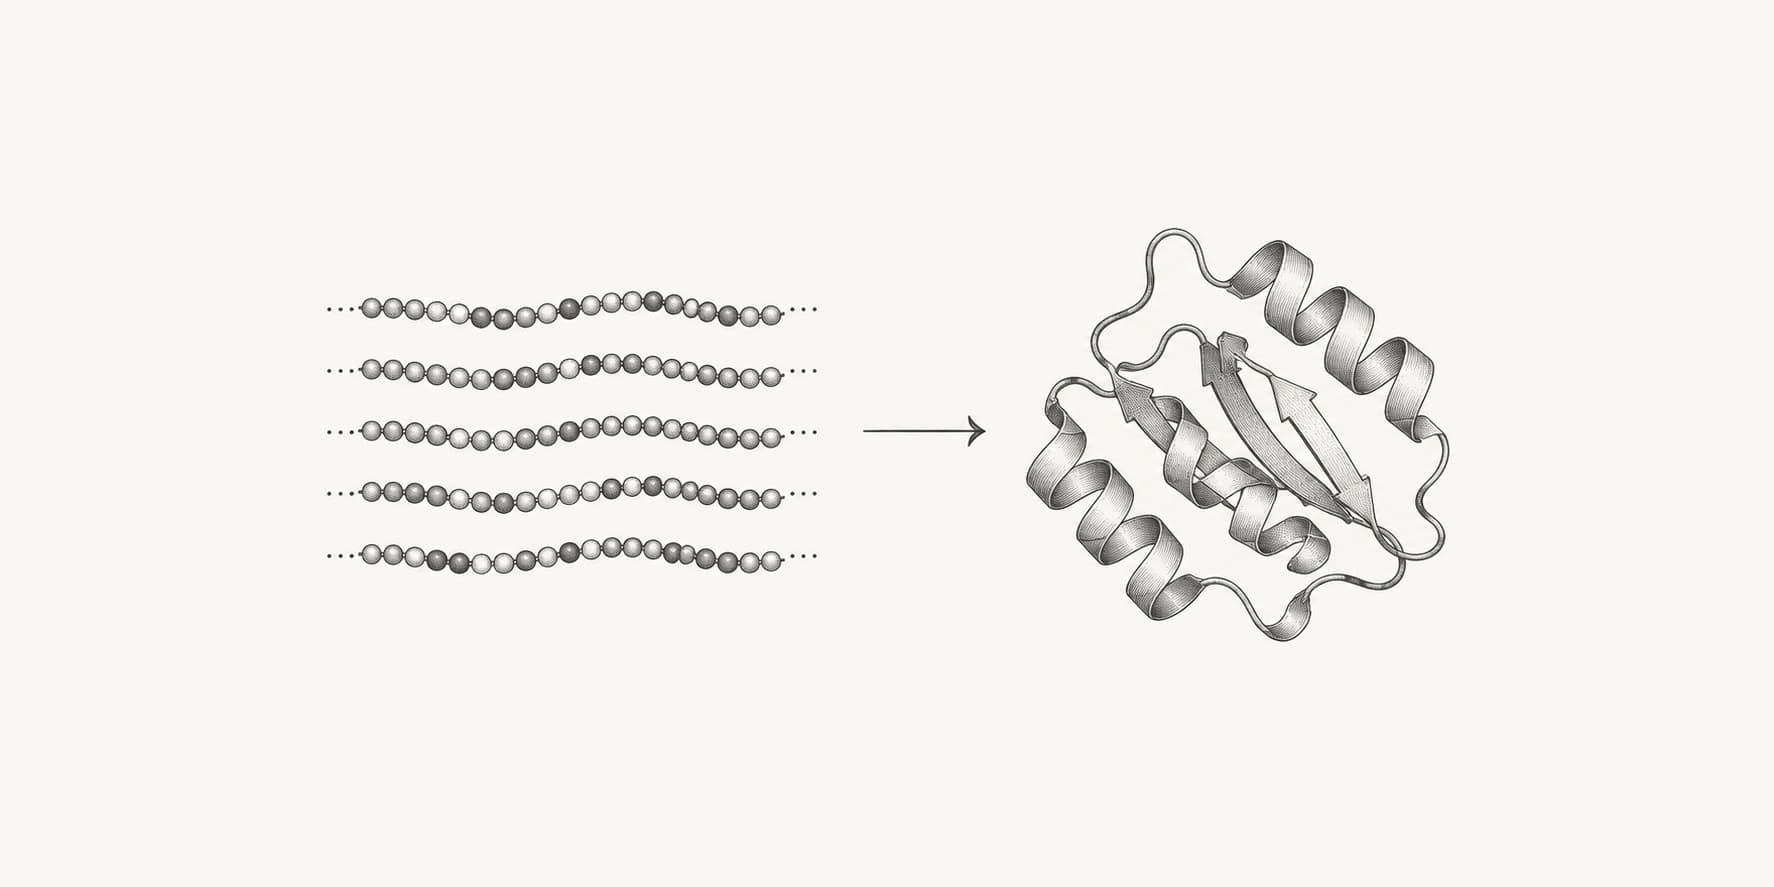
AlphaFold2 cannot compare against a true structure at prediction time, so it estimates the TM-score from its predicted aligned error (PAE). PAE is the expected error in a residue's position after the model is aligned on another residue. For each possible alignment residue, AlphaFold2 averages the expected TM contribution over every residue in the structure, then reports the best of those averages as pTM.[1] That last step matters later: pTM and ipTM both take a maximum over alignment frames, which is why they reward one well-predicted core even if other parts are uncertain.
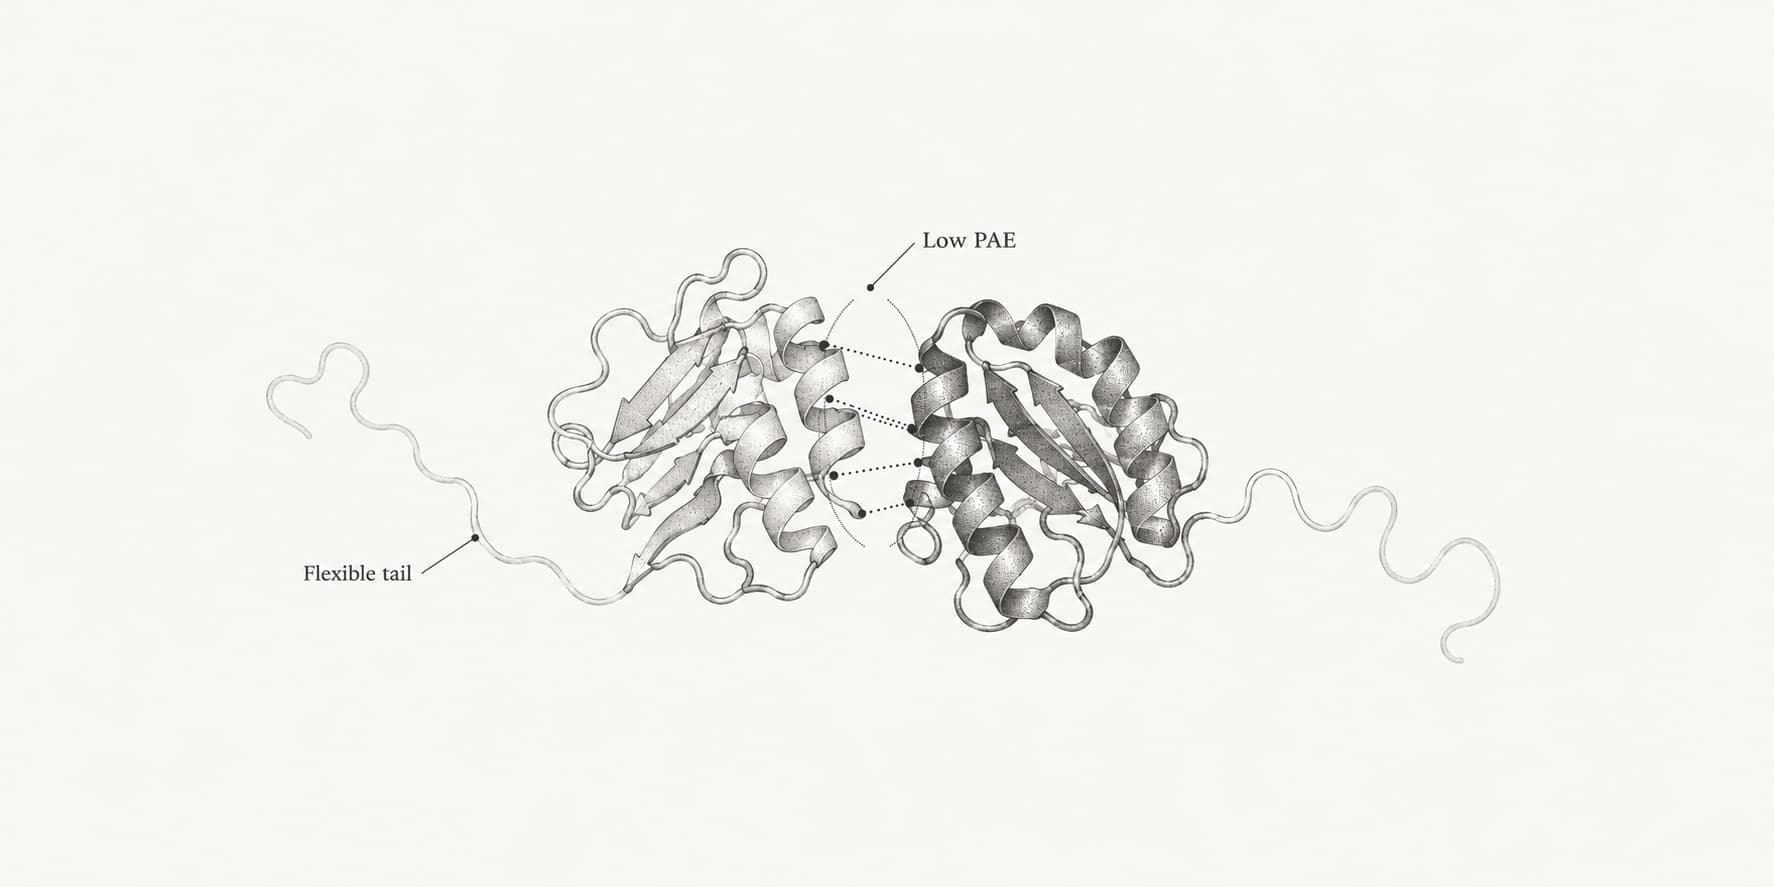
Because pTM is global, it drops when parts of a correct model move relative to each other. A two-domain protein joined by a flexible linker can have both domains at pLDDT above 90 and still have a modest pTM, because the model is unsure how the domains are oriented.
What ipTM adds for complexes
AlphaFold-Multimer introduced ipTM by changing one thing in the pTM calculation: when the model aligns on a residue in one chain, it only scores residues in the other chains.[4] Contacts inside a chain no longer count, so the score reflects whether the chains are docked correctly. In AlphaFold2 and AlphaFold3, d0 for ipTM is computed from the summed length of all chains in the model, not from the size of the interface.[8]
The two scores disagree in informative ways. In a complex dominated by one large chain, most residue pairs are within that chain, so pTM can stay high while ipTM is low. That pattern usually means each chain is folded but the model does not know how they fit together.
| pTM | ipTM | Typical reading |
|---|---|---|
| High | High | Chains folded and placed confidently; inspect the interface before relying on contacts |
| High | Low | Chains folded but the arrangement is a guess; do not use the interface |
| Low | High | Interface confident, but flexible domains or disordered tails lower the global score |
| Low | Low | Neither the fold nor the docking is reliable; check inputs, MSA depth and chain definitions |
AlphaFold-Multimer ranks its models by 0.8 × ipTM + 0.2 × pTM, weighting the interface four times as heavily as the global fold.[4] AlphaFold3 adds terms for disorder and clashes, ranking by 0.8 × ipTM + 0.2 × pTM + 0.5 × disorder − 100 × has_clash.[6] Boltz uses a different blend, 0.8 × complex pLDDT + 0.2 × ipTM, falling back to pTM for single chains.[10] These ranking scores are for choosing between samples of one job. They are not probabilities that the complex is correct.
For assemblies with three or more chains, a single ipTM hides which interface is uncertain. AlphaFold3 reports a chain-pair ipTM matrix, and Boltz writes the same information as pair_chains_iptm.[6][10] A trimer with one confident and one wrong interface can have a middling overall ipTM; the pairwise values show which pair to distrust.
What counts as a good ipTM or pTM
| Score | Value | Reading |
|---|---|---|
| ipTM | Above 0.8 | Confident, high-quality complex prediction |
| ipTM | 0.6 to 0.8 | Gray zone; could be right or wrong, so check PAE and alternative models |
| ipTM | Below 0.6 | Likely a failed complex prediction, unless disordered regions are pulling it down |
| pTM | Above 0.5 | Overall fold might be similar to the true structure |
| pTM | Below 0.5 | Global arrangement uncertain; inspect pLDDT and PAE before discarding the model |
The ipTM and pTM bands come from the AlphaFold3 documentation.[6] The pTM cutoff mirrors the TM-score result that 0.5 separates shared folds from unrelated ones.[3] EMBL-EBI adds a caveat that the table cannot show: a complex with large disordered sections can be predicted correctly even with pTM below 0.5 and ipTM below 0.6.[7] The next sections explain why.
Worked example: reading two Boltz-2 complexes
The public Boltz-2 examples on ProteinIQ include a human U1A protein bound to a U1 snRNA hairpin, built from the 97-residue RNA-recognition domain and a 21-nucleotide hairpin from PDB 1URN. Its confidence summary reads:
{
  "confidence_score": 0.934,
  "ptm": 0.935,
  "iptm": 0.881,
  "complex_plddt": 0.947,
  "complex_iplddt": 0.953
}
Every number is high, and they agree. pTM of 0.935 says the overall fold is confident. ipTM of 0.881 clears the 0.8 line, so the placement of the RNA on the protein is also confident. The interface-weighted pLDDT (complex_iplddt, 0.953) is slightly higher than the whole-complex pLDDT, which means the contact residues are among the best-defined in the model. The combined score follows from the Boltz formula: 0.8 × 0.947 + 0.2 × 0.881 = 0.934.[10]
The transcription-factor dimer on a DNA duplex is a four-chain example: two copies of an 89-residue protein and two complementary 15-nucleotide DNA strands. Its top prediction has pTM 0.912 and ipTM 0.913. Here ipTM is as high as pTM even though it is computed only across chains, which is what a well-defined protein-DNA assembly should look like. The chain-pair values would still be worth checking, because a single ipTM summarizes protein-protein, protein-DNA and DNA-DNA contacts together. The Boltz-2 guide walks through both jobs and where each file appears.
A gray-zone case looks different. In a public mBER run that designed a VHH nanobody against PD-L1, the accepted design reports pLDDT 0.928, pTM 0.834 and iPTM 0.759. The nanobody and target are each folded with high confidence, but the interface sits below 0.8. The example lowered mBER's minimum iPTM from the default 0.75 to 0.50, so it would have passed either way, but by the AlphaFold3 bands this complex is a hypothesis to test, not a confident pose.
Why disordered tails lower ipTM
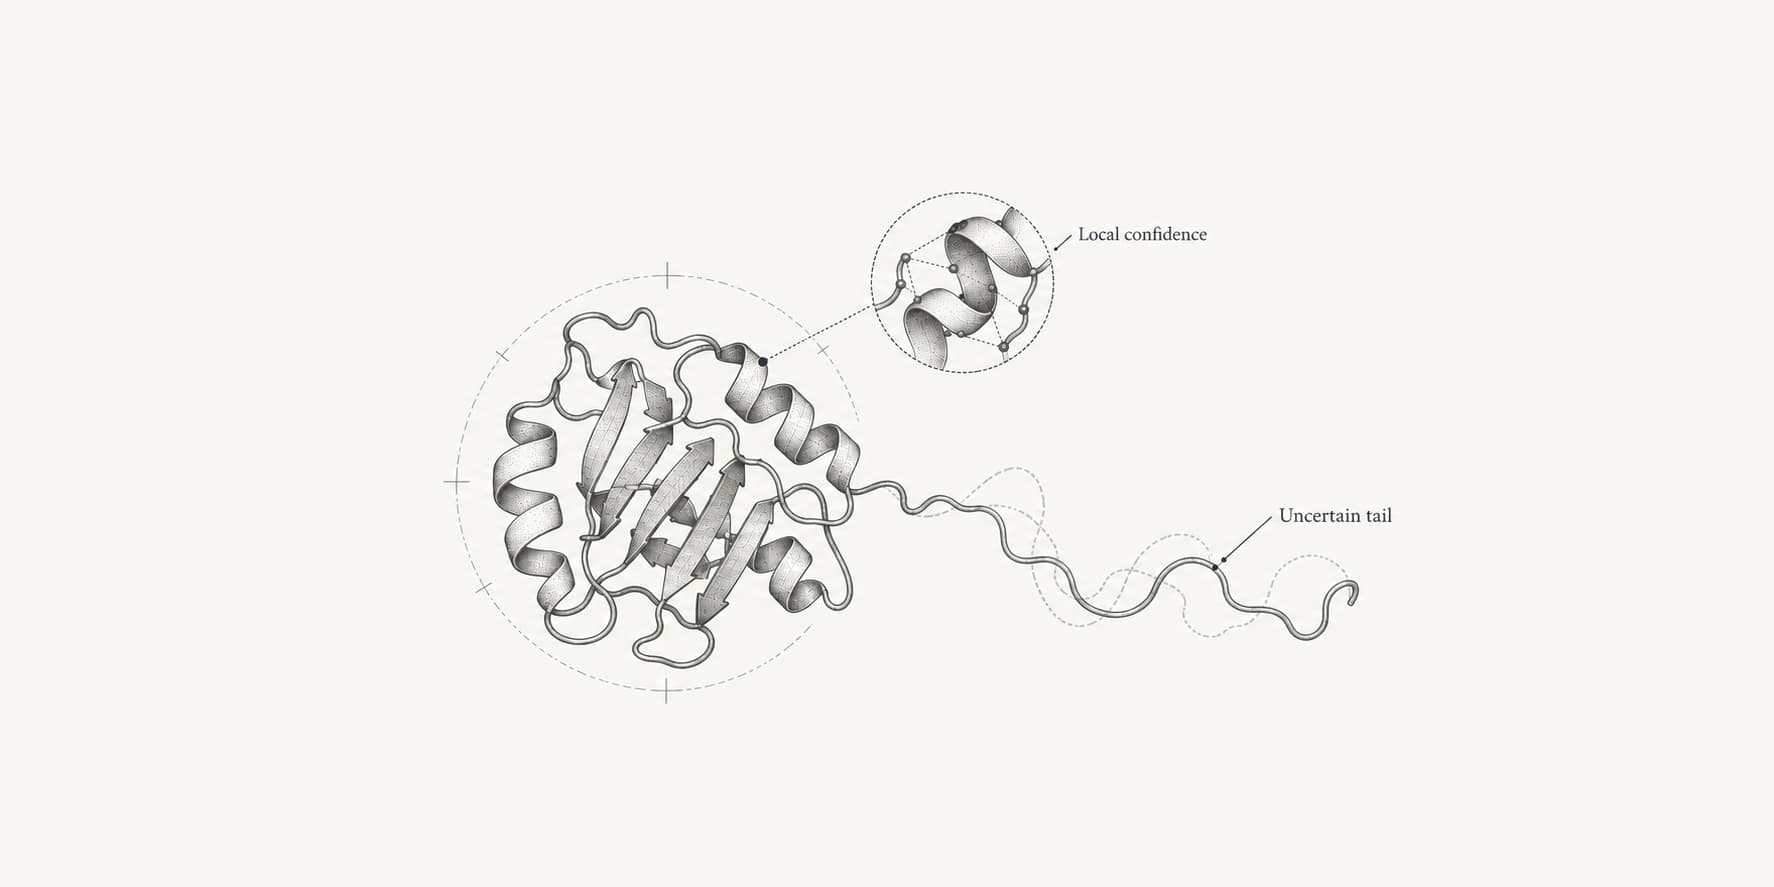
ipTM averages over every residue of the partner chains, including residues that never touch the interface. Disordered tails and accessory domains have high PAE to everything else, so they add near-zero terms to that average. Dunbrack showed how this plays out with the RAS-binding domain of RAF1 bound to KRAS, predicted with AlphaFold-Multimer.[8]
With only the ordered domains as input, ipTM is 0.90. Adding a disordered tail to RAF1 alone leaves it at 0.90, because ipTM takes the best alignment frame: a RAF1 interface residue still sees a fully ordered KRAS, and every KRAS residue scores well from it. Adding 120 disordered residues to both chains drops ipTM to 0.59, even though the predicted interface is the same.[8]
The arithmetic is simple. In the best frame, RAF1 residue T68 sees KRAS residues that are 59% ordered, each scoring about 0.9, and 41% disordered, each scoring about 0.2. The average is 0.59 × 0.9 + 0.41 × 0.2 ≈ 0.61, close to the 0.59 that AlphaFold reported.[8] The same interface moved from "confident" to "likely failed" without the structure changing.
Full-length sequences show the same effect. AlphaFold-Multimer placed the RAF1 and KSR1 kinase domains in a heterodimer much like the known BRAF homodimer, yet ipTM was only 0.41 because the other domains and long disordered regions of both proteins had no fixed position.[8] RIPK1, which is not known to bind RAF1, scored 0.28. Both values fall below 0.6, and ipTM alone would not separate the plausible pair from the implausible one.
Two rescoring methods address this. ipSAE, in the ipSAE tool, counts only interchain residue pairs with a good PAE and sets d0 from the number of those residues; it gives 0.80 for the padded RAF1 and KRAS model, 0.73 for RAF1 and KSR1, and 0.00 for RAF1 and RIPK1.[8] actifpTM restricts the calculation to residues the model predicts to be in contact, and AlphaFold2 on ProteinIQ calculates it when you enable the Extra pTM metrics setting.[9] On a benchmark of 40 heterodimers and 70 false pairs run with full-length UniProt sequences, true and false complexes overlapped for ipTM values between 0.3 and 0.7, and ipSAE separated them more cleanly.[8]
The practical options are to trim inputs to the interacting domains once a first full-length run shows where the contact is, to rescore the output with ipSAE, or to read the interchain blocks of the PAE matrix directly. If the PAE between the two binding domains is low and the rest is high, the interface is likely confident even when ipTM says otherwise.
Peptides, ligands and short chains
The TM-score is very strict for small structures. d0 shrinks to 0.17 Å at 19 residues, and AlphaFold3 notes that pTM falls below 0.05 when fewer than 20 tokens are involved; for these cases PAE or pLDDT are better guides.[6][8] A per-chain pTM for a 12-residue peptide is therefore close to zero whether or not the peptide is modeled well.
ipTM is less affected, because its d0 comes from the length of the whole complex. A 15-residue peptide on a 300-residue domain gets d0 of about 6.5 Å, the same as any other 315-residue model. For peptide-protein docking, read ipTM and the peptide's PAE to the receptor, and ignore the peptide's own chain pTM.
Small molecules are a different case. Boltz reports a separate ligand_iptm for protein-ligand interfaces and a protein_iptm for protein-protein ones, so a confident protein dimer does not hide an uncertain ligand pose.[10] Read ligand_iptm together with the ligand's pLDDT, and treat the pose as a starting point for protein-ligand docking checks rather than a validated binding mode.
What ipTM cannot tell you
ipTM is the model's estimate of its own docking accuracy. It is not a measured binding constant or a probability that two proteins interact in a cell. A high ipTM says the model is confident in one arrangement; it does not say the arrangement is the one that forms under your conditions, and it says nothing about affinity.
Design pipelines need particular care. BindCraft uses interface pTM as one of its optimization losses and then filters designs at i_pTM 0.5 and pTM 0.55 by default, alongside pLDDT and interface PAE filters. A score the design was optimized against is weaker evidence than the same score from an independent predictor, so many groups re-predict accepted designs with a second model, such as Boltz-2 or Chai-1, before ordering them.
When a reference structure exists, you can test ipTM instead of trusting it. DockQ compares a predicted complex with an experimental one and reports interface accuracy directly, which is the quantity ipTM is trying to predict.
Where pTM and ipTM appear on ProteinIQ
| Tool | What it reports |
|---|---|
| AlphaFold2 | pTM and, with multimer models, ipTM; optional actifpTM and chain-wise pTM; rank by either score |
| Boltz-2 | ptm, iptm, ligand_iptm, protein_iptm, per-chain pTM and chain-pair ipTM, all 0 to 1 |
| Chai-1, OpenFold3, Protenix, RoseTTAFold3, IntelliFold-2 | pTM and ipTM for multi-chain inputs, with native ranking scores and PAE |
| ESMFold2 | pTM and iPTM in the results table, with optional pair-chain iPTM and PAE files |
| AF2Dock, ColabDock | Docked complexes ranked by ipTM (AF2Dock) or with ipTM as the main ranking feature (ColabDock) |
| ipSAE | Rescores AlphaFold or Boltz output with ipSAE, ipTM, pDockQ, pDockQ2 and LIS |
| BindCraft, FreeBindCraft, mBER, BoltzGen | i_pTM or binder-target iPTM as design filters and ranking scores |
A typical check of a predicted complex on ProteinIQ runs in this order:
- Predict the complex with Boltz-2 or AlphaFold2 and generate several samples, so you can see whether the interface is consistent between them.
- Read ipTM first, then the chain-pair values for assemblies with more than two chains.
- Look at the interchain blocks of the PAE matrix to find which region the confidence comes from.
- If either partner has long disordered regions, rescore with ipSAE or rerun with the interacting domains only.
- Check pLDDT at the interface residues before using the contacts for mutation analysis or docking.
The protein complex structure prediction and protein-protein docking use cases cover choosing a method in more depth.
Frequently asked questions
What is the difference between pTM and ipTM?
pTM estimates the TM-score of the whole predicted structure, counting every residue pair. ipTM uses the same calculation but only counts pairs from different chains, so it measures whether the chains are arranged correctly rather than whether each chain is folded.[1][4]
What is a good ipTM score?
Above 0.8 is a confident complex prediction, 0.6 to 0.8 is a gray zone, and below 0.6 usually means the predicted arrangement is unreliable.[6] Values in the gray zone or below deserve a look at the PAE matrix, especially if the inputs contain disordered regions.
Why does my ipTM go up when I trim the sequence?
ipTM averages over all residues of the partner chain, including tails and domains outside the interface. When both chains carry such regions, removing them raises ipTM even though the interface itself has not changed.[8]
Why is ipTM missing or zero for my single-chain prediction?
ipTM needs at least two chains, because it only counts pairs between chains. For a monomer, read pTM and pLDDT instead.
Can ipTM tell me whether two proteins interact?
Only weakly. ipTM is calibrated to structural accuracy, not to binding in vivo, and with full-length sequences true and false pairs overlap across a wide middle range of values.[8] Scores built on interface PAE, such as ipSAE, separate them better, but experimental evidence is still needed.
Is ipTM the same in AlphaFold2, AlphaFold3 and Boltz?
The definition is the same, but each model is trained and calibrated separately, and the ranking scores built from ipTM differ between them.[4][6][10] Compare ipTM values within one model rather than across tools.