ipSAE (interaction prediction Score from Aligned Errors) is a 0 to 1 score for how confidently a structure predictor has placed two chains against each other. Roland Dunbrack introduced it in 2025 as a replacement for AlphaFold's ipTM, and it is calculated from the predicted aligned error (PAE) matrix that AlphaFold2, AlphaFold3 and Boltz-2 already write out. You can calculate it for any of those predictions with the ipSAE tool on ProteinIQ.[1]
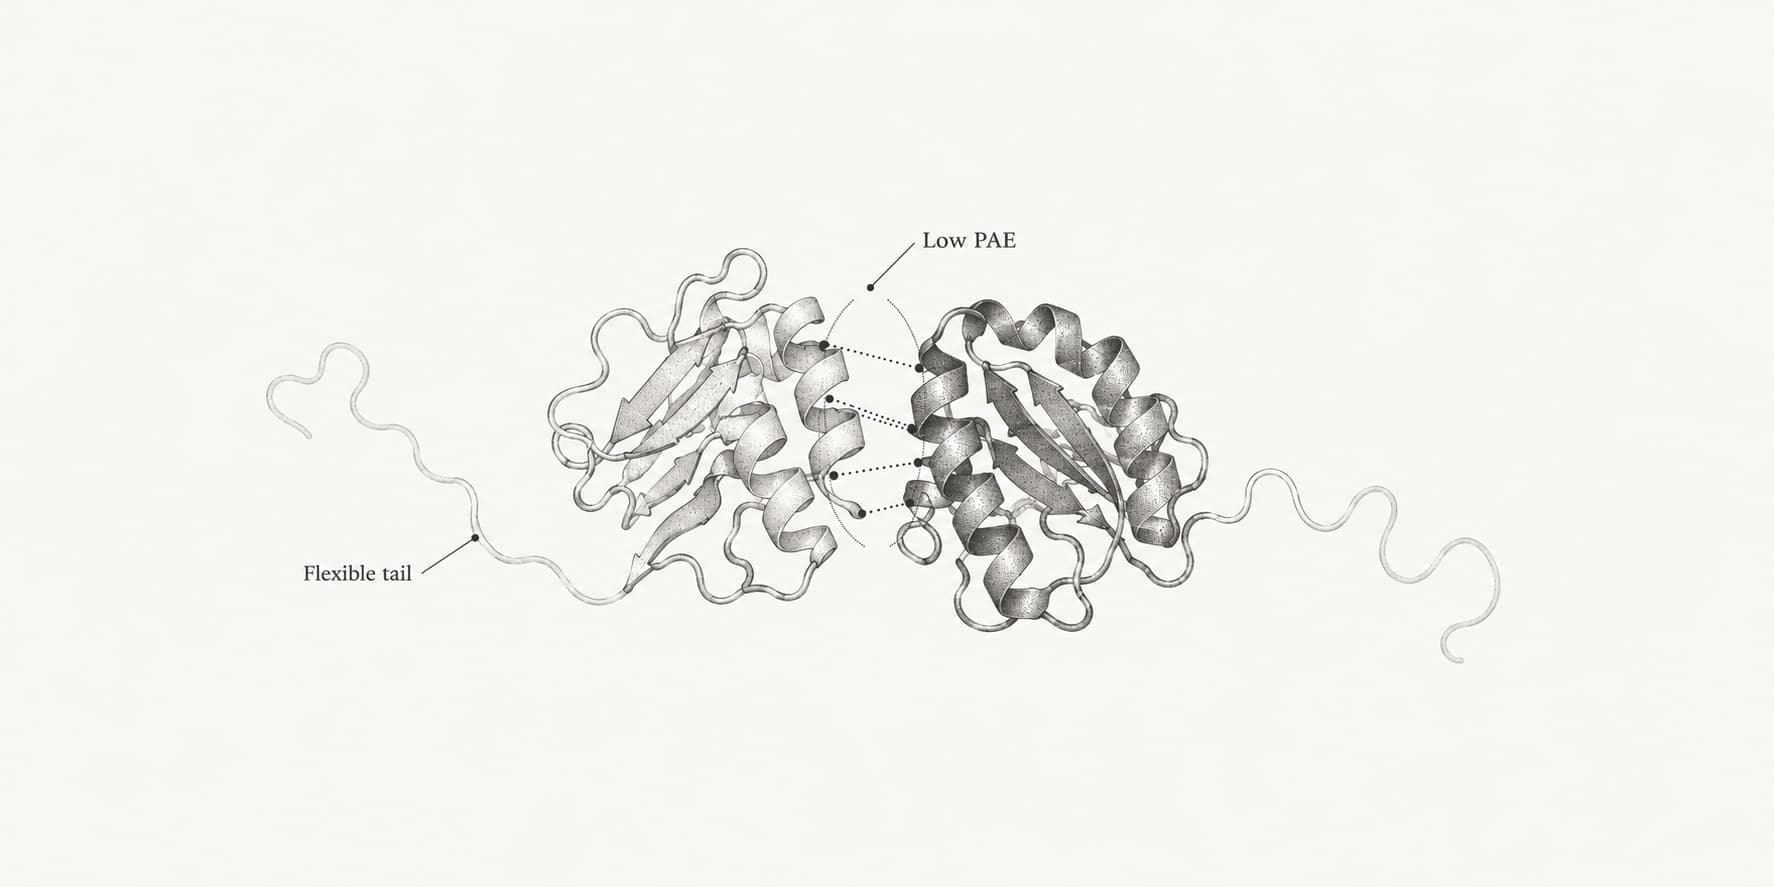
ipSAE changes three things about ipTM. It counts only residue pairs between chains whose PAE is below a cutoff, usually 10 Å. It sets the TM-score length scale from the number of residues that pass that cutoff, not from the length of the whole complex. And it uses the PAE values directly instead of AlphaFold's internal error distributions. The first change stops disordered tails and non-binding domains from dragging the score down; the second stops a handful of lucky pairs from pushing it up.[1]
AlphaFold DB reads ipSAE of 0.8 or more as a very high confidence interface, 0.7 to 0.8 as confident, 0.6 to 0.7 as low, and below 0.6 as very low.[4] In binder design, the lower of ipSAE's two directional values, called ipSAE_min, was the best single predictor of which designs bound in the lab in a meta-analysis of 3,766 tested binders.[5]
Why ipTM needed a replacement
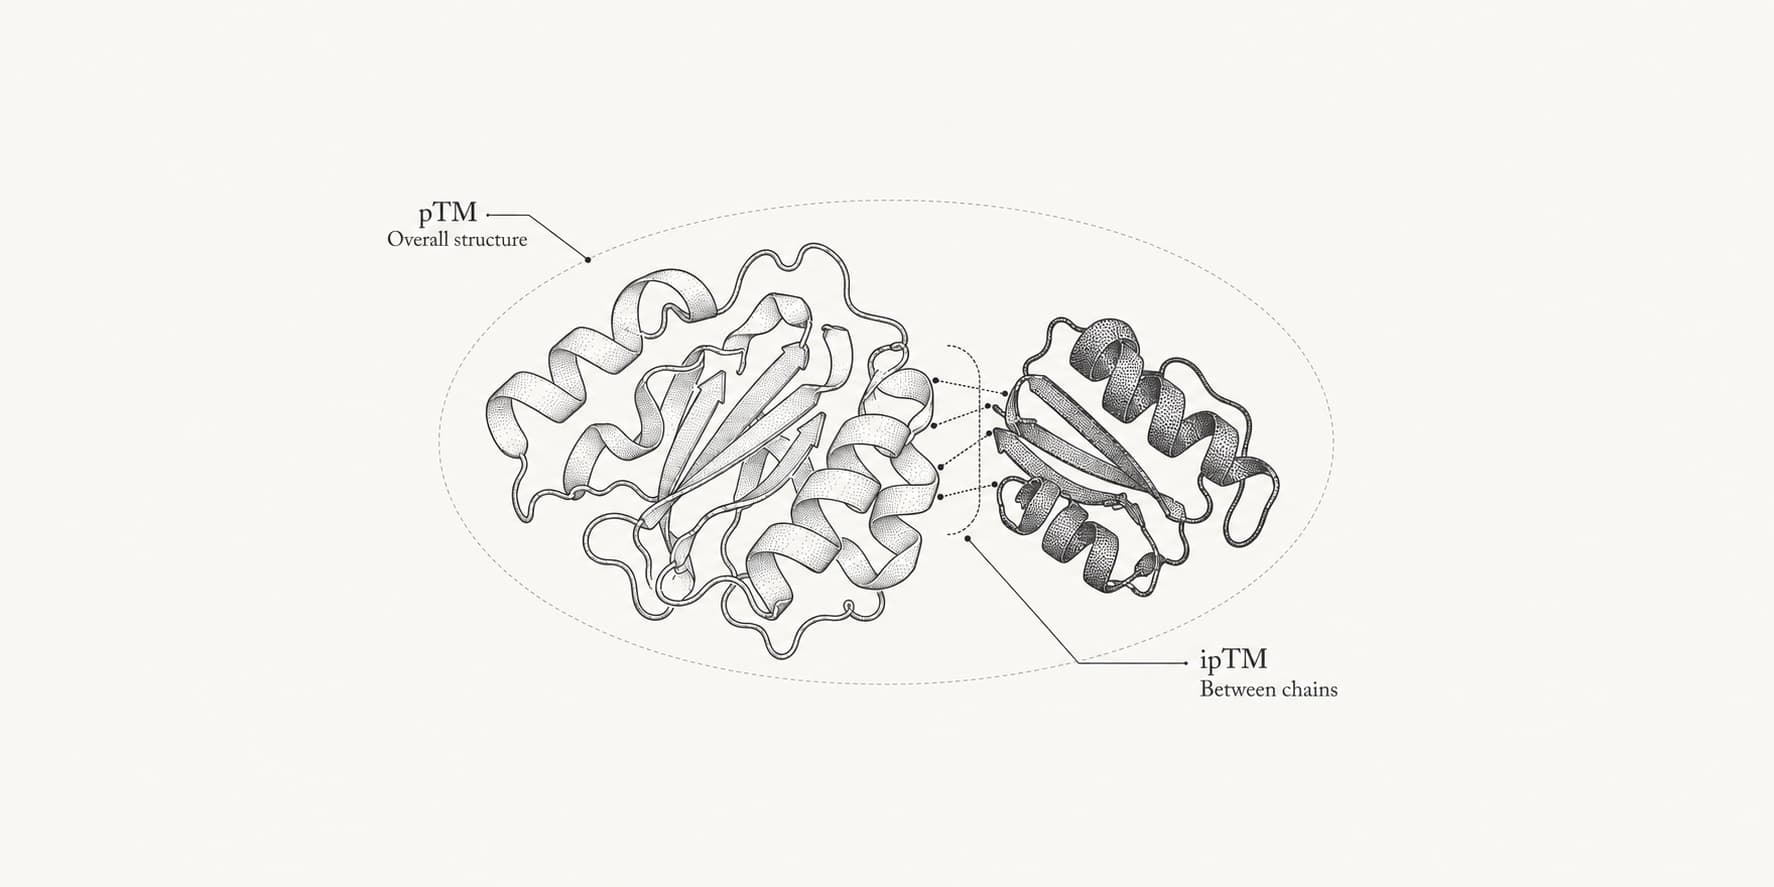
ipTM, introduced with AlphaFold-Multimer, is a predicted TM-score restricted to pairs of residues in different chains.[2] For each residue in one chain, it averages a confidence term over every residue of the partner chain, then reports the best of those averages. The ipTM vs pTM guide covers the calculation in detail.
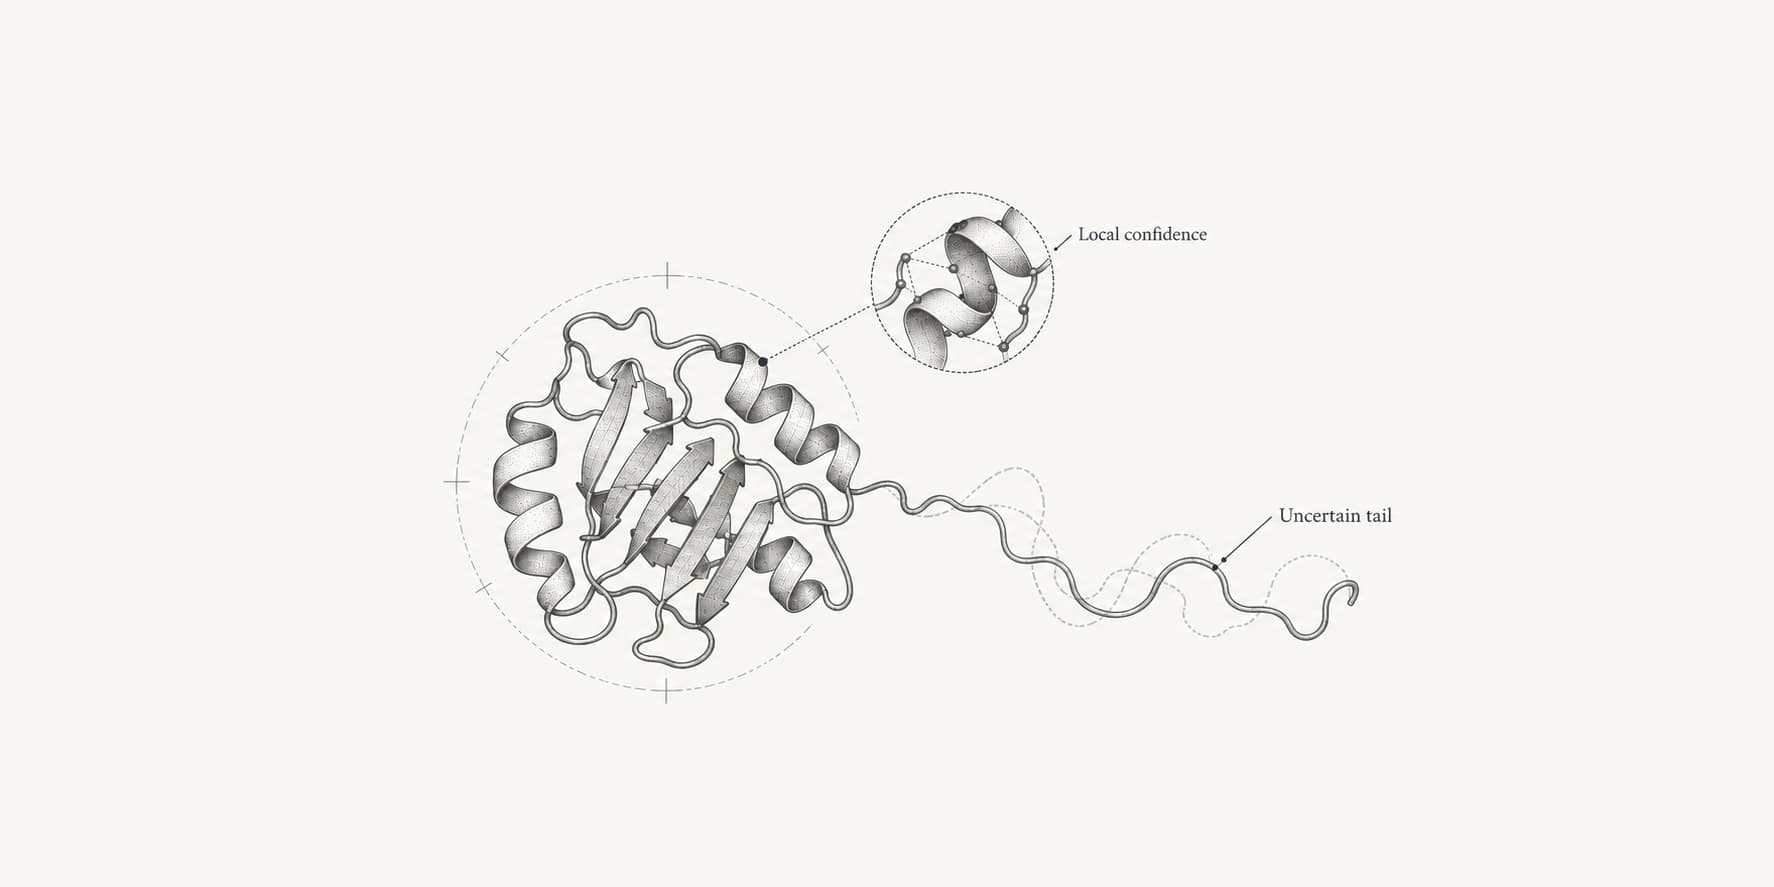
The weak point is the word "every". If the partner chain has a long disordered tail or a domain that floats free of the interface, those residues have large PAE to everything and contribute almost nothing to the average. Dunbrack showed this with the RAS-binding domain of RAF1 bound to KRAS: ipTM is 0.90 for the ordered domains alone and falls to 0.59 when 120 disordered residues are added to each chain, although the predicted interface does not change.[1]
This matters most when the interacting region is not known in advance, which is the usual situation when screening full-length UniProt sequences for interactions. In Dunbrack's benchmark of 40 recent heterodimers and 70 deliberately mismatched pairs, all run with full-length sequences, true and false complexes overlapped for ipTM values between 0.3 and 0.7. ipSAE separated them more cleanly, and the separation improved as the PAE cutoff was lowered.[1]
How ipSAE is calculated
Both ipTM and ipSAE are built from the TM-score term 1 / (1 + (d / d0)²), where d is a positional error and d0 is a length-dependent scale, d0 = 1.24 × (L − 15)^1/3 − 1.8 Å.[3] A pair with an error much smaller than d0 scores close to 1; a pair with an error much larger than d0 scores close to 0. For ipSAE, d is the PAE value for the pair.
The calculation for two chains, A and B, runs like this:[1]
- Take one residue in chain A as the alignment residue.
- Keep only the chain B residues whose PAE, given that alignment, is below the cutoff. Call their number n.
- Compute d0 from n, with a floor of 1.0 Å for n of about 27 or fewer.
- Average the TM term over those n residues.
- Repeat for every residue in chain A and keep the highest average. This is ipSAE(A→B).
- Do the same with chain B as the alignment chain to get ipSAE(B→A). The reported ipSAE for the pair is the larger of the two.
Step 3 is what makes ipSAE harsher than ipTM on the same PAE values. ipTM sets d0 from the summed length of both chains, so in a 600-residue complex a 2 Å error is forgiven almost completely. ipSAE sets d0 from the residues that actually pass the cutoff, which for a typical interface is tens to a few hundred.
| Residues passing the cutoff (n) | d0 | PAE 1 Å | PAE 2 Å | PAE 3 Å | PAE 5 Å |
|---|---|---|---|---|---|
| 27 or fewer | 1.00 Å | 0.50 | 0.20 | 0.10 | 0.04 |
| 50 | 2.26 Å | 0.84 | 0.56 | 0.36 | 0.17 |
| 100 | 3.65 Å | 0.93 | 0.77 | 0.60 | 0.35 |
| 200 | 5.27 Å | 0.97 | 0.87 | 0.75 | 0.53 |
| 600 | 8.57 Å | 0.99 | 0.95 | 0.89 | 0.75 |
Each cell is the score a single residue pair contributes, calculated from the d0 formula above with the ipSAE floor. A small interface needs very low PAE to score well: with 50 confident partner residues, a 2 Å error is worth 0.56, while the same error in a 600-residue ipTM calculation is worth 0.95.
Worked example: one interface, three ways
Consider a 350-residue protein binding a 250-residue partner, 600 residues in total. Of the partner's residues, 100 belong to a domain that sits in the interface, predicted with a PAE of 2 Å, and 150 are a disordered tail with a PAE of 28 Å. Now compare that with a false pair of the same size where AlphaFold placed only 10 partner residues at a PAE of 8 Å and left the other 240 at 25 Å. The numbers below are for the best alignment residue and are illustrative, not from a real job.
| Score | True interface with disordered tail | False pair |
|---|---|---|
| ipTM-style: all pairs, d0 from 600 | 0.43 | 0.12 |
| PAE cutoff only, d0 still from 600 | 0.95 | 0.53 |
| ipSAE: PAE cutoff and d0 from passing pairs | 0.77 | 0.02 |
The ipTM-style score penalizes the real interface for its tail and would put it in the "failed" range. Dropping pairs above the cutoff fixes that, but on its own it also lifts the false pair to 0.53, because the 10 surviving pairs are scored on the scale of a 600-residue complex. Recomputing d0 from those 10 residues (d0 = 1.0 Å) collapses the false pair to almost zero while leaving the real interface in the confident range. That is why Dunbrack treats both changes as necessary.[1]
The paper shows the same sequence on a real prediction. For full-length RAF1 with RIPK1, a protein not known to bind it, AlphaFold2's ipTM was 0.277. Applying a 15 Å PAE cutoff while keeping d0 at 11.75 Å, the value for the 1,319-residue complex, raised the score to 0.459. Recomputing d0 from the 75 residues that passed the cutoff (3.05 Å) brought it down to 0.044.[1]
ipSAE, ipSAE_min and the three d0 variants
ipSAE is asymmetric. ipSAE(A→B) and ipSAE(B→A) can differ, especially when one partner is small, because the number of passing residues and therefore d0 depends on which chain is being scored. The reference script reports both directions as asym rows and their maximum as a max row.[13]
The maximum is what AlphaFold DB displays.[4] Binder design work often prefers the minimum, ipSAE_min, which only scores well when both the binder's view of the target and the target's view of the binder are confident.[5]
The script also reports two variants that change only how d0 is set:[1]
| Column | d0 is calculated from | Use |
|---|---|---|
ipSAE | Residues in the scored chain with PAE below the cutoff, for each alignment residue | The main score |
ipSAE_d0chn | Summed length of both chains, as in ipTM | Isolating the effect of the PAE cutoff |
ipSAE_d0dom | All residues in either chain with any interchain PAE below the cutoff | A middle ground that uses one d0 for the whole pair |
If ipSAE_d0chn is much higher than ipSAE, the score is being propped up by a large d0 rather than by many confident pairs.
What counts as a good ipSAE score
| ipSAE | AlphaFold DB label | Reading |
|---|---|---|
| 0.8 or more | Very high | Interface modeled with high accuracy |
| 0.7 to 0.8 | Confident | Interface likely correct, with a well-arranged interaction |
| 0.6 to 0.7 | Low | Interaction may be correct but should be interpreted cautiously |
| Below 0.6 | Very low | Unlikely to represent a reliable complex |
These bands come from AlphaFold DB, which calculates ipSAE with a 10 Å PAE cutoff for its predicted dimers and only shows dimers with ipSAE of at least 0.6 and pDockQ2 of at least 0.23 on entry pages.[4] The AlphaFold DB statistics explain what that filter removed: the NVIDIA dimer set shown on the site holds 2,158,419 homodimers and 79,156 heterodimers after filtering.
Binder design uses similar numbers. Overath and colleagues collected 3,766 designed binders against 15 targets, of which 436 (11.6%) bound in vitro, re-predicted every design with AlphaFold3 and compared scores. ipSAE at a 10 Å cutoff gave a 1.4-fold higher average precision than interface PAE, and ipTM came second at low recall. They proposed AlphaFold3 ipSAE_min above 0.61 as one interpretable filter.[5] The same paper found precision varied from 0.1 to 1 between targets, so a threshold that works for one target can be weak for another.
Two cautions apply to any threshold. First, ipSAE depends on the PAE cutoff, and the reference repository's own examples use 15 Å for AlphaFold2 and 10 Å for AlphaFold3 and Boltz.[13] Compare scores only at the same cutoff. Second, each predictor calibrates PAE differently, so an ipSAE from AlphaFold2 and one from Boltz-2 are not directly interchangeable.
Examples of ipSAE in practice
A wrong peptide that ipTM missed
Varga and colleagues used four protein-peptide complexes to show ipTM's disorder problem. When Dunbrack re-ran them with full-length UniProt sequences, one stood out. For MAPK10 and SH3BP5 (PDB 4H3B), AlphaFold placed the wrong segment of SH3BP5 in the kinase's binding site: residues 425 to 439 instead of 341 to 350, which ended up about 100 Å away. ipTM was 0.443 and actifpTM 0.690, but ipSAE ranged from 0.0 to 0.20 across PAE cutoffs from 5 to 25 Å.[1][6] The model was confident about very few pairs, and ipSAE reported exactly that.
A three-chain complex where one pair does not touch
ipSAE is calculated for every chain pair, which helps with assemblies. For an AlphaFold3 model of RAF1, KSR1 and MEK1, AlphaFold3's chain-pair ipTM values were 0.46 for RAF1-KSR1, 0.51 for RAF1-MEK1 and 0.77 for KSR1-MEK1. ipSAE at a 15 Å cutoff gave 0.563, 0.261 and 0.636. RAF1 makes no contact with MEK1 in that model, and ipSAE marked that pair down where ipTM did not.[1]
Scoring a segment within one chain
The idea is not limited to separate chains. Dunbrack's group used an intramolecular ipSAE, scoring the kinase activation loop against the rest of the domain, to choose among AlphaFold2 models of all 437 human catalytic kinases in their active state. In a benchmark of 117 kinases, the top-scoring model was within 2.0 Å backbone RMSD of a substrate-bound structure for 92% of them.[10] ProteinIQ's ipSAE tool scores chain pairs as defined in the structure file, so a within-chain analysis needs the segment split into its own chain first.
How ipSAE compares with pDockQ, pDockQ2 and LIS
The ipSAE tool reports four other interface scores from the same files. They answer slightly different questions, and agreement between them is more convincing than any single value.
| Score | Built from | Notes |
|---|---|---|
| ipTM | PAE-derived TM terms over all interchain pairs, d0 from both chains | The predictor's own value; lowered by disorder in both chains[2] |
| ipSAE | PAE-derived TM terms over pairs below the PAE cutoff, d0 from those pairs | Insensitive to non-interacting regions; strict for small interfaces[1] |
| pDockQ | Mean pLDDT of interface residues within 8 Å and the number of contacts | Calibrated against DockQ; ignores PAE[7] |
| pDockQ2 | Interface pLDDT combined with PAE-derived terms for residues within 8 Å | Pairwise version for multi-chain complexes; 0.23 is a common acceptance line[8][4] |
| LIS | Mean of (12 − PAE) / 12 over interchain pairs with PAE below 12 Å | No length scaling; a simple average of good interchain PAE[9] |
pDockQ and pDockQ2 use a fixed 8 Å contact distance in the reference implementation, and ipSAE uses only the PAE cutoff. The distance cutoff you set in the tool controls which residues are listed as interface contacts in the native report; it does not change the ipSAE value.[13]
For structure quality rather than interaction, combining metrics helps. A study of T-cell receptor and peptide-MHC complexes trained a classifier on pLDDT, ipTM, ipSAE, interface PAE and pDockQ together and found it sorted AlphaFold3 models into quality tiers better than any single metric.[12] When an experimental structure exists, measure accuracy directly with DockQ instead.
Where ipSAE falls short
ipSAE is harsh on short partners. Below about 27 confidently placed residues, d0 is fixed at 1.0 Å, so a 12-residue peptide can only score well if its PAE is around 1 Å or less. Dunbrack calls this floor "somewhat arbitrary" and notes it needs more study. The reference code uses a 2.0 Å floor for nucleic acid pairs.[1][13] For peptide-protein docking, read the interchain PAE alongside ipSAE rather than relying on a single cutoff.
ipSAE takes a maximum over alignment residues, so it reports the best interface between two chains. Proteins that touch through two separate domains get credit only for the stronger one; the per-residue file from the tool shows whether a second region also scores well.[1]
ipSAE is not designed to rank close sequence variants. A 2026 perspective found that ipTM, pDockQ2 and ipSAE all struggled to order similar sequences against one another, and suggested pairing them with physics-based scoring when choosing between point mutants or closely related designs.[11]
Finally, ipSAE measures the predictor's confidence in a structure, not binding. A design optimized against AlphaFold2 can score well in AlphaFold2 for reasons that do not carry over to the lab. Re-predicting with a different model, such as AlphaFold3 in the Overath study or Boltz-2, and scoring that prediction is a stronger test.[5]
Calculating ipSAE on ProteinIQ
The ipSAE tool takes two files from the same prediction: the PAE matrix and the matching structure.
| Predictor | PAE file to upload | Structure file |
|---|---|---|
| AlphaFold2 multimer | The PAE JSON for the chosen model | The matching ranked PDB, such as prediction_rank01.pdb |
| AlphaFold3 or AlphaFold Server | *_full_data_*.json, not summary_confidences*.json | The matching model CIF |
| Boltz-2 | The PAE NPZ, written when Save PAE matrix is enabled | The matching model CIF or PDB |
Boltz-2 does not save the PAE matrix by default, so turn on Save PAE matrix before you run a job you plan to score. The settings are the PAE cutoff, 10 Å by default, and the distance cutoff, 15 Å by default.
Results come back as a table with one row per direction and chain pair. Rows marked asym are the two directional values, so the smaller of the A-B and B-A rows is ipSAE_min. The max row is the larger value, comparable with AlphaFold DB. The ipTM column repeats the predictor's own ipTM for comparison, and the residue counts show how many residues in each chain passed the PAE cutoff. A chain pair with ipSAE near zero and only a few passing residues is a pair the model did not place.
A typical workflow for checking a predicted interaction:
- Predict the complex with AlphaFold2 or Boltz-2 using full-length sequences, with PAE output enabled.
- Score it with ipSAE and compare ipSAE with ipTM. A large gap usually means disorder or extra domains, not a bad interface.
- If ipSAE is confident, look at which residues passed the cutoff and rerun with only the interacting domains to confirm.
- Check pLDDT at the interface before using contacts for mutation analysis or protein-protein docking follow-ups.
For protein binder design, FreeBindCraft can rank accepted designs by ipSAE instead of i_pTM and exposes Average_ipSAE for custom filters. BindCraft, mBER and BoltzGen report ipTM-family scores, so the usual extra step is to re-predict the shortlisted designs with Boltz-2 or AlphaFold2 and score each binder-target pair with ipSAE_min. The BindCraft guide covers where these scores appear in the design output.
Tools for interface confidence on ProteinIQ
| Tool | Role |
|---|---|
| ipSAE | Calculates ipSAE, ipSAE_d0chn, ipSAE_d0dom, ipTM, pDockQ, pDockQ2 and LIS from PAE and structure files |
| AlphaFold2 | Multimer predictions with PAE output; optional actifpTM |
| Boltz-2 | Complexes with proteins, nucleic acids and ligands; PAE NPZ on request |
| Chai-1, OpenFold3, Protenix | Alternative complex predictors for a second opinion on ipTM and PAE |
| FreeBindCraft | Binder design with optional ipSAE ranking |
| BindCraft, mBER, BoltzGen | Binder design scored by ipTM-family metrics; rescore re-predicted designs with ipSAE |
| DockQ | Measures interface accuracy against an experimental reference |
For choosing a predictor in the first place, see protein complex structure prediction.
Frequently asked questions
What does ipSAE stand for?
Interaction prediction Score from Aligned Errors. The paper's title, "Rēs ipSAE loquuntur", plays on a Latin phrase meaning that the things speak for themselves, a nod to letting AlphaFold's own output scores do the work.[1]
What is the difference between ipSAE and ipTM?
Both are TM-score-style measures of how confidently two chains are placed. ipTM averages over every residue of the partner chain and scales by the length of both chains. ipSAE averages only over partner residues with PAE below a cutoff and scales by how many of those there are, so disordered or non-interacting regions do not affect it.[1][2]
What is a good ipSAE score?
AlphaFold DB treats 0.8 or more as very high, 0.7 to 0.8 as confident, 0.6 to 0.7 as low and below 0.6 as very low.[4] For designed binders, an AlphaFold3 ipSAE_min above about 0.61 was one useful filter in a large meta-analysis, though performance varied between targets.[5]
What is ipSAE_min?
ipSAE is calculated in both directions between two chains. ipSAE_min is the lower of the two, and ipSAE_max, the value usually reported as ipSAE, is the higher. The minimum is stricter and is often used for binder design.[5]
Why is my ipSAE lower than ipTM?
For compact, fully ordered complexes this is normal. ipSAE sets d0 from the residues that pass the cutoff, which is a smaller number than the whole complex, so the same PAE earns a lower score. ipSAE is mainly higher than ipTM when disordered or extra domains are present in both chains.
Which PAE cutoff should I use?
10 Å is the default on ProteinIQ, in AlphaFold DB and in the binder design meta-analysis.[4][5] The reference repository's AlphaFold2 example uses 15 Å.[13] Choose one and keep it fixed when comparing models.
Can ipSAE be calculated for Chai-1 or ESMFold2 predictions?
The reference script reads AlphaFold2 JSON, AlphaFold3 full-data JSON and Boltz NPZ files, and ProteinIQ's ipSAE tool accepts the same formats.[13] For other predictors, read the interchain PAE and ipTM they report instead.