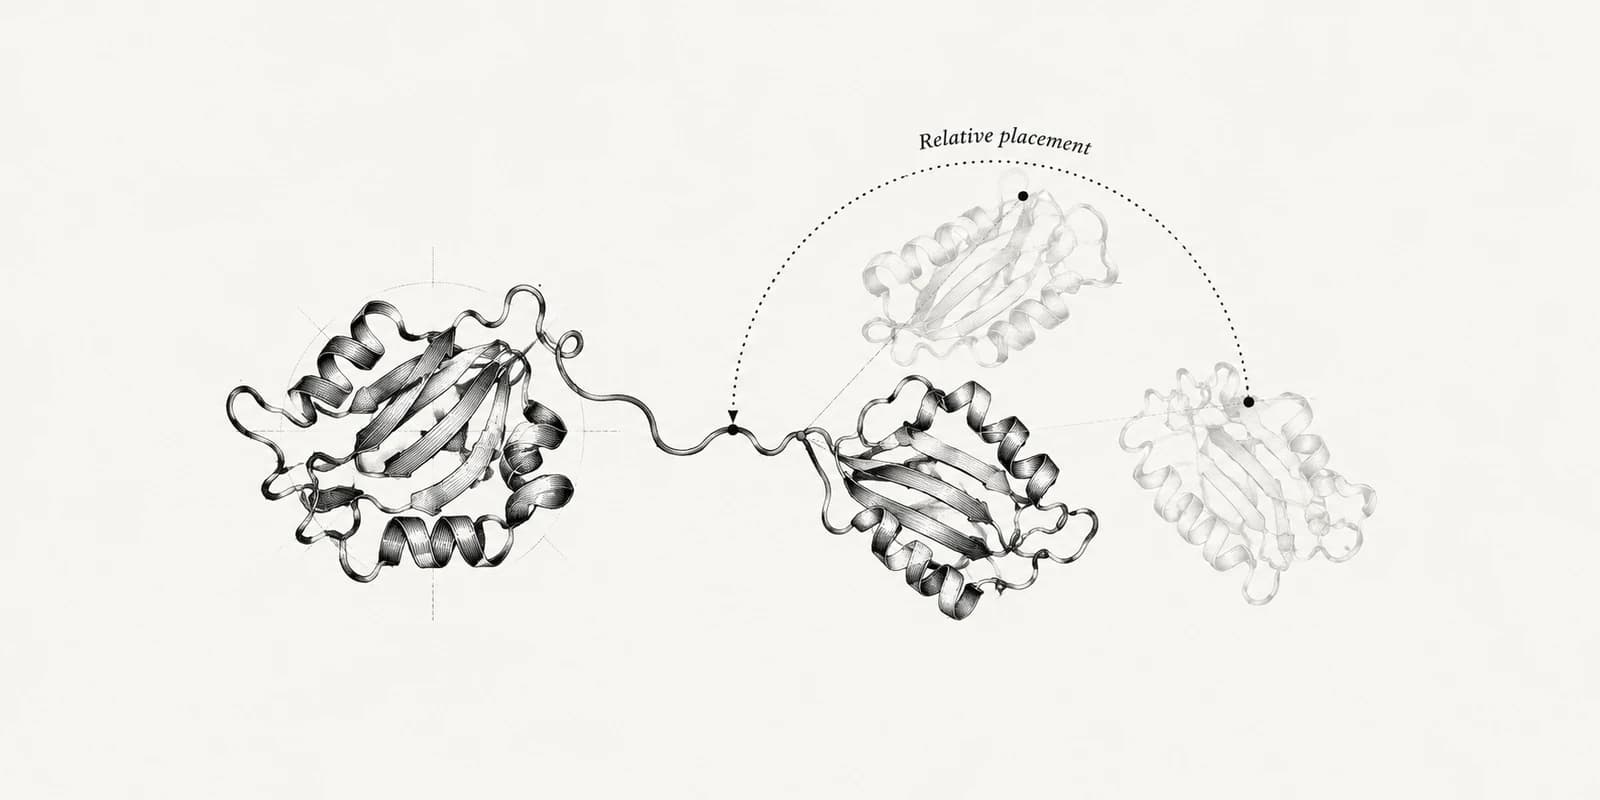
A predicted structure arrives looking finished. Every atom has coordinates, the ribbons are smooth, and nothing on screen tells you which parts are real. Calmodulin shows the problem. In its AlphaFold Database model, both lobes average above 85 on pLDDT, but the predicted aligned error between them says the model has no idea how the lobes face each other. Each lobe is trustworthy; the shape of the whole protein is not.
It works the other way too. The AlphaFold2 model of the GCN4 leucine zipper examined below gets an ipTM of 0.74, low enough to look doubtful, and yet it matches the crystal structure almost exactly.
So the useful question is not whether a model is good, but whether it is good enough for what you want to do with it. Answering it means reading the right score for the right part of the model, then checking that score against something the model did not produce: an experimental structure when one exists, and basic chemistry when it does not.
This guide sets out that reading order, from per-residue confidence through interface scores to measured accuracy. It includes a table for matching your question to a score and follows one real AlphaFold2 prediction through every check.
The reading order
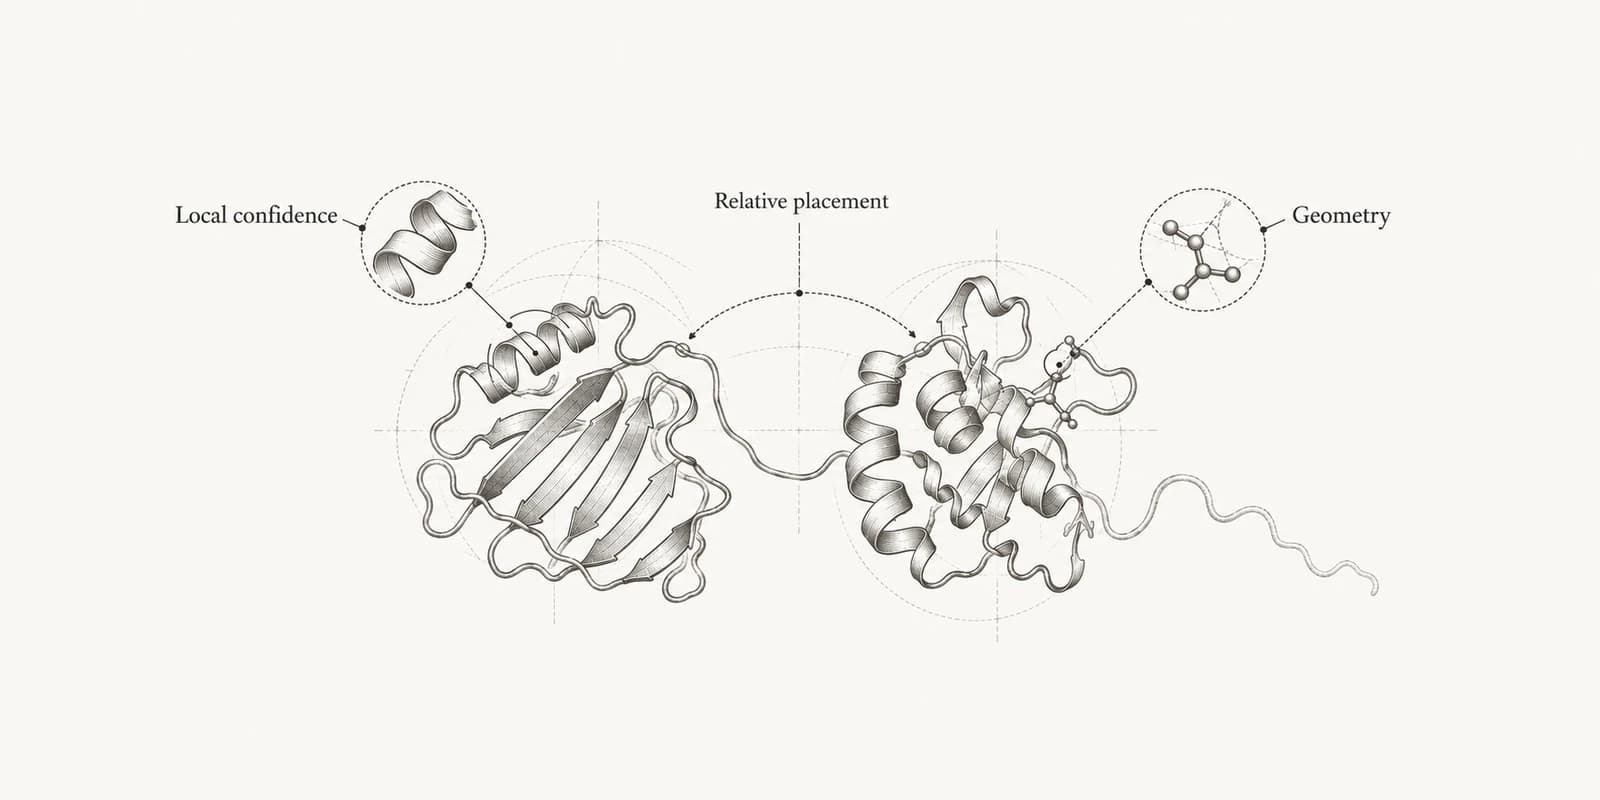
Structure predictors such as AlphaFold2, Boltz-2, ESMFold and Chai-1 report most of the scores below with the model. Each answers a narrower question than "is this right?", and the order matters because later scores are built from earlier ones.
1. pLDDT: which residues to trust locally
pLDDT is a per-residue score from 0 to 100 that estimates how well the local environment of each residue matches the true structure.[1] The usual bands are above 90 for very high confidence, 70 to 90 for a generally correct backbone, 50 to 70 for low confidence, and below 50 for regions that are often disordered.[2] Read it along the sequence rather than as a mean, because one confident domain can hide a disordered tail and the reverse.
pLDDT says nothing about how far apart two confident regions are. Two domains can both score above 90 while their relative orientation is a guess.
2. PAE: whether domains and chains are placed
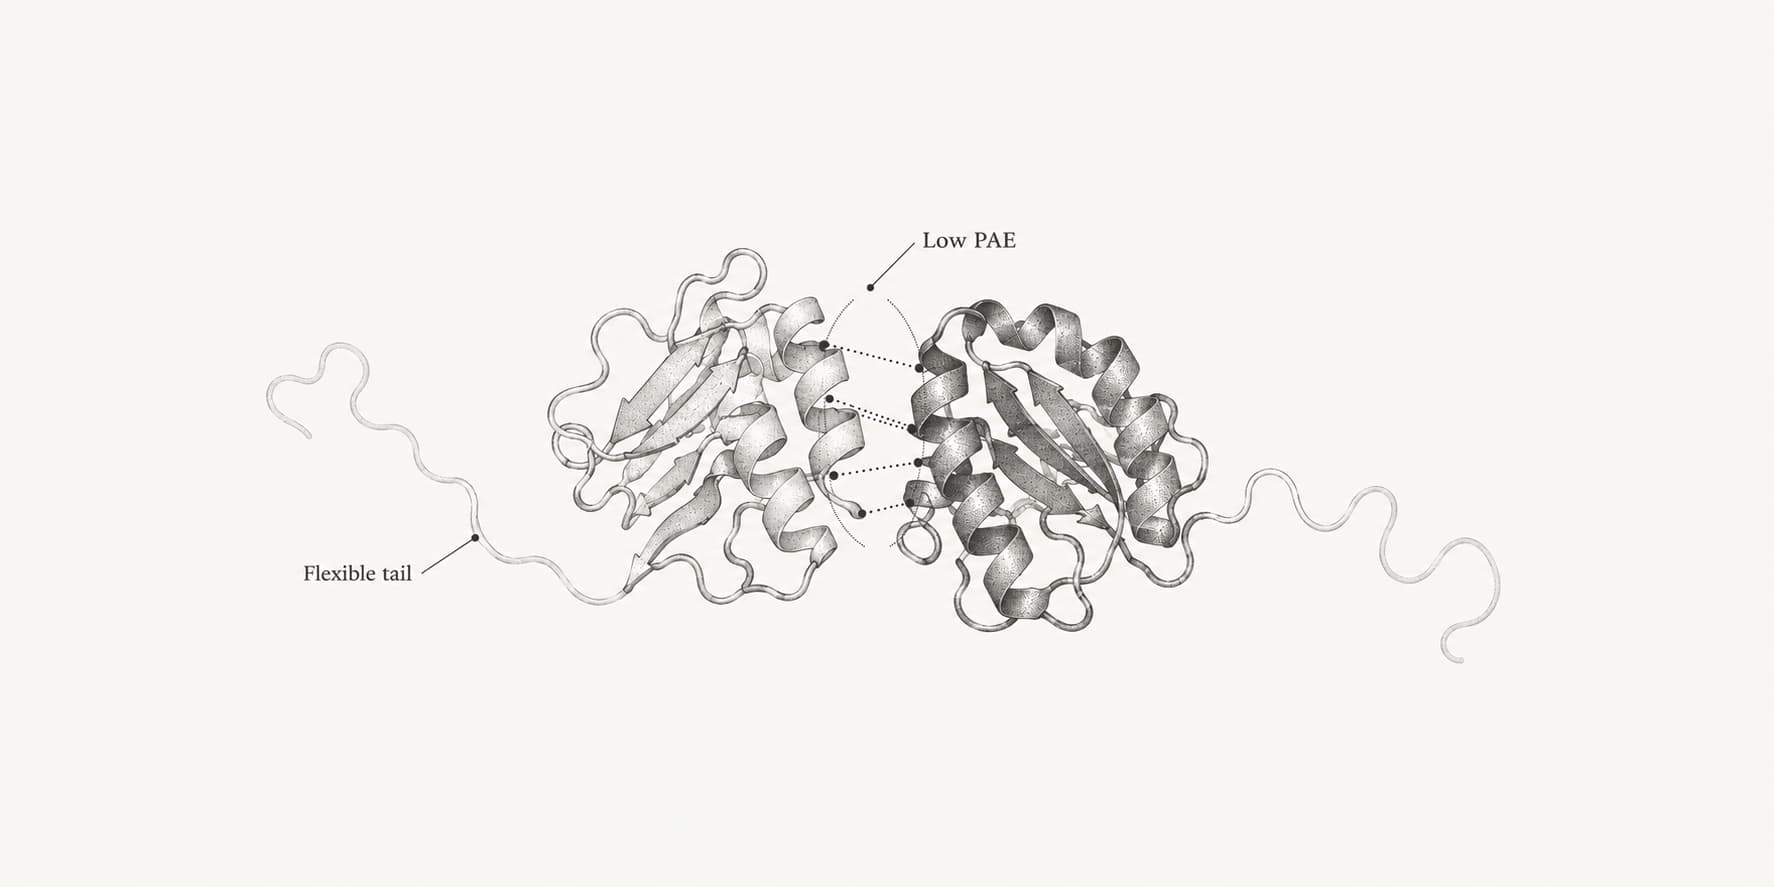
PAE (predicted aligned error) is a matrix of expected position errors, in ångströms, for every residue when the model is aligned on every other residue.[1] Dark blocks on the diagonal are rigid units; the off-diagonal blocks say whether those units are placed relative to each other.[3] In a complex, the blocks between chains describe the interface.
As a rule of thumb, values below about 5 Å between two regions mean a confident relative placement and values above about 15 Å mean the model has little information.
3. pTM and ipTM: one-number summaries
pTM is the model's estimate of the TM-score of the whole structure, and ipTM is the same estimate counted only over pairs of residues in different chains.[1][4] The AlphaFold3 documentation reads ipTM above 0.8 as a confident complex, below 0.6 as a likely failure and the range between as uncertain, and pTM above 0.5 as a sign that the overall fold might be right.[5] The ipTM and pTM guide covers how both are calculated and why they disagree.
Both are averages over many residue pairs, so they fall when part of a correct model is uncertain. EMBL-EBI notes that a complex with large disordered sections can be predicted correctly even with pTM below 0.5 and ipTM below 0.6.[6]
4. ipSAE and pDockQ: interfaces with flexible regions
ipTM counts every residue of the partner chain, including tails and domains that never touch the interface. Dunbrack showed that adding disordered segments to both chains of a correctly predicted KRAS and RAF1 complex lowered ipTM from 0.90 to 0.59 without changing the interface.[7]
ipSAE rebuilds the score from interchain pairs with low PAE only, and AlphaFold DB reads it in bands at 0.6, 0.7 and 0.8.[7][8] actifpTM, which restricts the calculation to residues predicted to be in contact, addresses the same problem from within AlphaFold2.[9]
pDockQ and pDockQ2 estimate the DockQ of an interface from the pLDDT of contacting residues, and pDockQ2 adds their PAE. Both use 0.23 as the line for an acceptable model.[10][11] The DockQ guide explains the formulas and their limits, including the 0.742 ceiling of pDockQ.
5. Checks against an experimental structure: RMSD, TM-score and DockQ
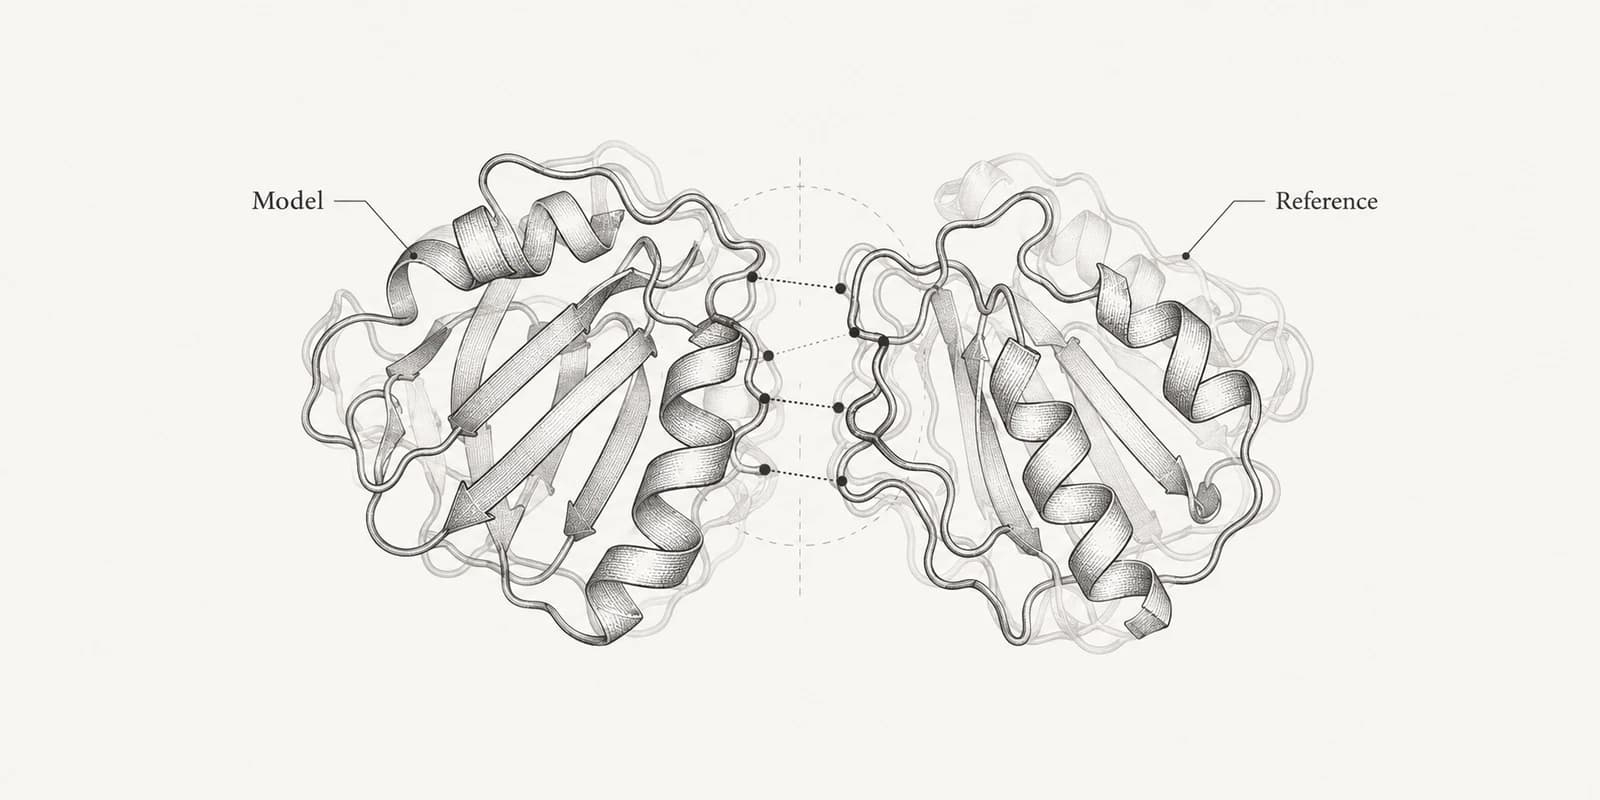
When a structure of the same protein or complex has been solved, measure the error instead of estimating it. RMSD gives the average distance between matched atoms after superposition, in ångströms. It is easy to read for small, rigid comparisons but grows with protein size and is dominated by the worst-placed region.
The TM-score weights each residue by a length-dependent distance scale, so it stays between 0 and 1 for proteins of any size, and a score above 0.5 generally means the two structures share a fold.[12][13] The TM-score vs RMSD guide covers when to use each.
For complexes, DockQ scores the interface itself by combining the fraction of native contacts recovered with interface and ligand RMSD. Values of 0.23, 0.49 and 0.80 mark acceptable, medium and high quality in the CAPRI classes.[14] DockQ is the measured quantity that ipTM, ipSAE and pDockQ try to predict.
6. Geometry checks: MolProbity and Ramachandran
Confidence scores and accuracy measures do not check chemistry. The MolProbity score combines the clashscore, rotamer outliers and Ramachandran statistics into one number, and the clashscore counts serious atomic overlaps per 1,000 atoms.[15] A Ramachandran plot shows each residue's backbone φ and ψ angles; MolProbity's goal for a well-refined structure is at least 98% of residues in the favored regions.[15]
AlphaFold2 normally finishes with an Amber relaxation step. Its authors report that relaxation does not improve accuracy but removes stereochemical violations, so relaxed predictions usually pass these checks easily.[1] Geometry checks therefore matter most for unrelaxed models, designs, docked complexes and edited structures, and a clean report never shows that a fold is correct.
Which score answers which question
The table below starts from the question you want the model to answer. The first score to read is the one built for that question; the second column lists what should agree with it before you rely on the model.
| Question | Read first | Confirm with |
|---|---|---|
| Is this region folded, and can I trust its backbone? | pLDDT above 70 along the region | A disorder predictor for stretches below 50 |
| Can I use side chains in a pocket or active site? | pLDDT above 90 for the residues involved | PAE between the residues lining the site; MolProbity rotamers |
| Are two domains oriented correctly? | PAE block between the domains, ideally below about 5 Å | pTM; a structure of a homolog if one exists |
| Is the overall fold right? | pTM above 0.5 | TM-score above 0.5 against a related experimental structure |
| Are the chains of a complex placed correctly? | ipTM above 0.8, or chain-pair ipTM for larger assemblies | Interchain PAE blocks; ipSAE and pDockQ2 |
| Is the interface real when the chains have flexible tails? | ipSAE, with 0.6 as a common minimum | pDockQ2 above 0.23; a rerun with the tails trimmed |
| How close is the model to a solved structure? | TM-score normalized by the reference, and Cα RMSD | DockQ of 0.23, 0.49 or 0.80 and above for each interface |
| Is the geometry physically reasonable? | Clashscore and Ramachandran favored of at least 98% | Residue-level outliers in the regions you care about |
Two habits make the table more useful. First, read the scores for the part of the model your conclusion depends on: an interface, a pocket or a domain pair, not the whole-model average. Second, look for agreement between scores built from different inputs. pLDDT, PAE and an experimental comparison fail in different ways, so a model that passes all three is far more trustworthy than one that passes a single high threshold.
Worked example: a GCN4 leucine zipper dimer
The public AlphaFold2 example on ProteinIQ for the GCN4 leucine zipper homodimer predicts two copies of a 33-residue peptide from the yeast transcription factor GCN4. The run used the AlphaFold-Multimer v3 weights in single-sequence mode, with no alignment and no templates, one model, and no relaxation. The Extra pTM metrics setting was on, so the result also includes actifpTM.
The crystal structure of the same peptide, PDB 2ZTA, was solved at 1.8 Å and shows a parallel two-stranded coiled coil.[16] That makes it possible to check every confidence score against a measured answer. 2ZTA was public decades before AlphaFold was trained, so this is a demonstration of how the scores behave, not a blind test.
We recalculated every value below from the job's files with the ipSAE reference script, DockQ 2.1.3, US-align and CCTBX MolProbity; the analysis script and data reproduce them.[17][18]
| Step | Score | Value | Usual reading |
|---|---|---|---|
| 1 | Mean pLDDT | 92.6; 52 of 66 residues above 90 | Very high |
| 1 | pLDDT of the last three residues of each chain | 77, 61 and 50 in chain A | Confident to very low |
| 2 | PAE between contacting residues of the two chains | 1.8 Å on average | Confident placement |
| 2 | PAE when aligned on a frayed chain end (residue 1 or 31 to 33) | 14 to 18 Å on average | Uncertain |
| 3 | pTM | 0.77 | Above 0.5 |
| 3 | Chain pTM | 0.59 for each chain | Above 0.5 |
| 3 | ipTM | 0.74 | Gray zone |
| 4 | actifpTM | 0.89 | Confident |
| 4 | ipSAE, both directions | 0.45 and 0.44 | Very low |
| 4 | pDockQ and pDockQ2 | 0.42 and 0.75 | Above 0.23 |
| 5 | Cα RMSD to 2ZTA, both chains | 0.58 Å over 62 residues | Very close |
| 5 | TM-score normalized by 2ZTA | 0.96 | Same structure |
| 5 | DockQ against 2ZTA | 0.935; 46 of 47 native contacts, interface RMSD 0.62 Å | High quality |
| 6 | Ramachandran favored and outliers | 100% and 0% | Meets the goal |
| 6 | Clashscore | 23.3 | High for a predicted model |
| 6 | MolProbity score | 1.86 | Raised by the clashscore |
Steps 1 and 2: pLDDT and PAE
pLDDT is very high across the helices, averaging 96.3 over residues 3 to 30 of chain A, and drops at the C-terminal end to 50 at the last residue. The two final residues of each chain are also missing from the crystal structure, which is what a low score at a chain end usually means.
The PAE matrix shows where the uncertainty sits. Residues within four positions of each other have an expected error of 1.25 Å, and contacting residues across the two chains average 1.8 Å, so the model is confident about the local helix and about how the two helices pack.
When the model is aligned on any core residue from 3 to 30, the expected error across the whole dimer averages 2.2 Å. Aligning on a frayed end, residue 1 or residues 31 to 33, raises it to 14 to 18 Å, because the orientation of those residues is itself uncertain. In the job's PAE plot these frames appear as red bands along the edges of each chain's block. The model knows how the helices pair; it does not know where the ends point.
Steps 3 and 4: pTM, ipTM and the interface rescores
pTM is 0.77, and ipTM is 0.74, which falls in the gray zone of the AlphaFold3 bands. On their own, these numbers would suggest treating the dimer with caution.
They are low for two reasons that have nothing to do with the interface. ipTM averages over every residue of the partner chain, frayed ends included. And the TM-score's distance scale shrinks with length: for the 66 residues of the dimer it is 2.8 Å, and for a single 33-residue chain it is 1.45 Å.[12]
At a 2.8 Å scale, even a residue placed with a 2 Å error keeps only about two thirds of its credit, since 1 / (1 + (2 / 2.8)²) is 0.66. The chain pTM of 0.59 shows how strict that scale is for a well-predicted helix.
actifpTM, which counts only residues the model places in contact, is 0.89.[9] pDockQ2 is 0.75 and pDockQ is 0.42, both well above 0.23. ipSAE, though, is 0.45, below the 0.6 line that AlphaFold DB uses.
ipSAE sets its distance scale from the number of partner residues that pass the PAE cutoff, here all 33, which gives the same strict 1.45 Å scale; computed with the scale for both chains, the same ipSAE calculation gives 0.72.[7] This is the opposite of the usual story, in which ipSAE rescues an interface that disordered tails pulled down. Here there are no tails, and the short chains make every TM-style score strict.
A larger interface behaves very differently. A public AlphaFold-Multimer prediction of barnase with barstar, 110 and 89 residues, scores ipTM 0.92, ipSAE 0.77 and 0.87 in the two directions at a 15 Å PAE cutoff, and pDockQ2 0.91. With chains about three times longer, the distance scale grows to 5.3 Å for the complex and every score clears its confident band.
Steps 5 and 6: comparison with 2ZTA and geometry
The measured answer settles it. Against 2ZTA, DockQ is 0.935, in the high-quality class, with 46 of 47 native contacts recovered and an interface RMSD of 0.62 Å. US-align superimposes all 62 ordered Cα atoms with an RMSD of 0.58 Å and a TM-score of 0.96 normalized by the crystal structure. The prediction matches the crystal structure closely, even though ipTM and ipSAE would have flagged it.
Geometry tells a separate story. Every residue is in the favored Ramachandran region, but the clashscore is 23.3 and several peptide bonds are about 0.13 Å shorter than ideal, because the job skipped relaxation. The model has the right fold and the right interface, but it should be relaxed before anyone uses its side-chain contacts for detailed analysis.
What generalizes from this example is the order of trust. pLDDT and the interchain PAE identified the confident interface correctly. The summary scores were pulled down by the size of the molecule and its uncertain ends. Only an independent comparison and a geometry check could separate "uncertain" from "small with frayed ends" and "correct" from "physically clean".
Common failure patterns
Most misreadings of predicted structures fall into a few patterns. Each has a check that catches it.
Confident residues, wrong arrangement
A multidomain protein or a complex can score high on pLDDT throughout while the relative placement of its parts is a guess. The PAE blocks between domains or chains reveal this, and so does pTM or ipTM.
Calmodulin is the classic case: its two EF-hand lobes are each well predicted, but the PAE between them is high. Scoring the lobes of a public AlphaFold2 model as separate domains in ipSAE gives 0.08, which says the model has no confident opinion about how the lobes face each other.
Low ipTM for a correct interface
Disordered tails, accessory domains and short chains with uncertain ends all lower ipTM without the interface being wrong, as the GCN4 example and Dunbrack's RAF1 example show.[7] Read the interchain PAE between the contacting regions, rescore with ipSAE or actifpTM, or rerun with the interacting domains only.
Confident structure for the wrong state
A high score means the model is confident in one conformation, not that the protein adopts it in your experiment. AlphaFold2 assigned confident structures to nearly 15% of human intrinsically disordered regions, many of which fold only when they bind a partner or are modified.[19] Proteins that switch between open and closed states, or that change shape when a ligand binds, can be predicted confidently in only one of them.
Shallow alignment, low confidence for a folded protein
AlphaFold2's accuracy drops substantially when the multiple sequence alignment has fewer than about 30 sequences.[1] A low pLDDT in that case means the model lacks information, not that the region is disordered. Try an alignment-based run if a single-sequence model gives low scores, and check whether a disorder predictor agrees before calling a region unstructured.
Clean geometry, wrong model
Relaxed predictions usually have excellent MolProbity and Ramachandran statistics, including in regions the model has no confidence in. Geometry checks catch broken models, not wrong ones, so read them together with pLDDT and PAE.
Treating a confident prediction as an experimental structure
Even in regions above 70 pLDDT, Terwilliger and colleagues found typical distortions of 0.5 to 1 Å across the molecule when they compared AlphaFold predictions with experimental density, and the predictions do not account for ligands or covalent modifications.[20] A very confident model is a strong hypothesis to test, not a substitute for a measurement.
Comparing scores across tools and settings
Each predictor calibrates pLDDT, PAE and ipTM separately, and ipSAE depends on the PAE cutoff used.[7] Compare values within one tool and one set of settings. Scores used as design objectives are a further case: a binder optimized to maximize ipTM will tend to score well on ipTM, so check designs with an independent predictor before trusting them.
Checking a prediction on ProteinIQ
A full check of a predicted structure on ProteinIQ runs in this order:
- Predict the structure with AlphaFold2, Boltz-2 or ESMFold, and generate more than one sample or model when you can, so you can see whether the result is consistent.
- Read pLDDT along the sequence in the structure viewer and note the regions below 70.
- Open the PAE plot and look at the blocks between domains and between chains.
- For complexes, read ipTM and the chain-pair values, then rescore with ipSAE, which also reports pDockQ, pDockQ2 and LIS.
- If an experimental structure exists, compare with US-align or the RMSD calculator, and score each interface with DockQ.
- Run MolProbity and the Ramachandran plot tool, especially on unrelaxed, designed or edited models.
The protein structure prediction and protein complex structure prediction use cases compare the predictors and help choose one for your input.
Frequently asked questions
Which confidence score should I look at first?
pLDDT, because it tells you which parts of the model have a defined structure at all. Then read PAE before any single-number summary, since pTM and ipTM are built from it and hide where the uncertainty sits.[1]
Can a prediction with a low ipTM be correct?
Yes. Disordered regions, extra domains and short chains all lower ipTM without changing the interface. The GCN4 dimer above has an ipTM of 0.74 and a DockQ of 0.935 against the crystal structure. Check the interchain PAE and an interface rescore such as ipSAE or actifpTM before discarding a model.
Is a model with pLDDT above 90 ready for docking?
Not on its own. High pLDDT means the local geometry around those residues is confident, but the pocket can still be in the wrong state for your ligand, and domains forming the pocket need low PAE between them. Treat the model as a hypothesis and check the pocket conformation against any structure with a bound ligand.[20]
Do I need an experimental structure to validate a prediction?
No, but without one you are relying on the model's own estimate of its error. Agreement between pLDDT, PAE and an interface rescore, together with clean geometry, is the best evidence available without experimental data. When a structure of the same protein or a close homolog exists, a TM-score or DockQ comparison replaces estimates with measurements.
Can I compare confidence scores between AlphaFold2 and Boltz-2?
Only roughly. The scores share definitions, but each model is trained and calibrated separately, so the same ipTM or PAE does not carry the same accuracy in both. Compare models within one tool, or use an independent measure such as DockQ when you need to choose between tools.