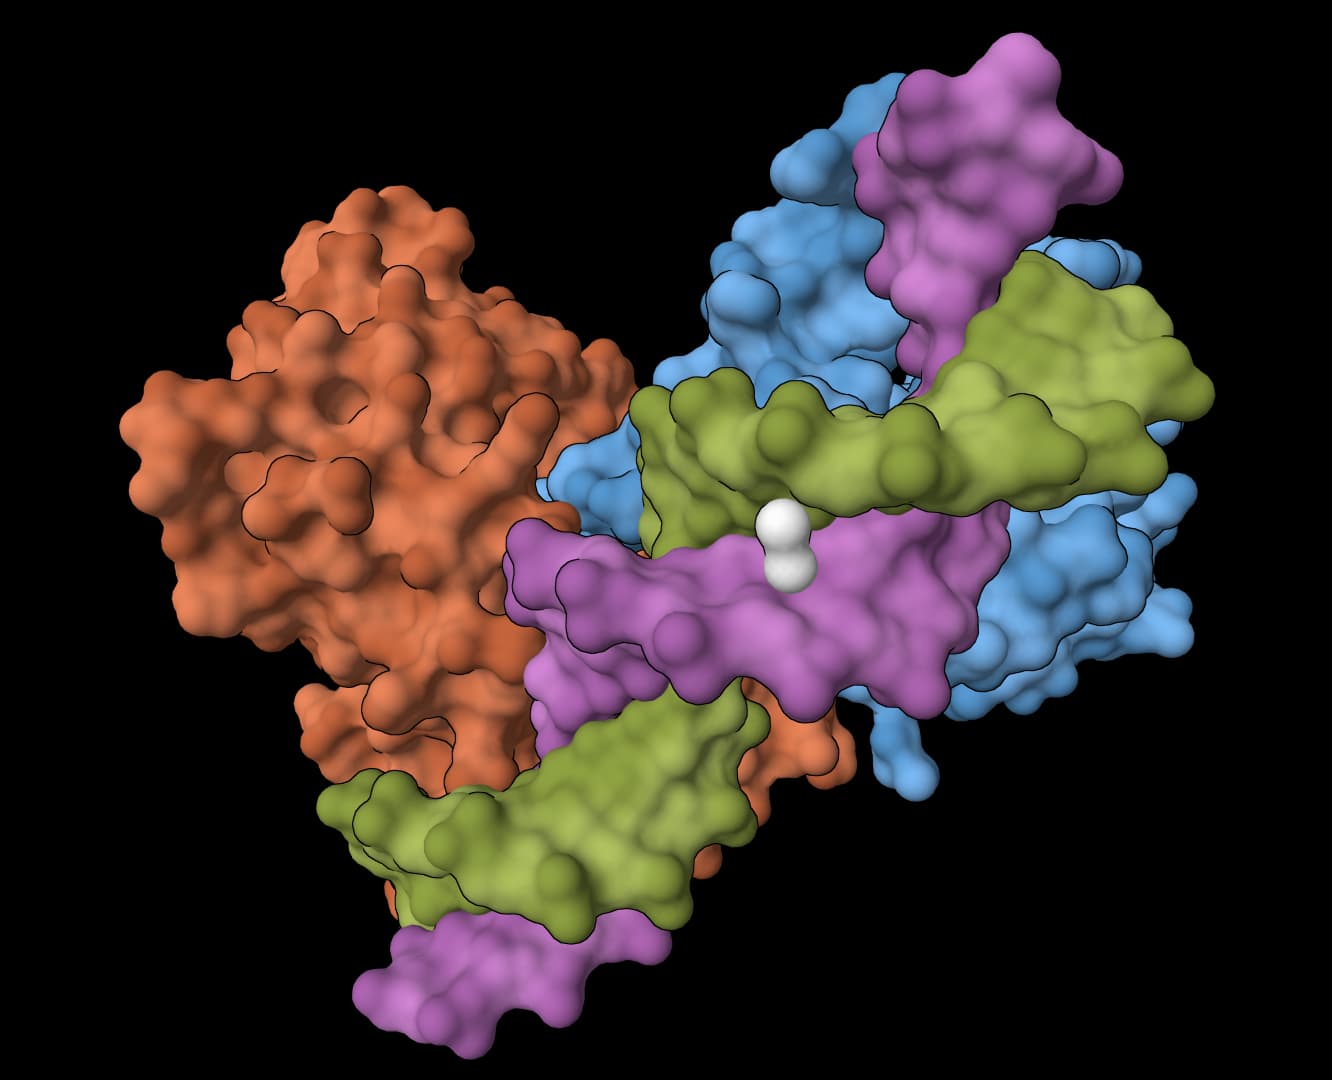
MolProbity
Validate protein structures with clashscore, Ramachandran, rotamer, and geometry checks.
What is MolProbity?
MolProbity is a comprehensive structure validation tool that assesses protein and nucleic acid quality through all-atom geometry analysis. Rather than just checking if atoms fit the electron density map, MolProbity examines whether atoms are physically positioned correctly relative to each other, detecting steric clashes, backbone geometry problems, and sidechain conformational errors that even high-resolution crystallography can miss.
Structure validation is essential before using a protein model for downstream analysis or design work. A structure with poor geometry may look reasonable in electron density but contain atomic overlaps or distortions that lead to incorrect functional predictions. MolProbity combines multiple quality metrics into a single, interpretable framework that catches both obvious errors and subtle geometric inconsistencies, and is widely used during structure refinement as well as for assessing confidence in predicted models from AlphaFold2, Boltz-2, or experimental methods.
How to use MolProbity online
Upload a PDB or mmCIF structure file to ProteinIQ, or enter an RCSB PDB ID to fetch directly from the Protein Data Bank, and receive a full MolProbity validation report in seconds. Results include headline quality metrics covering clashscore, Ramachandran analysis, rotamer outliers, C-beta deviations, CaBLAM backbone analysis, Ramachandran Z-score, omega/cis-peptide assessment, bond geometry, and the composite MolProbity Score. Residue-level outliers are shown in a separate table, and downloadable files include summary CSV, outlier CSV, the full MolProbity text report, Probe output when generated, and a Coot script when available.
Input
| Input | Description |
|---|---|
Protein Structure | PDB file (.pdb, .ent), mmCIF file (.cif, .mmcif), or RCSB PDB ID (e.g., 1UBQ). Maximum 50 MB. |
The structure must contain valid atomic coordinates. For proteins, all backbone atoms (N, Cα, C, O) should be present for reliable analysis. Structures with missing backbone atoms will have reduced validation detail.
Output
MolProbity returns a metrics spreadsheet, an outliers spreadsheet, and a Files tab. The metrics table summarizes overall structure quality. The outliers table lists flagged residues or atoms from Ramachandran, rotamer, omega, clash, C-beta, CaBLAM, geometry, and RNA checks when present. The Files tab includes downloadable CSV exports and source-style MolProbity artifacts for detailed inspection.
The Files and Logs views also include one downloadable run.log summarizing structure size, validation phases, headline scores, and the number of reported outliers. Raw Probe output remains a separate scientific artifact and is not copied into the Run log.
Understanding the results
The metrics table reports clashscore, Ramachandran and rotamer statistics, C-beta deviations, CaBLAM, Rama-Z, peptide-bond (omega) checks, bond and angle geometry, and the MolProbity score, which combines clashscore, rotamer outliers and Ramachandran favored residues into one number on the scale of crystallographic resolution. Lower is better, and a MolProbity score below the structure's resolution means the model is better than the average structure at that resolution. Each metric carries an Excellent, Good or Outlier flag, Info when no threshold applies, or N/A when it could not be computed. Flagged residues in the outlier table may be modeling errors or genuine strained conformations, so inspect them in a structure viewer before acting on them.
MolProbity examples
Ubiquitin compact X-ray structure
This example validates the compact, single-chain ubiquitin model deposited as RCSB PDB 1UBQ. It provides a concise introduction to the complete metrics table before moving to larger or more heterogeneous structures.
- Input: Ubiquitin from RCSB PDB
1UBQ, a 1.8 Å X-ray structure
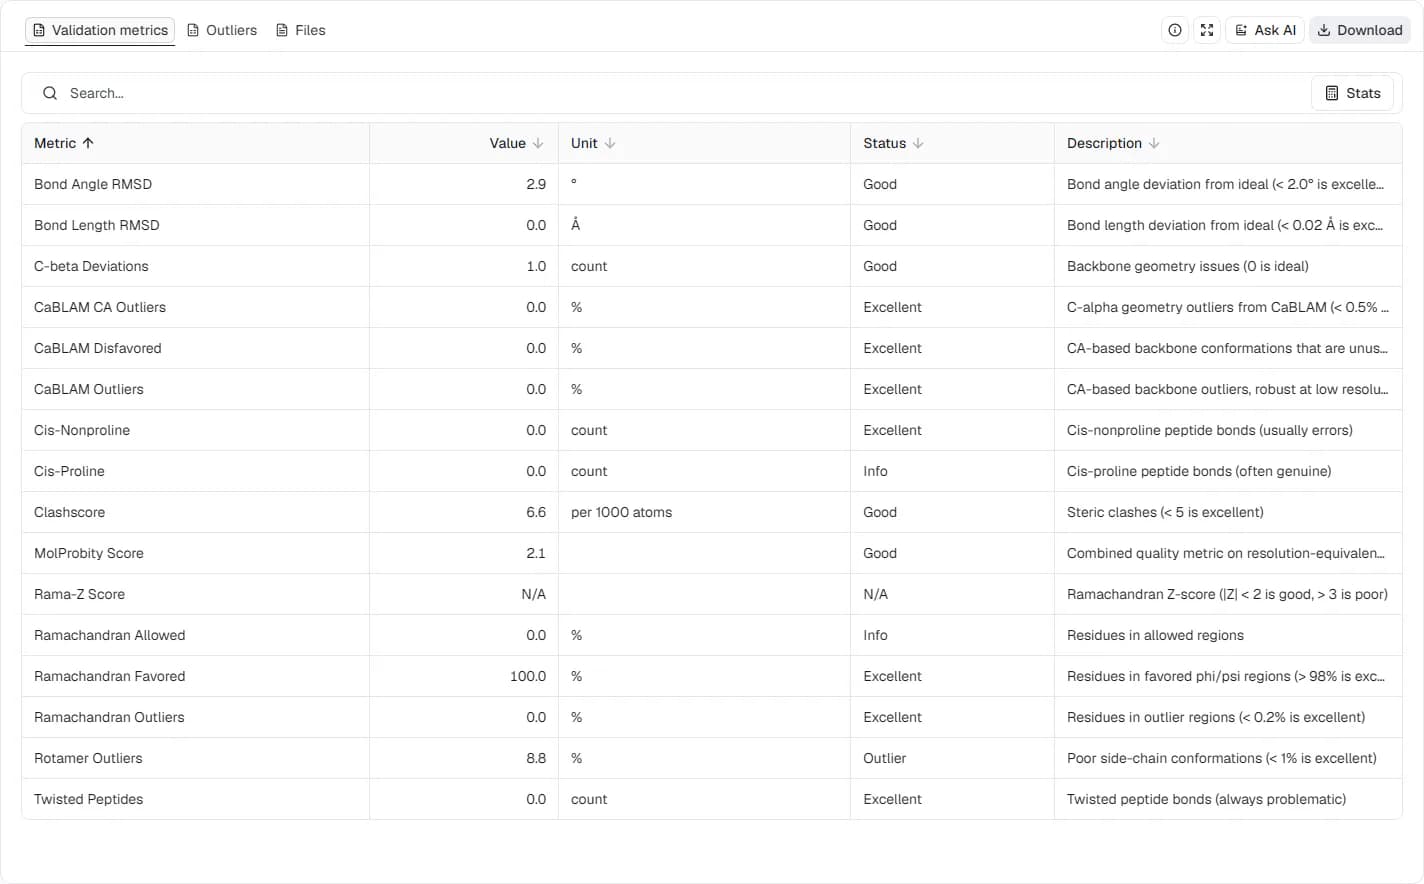
The submitted coordinates returned a MolProbity Score of 2.09 and a clashscore of 6.64 per 1000 atoms. Ramachandran Favored is 100.0% with 0.0% Ramachandran Outliers, while Rotamer Outliers is 8.8% and the outlier report contains 11 flagged residues or atom contacts. These results localize geometric features in this deposited model; they do not assess agreement with the original diffraction data.
Inhibitor-bound HIV-1 protease dimer
The 1HVR example shows how MolProbity combines whole-structure metrics with residue-level review for an inhibitor-bound, two-chain protein complex. Its outlier table contains several validation categories, making it useful for learning how to prioritize local inspection.
- Input: Inhibitor-bound HIV-1 protease from RCSB PDB
1HVR, a 1.8 Å X-ray structure with chains A and B
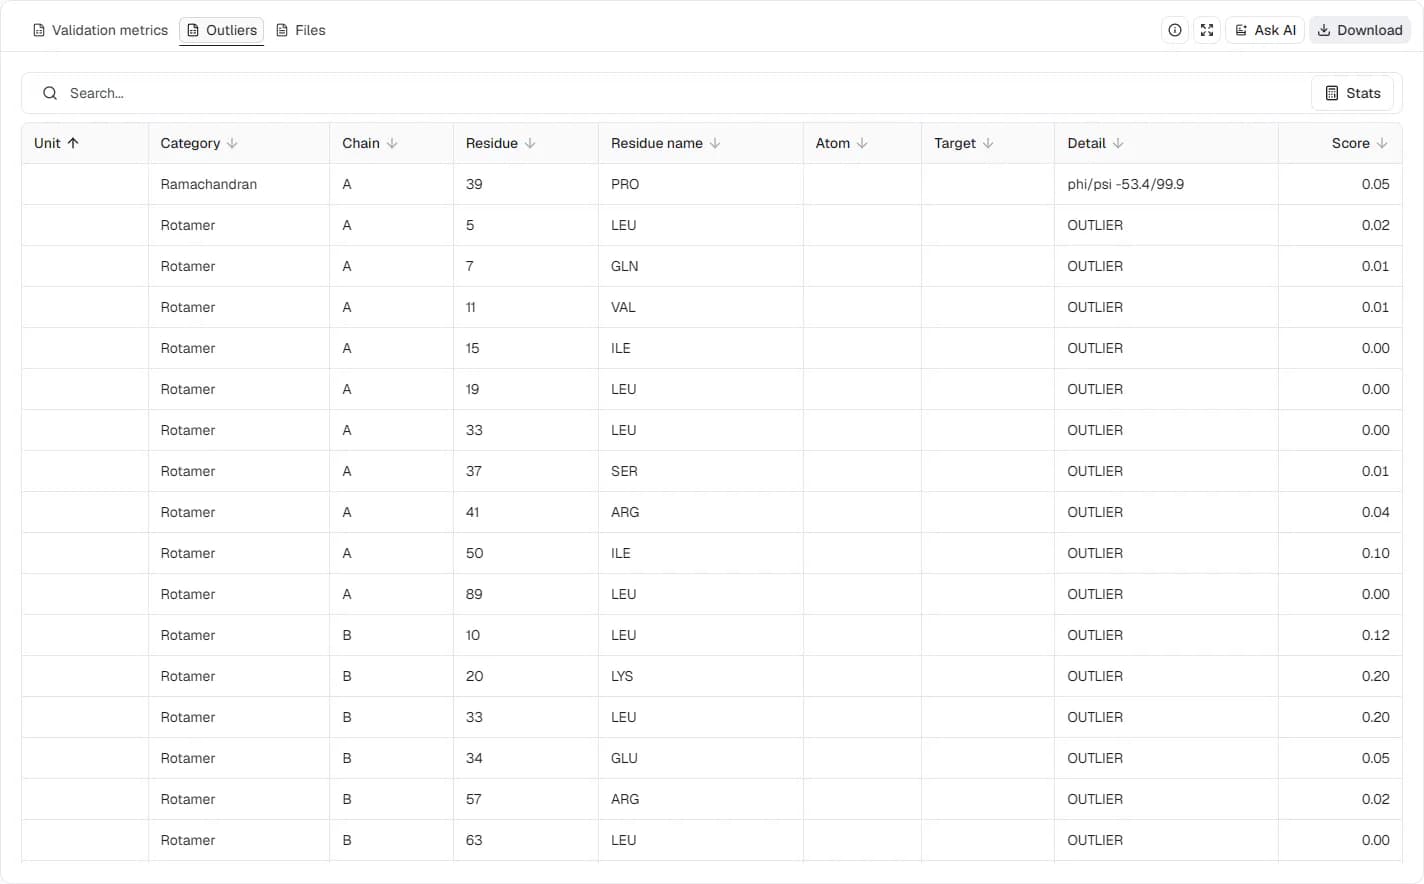
MolProbity returned a score of 1.75 and an excellent clashscore of 0.64 per 1000 atoms, but the 45-row outlier report also includes 13.0% Rotamer Outliers, 11 C-beta Deviations, a Ramachandran outlier at chain A Pro39, CaBLAM flags, and one twisted peptide. The contrast illustrates why a favorable composite score should not replace residue-by-residue review. A flagged site may reflect a modeling problem or an unusual local conformation and needs structural and experimental context.
SARS-CoV-2 spike cryo-EM backbone checks
The closed SARS-CoV-2 spike trimer in RCSB PDB 6VXX demonstrates validation of a much larger 2.8 Å cryo-EM model. CaBLAM is especially informative here because it evaluates backbone motifs from Cα and carbonyl geometry.
- Input: Closed-state SARS-CoV-2 spike glycoprotein from RCSB PDB
6VXX, a 2.8 Å cryo-EM structure with chains A, B, and C
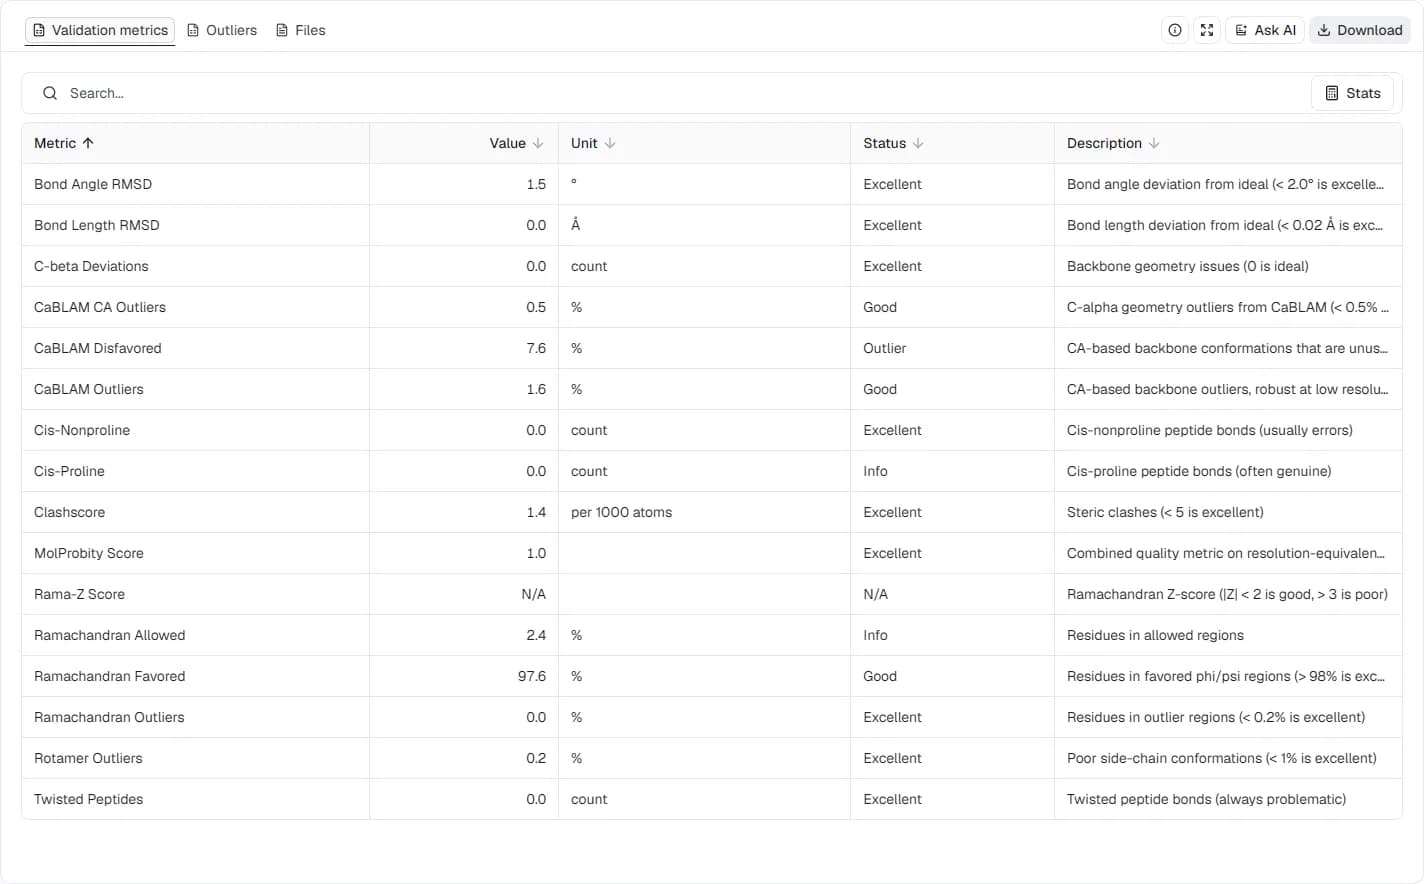
The overall table reports a MolProbity Score of 0.96, a clashscore of 1.39 per 1000 atoms, 97.6% Ramachandran Favored, and 0.2% Rotamer Outliers. The backbone-focused metrics are less uniformly favorable: CaBLAM Outliers is 1.62%, CaBLAM Disfavored is 7.58%, and CaBLAM CA Outliers is 0.54%.
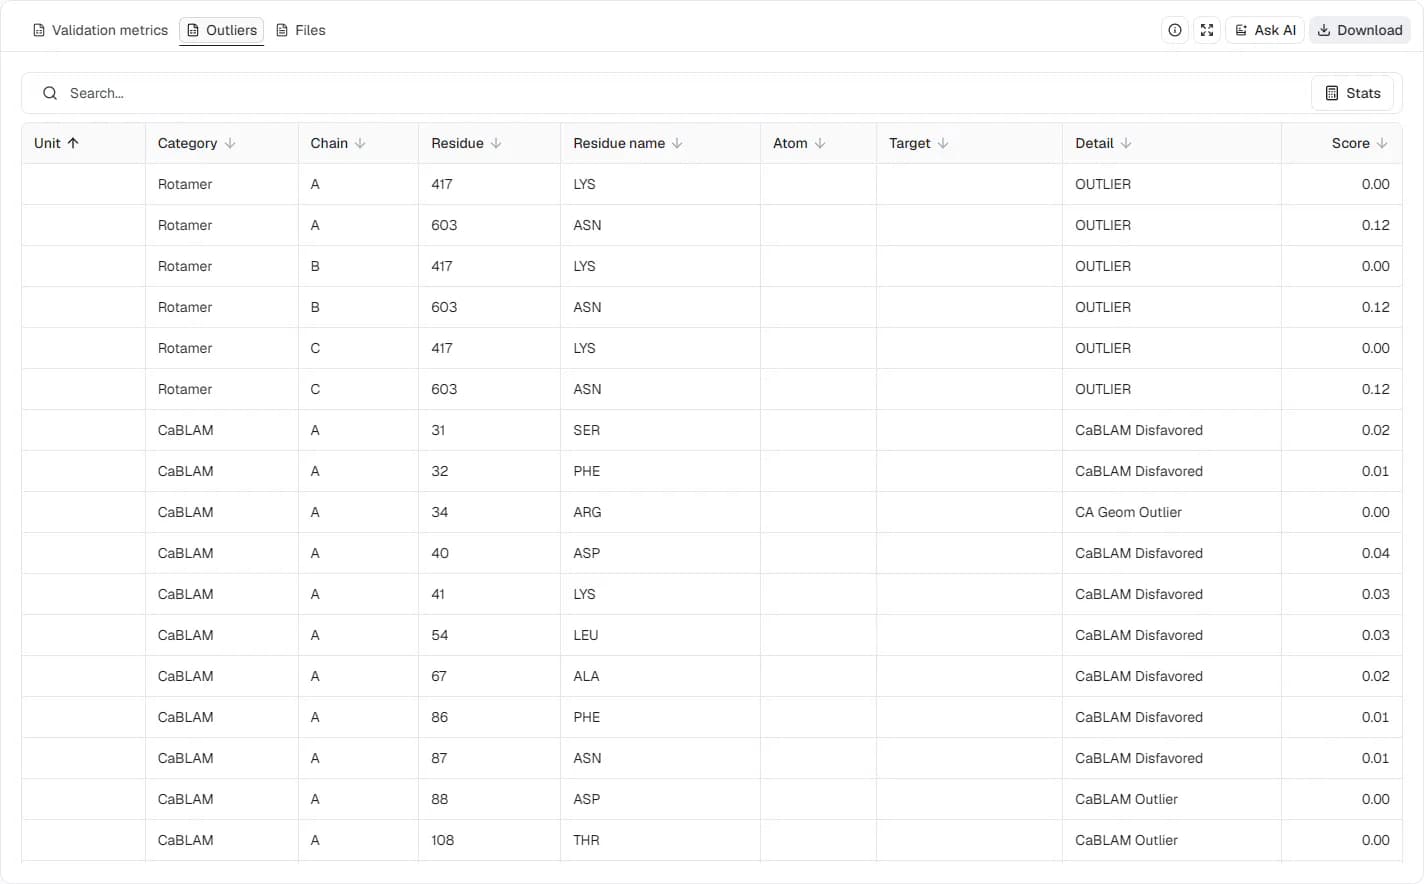
The 249-row outlier report identifies the chains and residues behind those percentages, including repeated rotamer flags across the trimer and CaBLAM backbone flags. These checks identify coordinates worth inspecting, but MolProbity does not evaluate the cryo-EM density map and the scores alone do not establish model accuracy.
Use cases and limitations
MolProbity works exceptionally well for crystal structures at 1.5-3.0 Å resolution where atomic positions are well-determined. For cryo-EM structures or low-resolution models, interpretation requires more caution.
Good uses include validating crystal structures, assessing quality of predicted structures from AlphaFold2 or Boltz-2, identifying problematic regions during refinement, and comparing multiple conformational states.
At very low resolution (>4 Å), geometric metrics become less informative because electron density ambiguity itself can cause apparent clashes or deviations. For designed proteins or synthetic sequences with no evolutionary precedent, some metrics may be overly strict.
Interpreting predicted structures
Predicted models from AlphaFold2 or Boltz-2 usually score very well because their geometry is relaxed, so a good MolProbity score shows clean geometry rather than an accurate prediction. Read the results alongside the model's confidence scores, such as pLDDT.
Related tools

DockQ
Assess docking quality between model and native structures

PDBsum
Generate structural summary reports and diagrams for a single protein PDB structure.

DeepRank-GNN-esm
Score every protein interface with ESM-2 and a graph neural network

IPSAE
Score interprotein interactions in AlphaFold and Boltz predictions

PoseBusters
Validate generated and docked ligand poses with structure, chemistry, and reference-pose checks.

pyRMSD
Pairwise RMSD matrices for PDB structure ensembles

AllMetal3D
Predict metal and water binding sites in proteins with 3D CNN models.

LocScale
Physics-informed local sharpening for cryo-EM density maps.

PRODIGY
Predict protein-protein binding affinity from structure

SuperWater
Diffusion-based hydration site prediction for protein structures