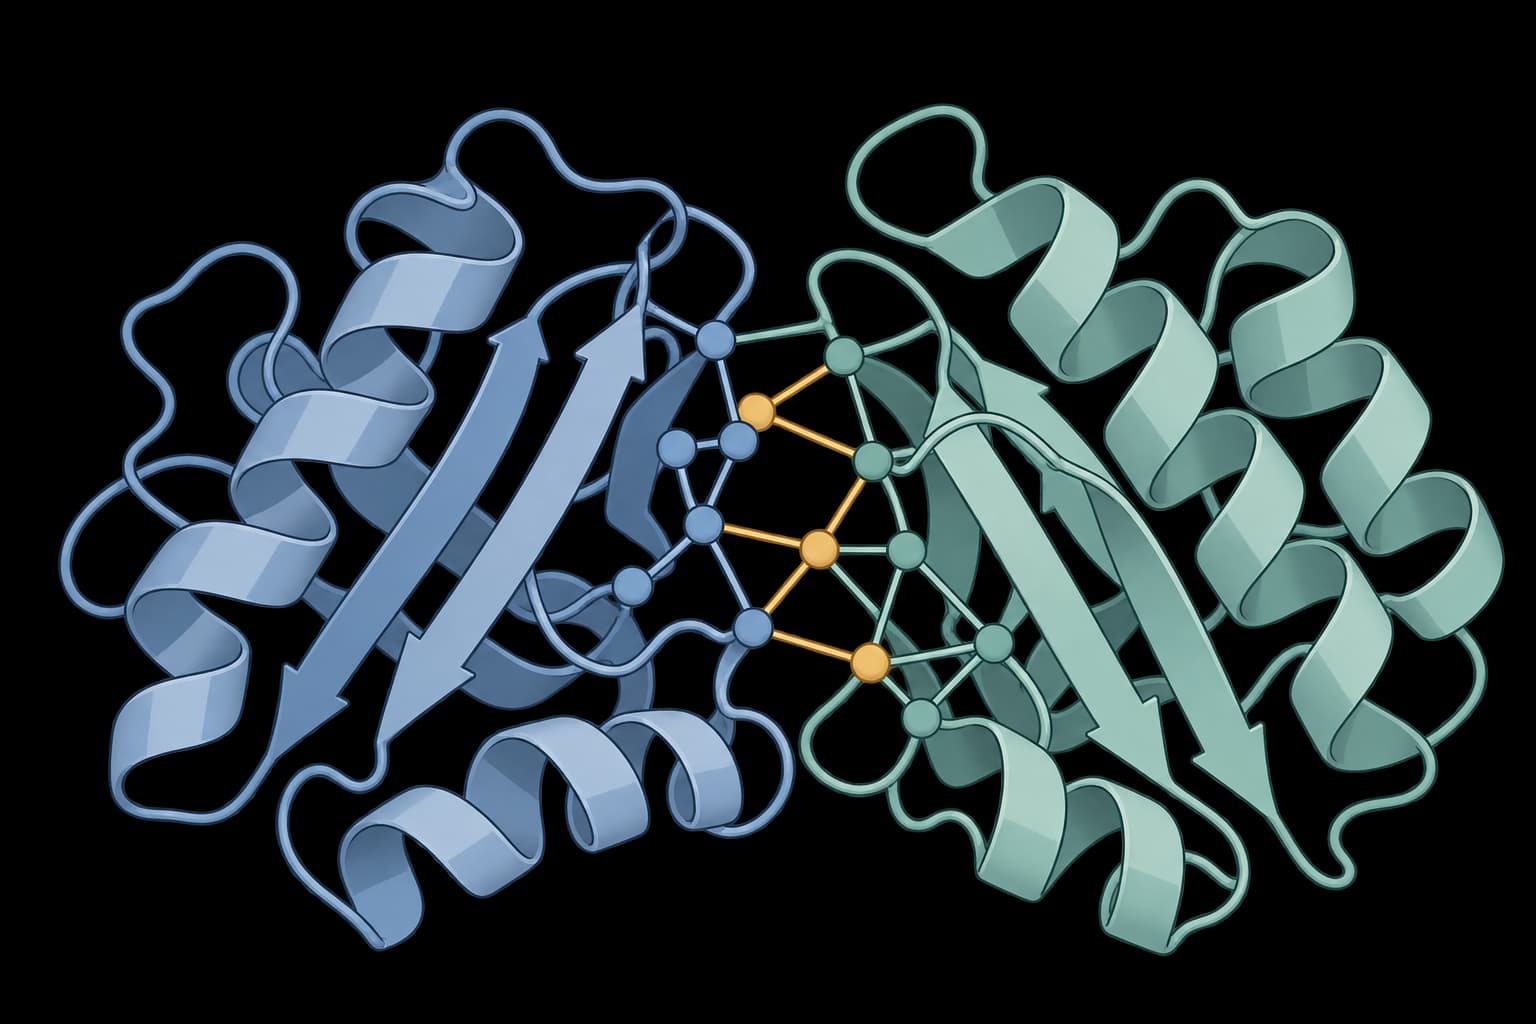
DeepRank-GNN-esm
Score every protein interface with ESM-2 and a graph neural network
Input
DeepRank-GNN-esm webserver overview
DeepRank-GNN-esm 2.0.0 scores protein complex interfaces using a graph neural network and ESM-2 sequence features. It predicts the fraction of native contacts for each chain pair in every submitted model, without requiring a reference structure.
Pricing
Runs cost 27 credits per minute of measured runtime. The minimum reservation is 27 credits, not a minimum final charge. Completed runs are charged in proportion to elapsed time, rounded up to a whole credit; unused reserved credits are returned. Set a spending limit before submission. Each batch job is metered separately.
Inputs
| Input | Accepted values | Details |
|---|---|---|
| Protein complexes | One or more .pdb or .ent files, or PDB structures fetched from RCSB | Each file can contain multiple models. |
| File size | Up to 50 MiB per file and 50 MiB total per submission | Larger collections must be split into separate jobs. |
| File names | Unique names without directory paths | Names must also be unique after removing the extension; complex.pdb and complex.ent cannot be submitted together. |
| Free accounts | Up to 1,000 polymer residues per job | Counts residues across input files, using the first model of each file. Paid plans do not have this plan-wide residue cap. |
DeepRank-GNN-esm scores every unordered chain pair in each model. A three-chain model has three pairs. A collection containing only single-chain structures cannot be scored. Nonstandard residues are represented as X and produce a warning; they are not officially supported by the method. Interfaces without suitable contacts can cause the run to fail, including when other submitted interfaces are valid.
The webserver uses fixed analysis settings.
Outputs
The results appear in the Interfaces and Model summary tables. The Files tab contains the downloadable artifacts below.
| Result | Contents |
|---|---|
| Interfaces | pdb_id, chain_i, chain_j and predicted_fnat for each scored pair. |
| Model summary | pdb_id and combined_fnat for each model. |
| Prediction CSVs | GNN_esm_prediction.csv and GNN_esm_prediction_summary.csv, containing the interface and model summary tables. |
| Prediction HDF5 | GNN_esm_prediction.hdf5, retaining unrounded predictions and their native metadata. |
| Original input structures | Unchanged copies of submitted PDB/ENT files. |
| Prepared chain-pair structures | PDB files under structures/, containing the two chains used for each interface. Residues are renumbered and chains relabeled A/B by DeepRank-GNN-esm. The score table retains the original chain identifiers. |
| Graph and logs | graph.hdf5, stdout.log and stderr.log, including graph data, progress, warnings and errors. |
Workflow outputs distinguish original input structures from prepared chain-pair structures. Either structure output can feed compatible structure tools. Prediction files, graphs and logs have a separate output. Temporary ESM .pt files are used during calculation and are not saved as downloads.
Understanding results
predicted_fnat estimates the fraction of native contacts for an interface. Higher values indicate a higher predicted fraction; the score is a model prediction, not a measured comparison with a known native structure.
combined_fnat is the sum of the unrounded interface predictions for a model. It can exceed 1 and depends on the number of chain pairs. Both CSV tables report three decimal places, so summing the displayed interface values can differ slightly from the model summary. Ensemble model names include a model suffix to distinguish their results.
Method and software details are available in the DeepRank-GNN-esm paper and the version 2.0.0 source documentation.
Related tools
IPSAE
Score interprotein interactions in AlphaFold and Boltz predictions
DockQ
Assess docking quality between model and native structures
MolProbity
Validate protein structures with clashscore, Ramachandran, rotamer, and geometry checks.
PDBsum
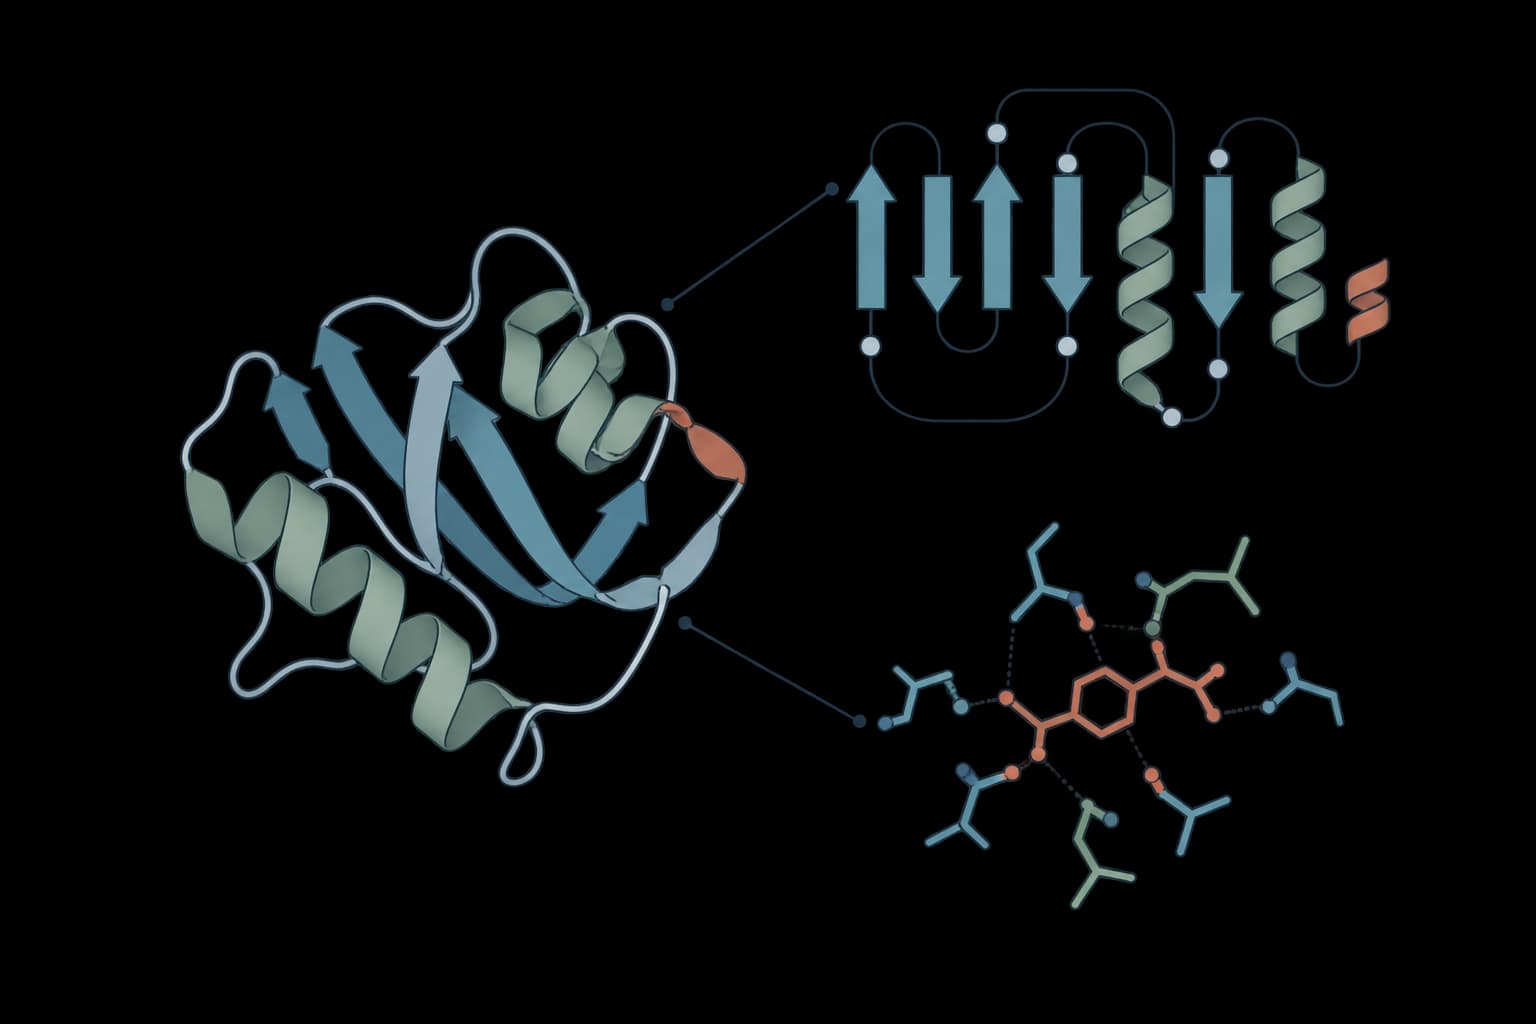
Generate structural summary reports and diagrams for a single protein PDB structure.
PoseBusters
Validate generated and docked ligand poses with structure, chemistry, and reference-pose checks.
PLIP
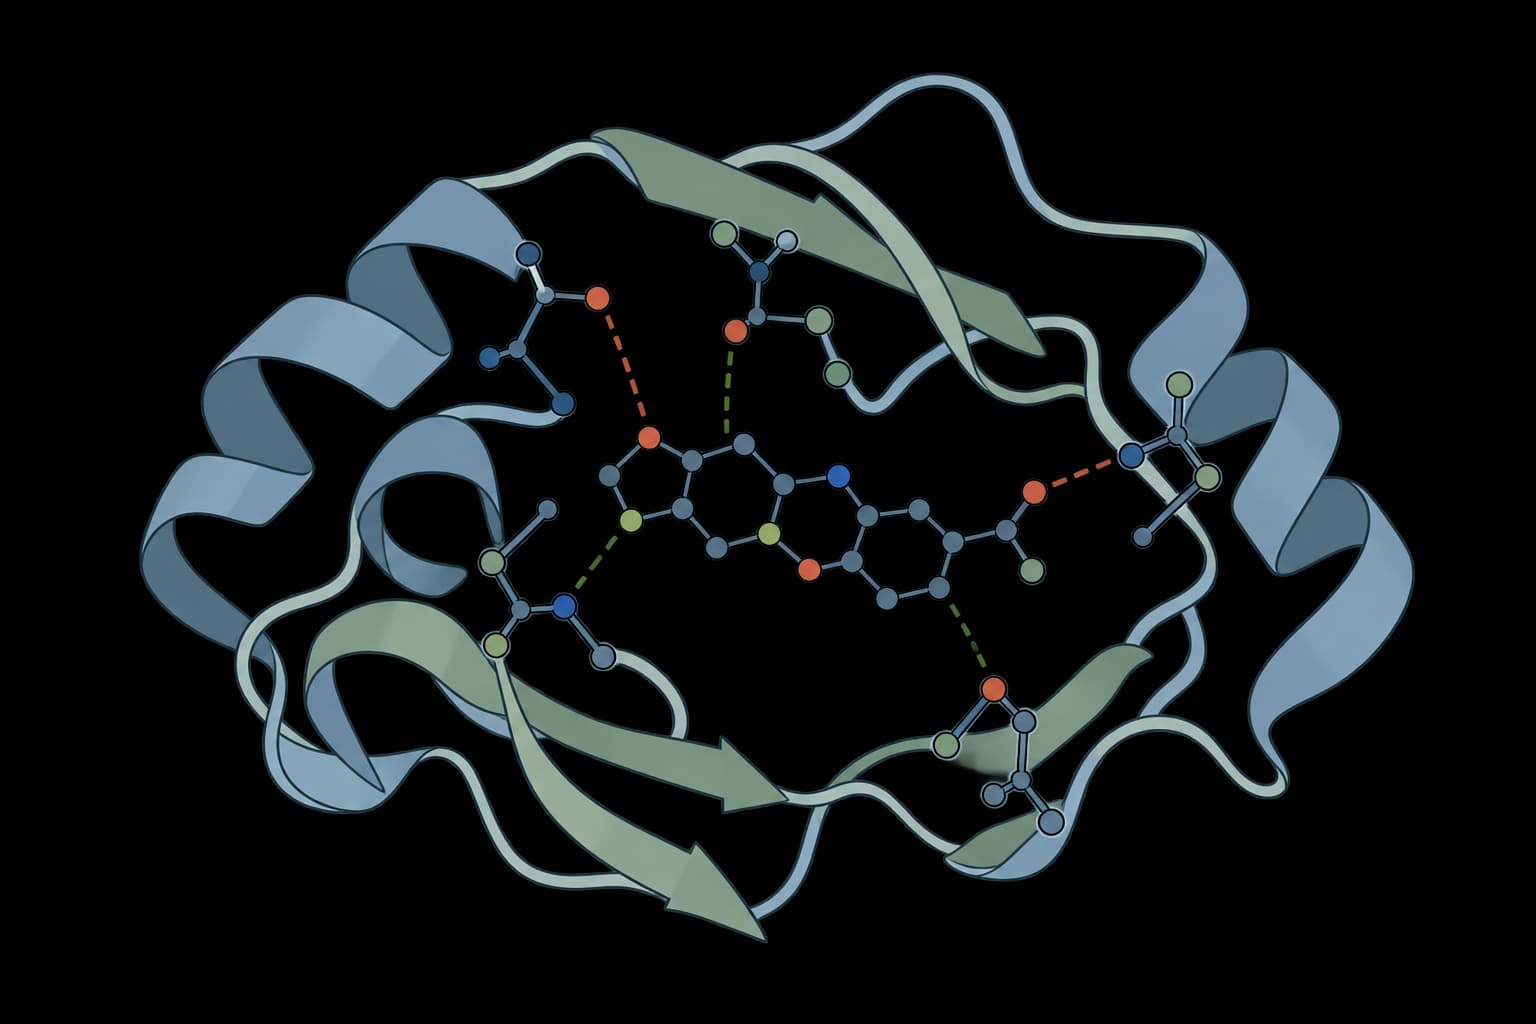
Profile protein-ligand interactions from a PDB complex structure.
StaB-ddG
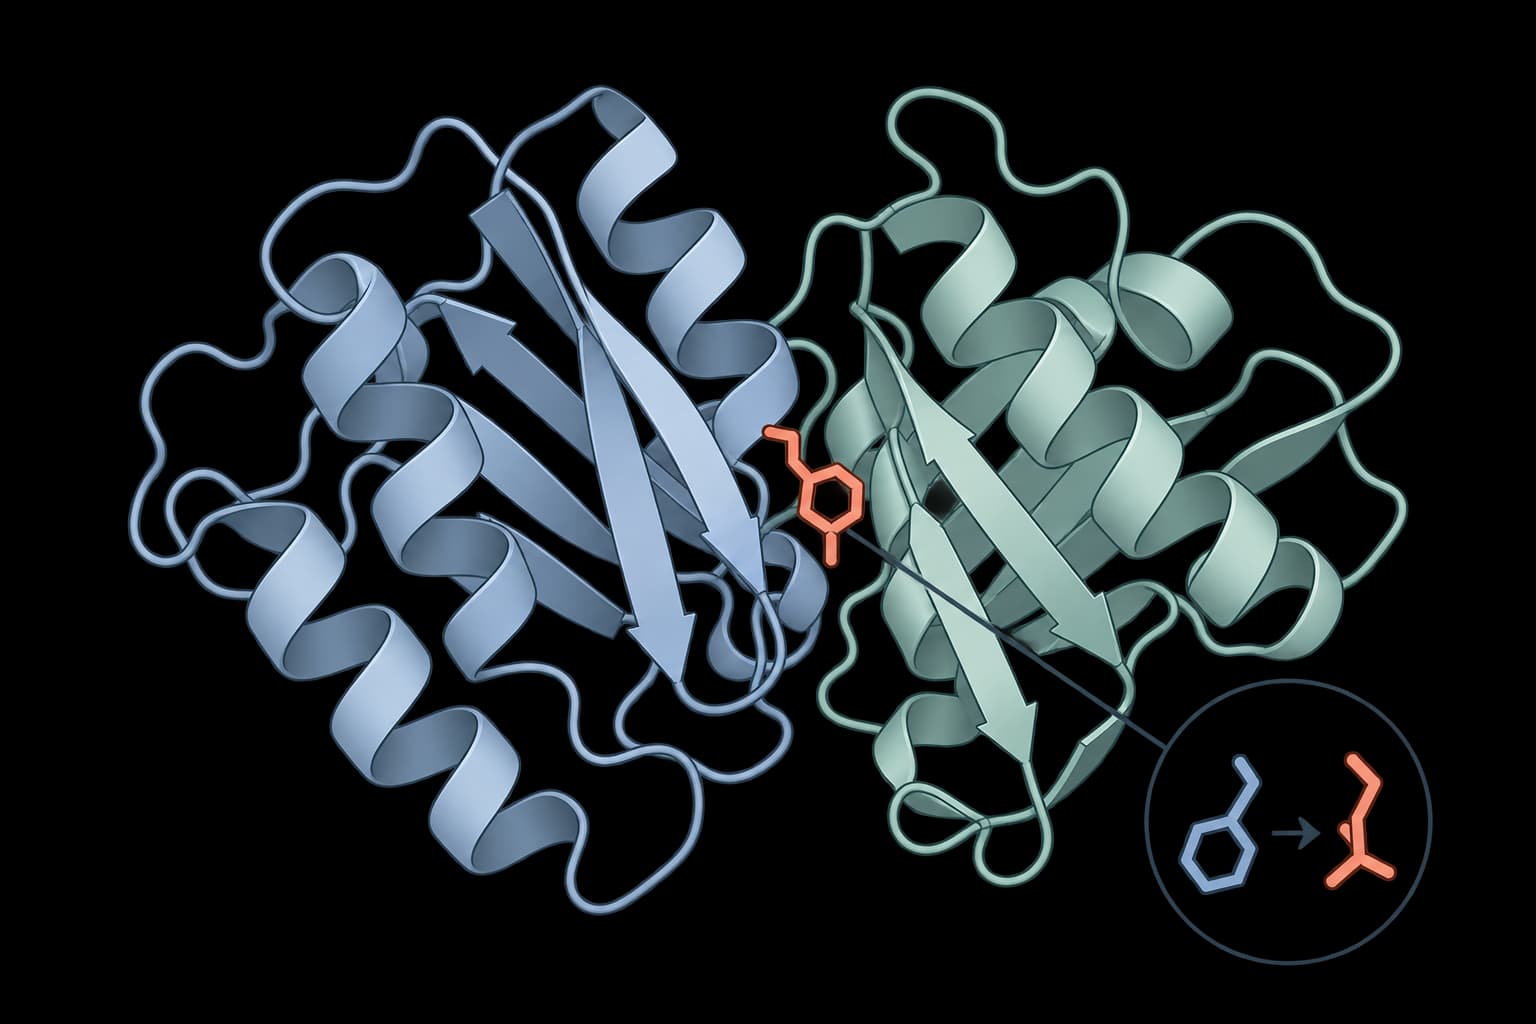
Predict mutation effects on protein binding
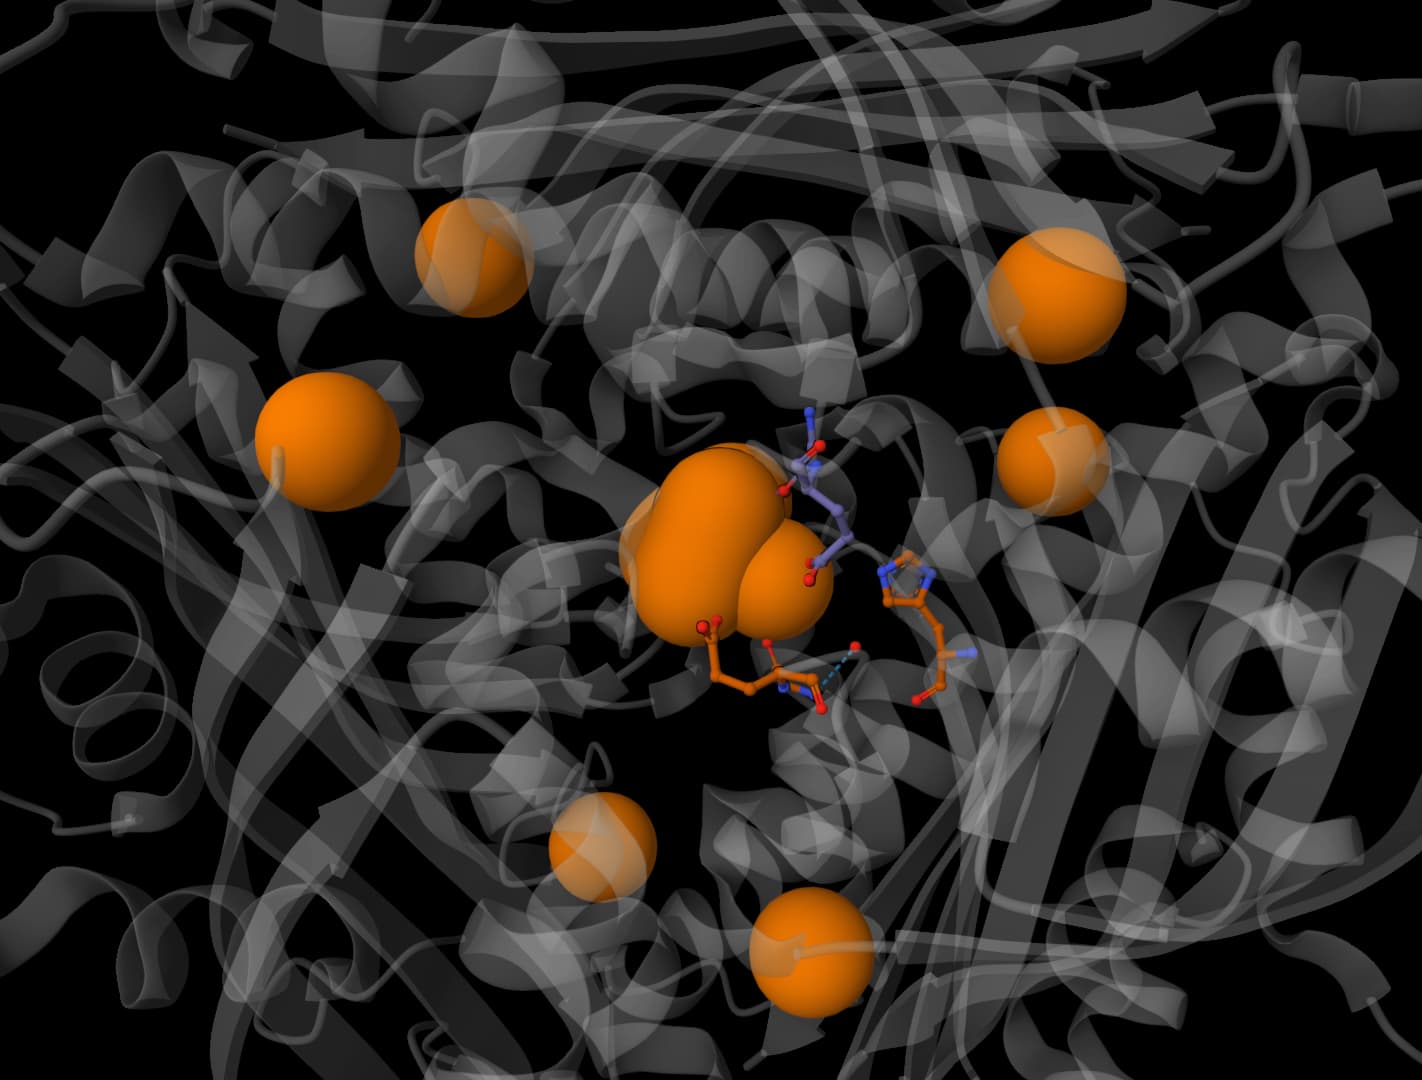
AllMetal3D
Predict metal and water binding sites in proteins with 3D CNN models.
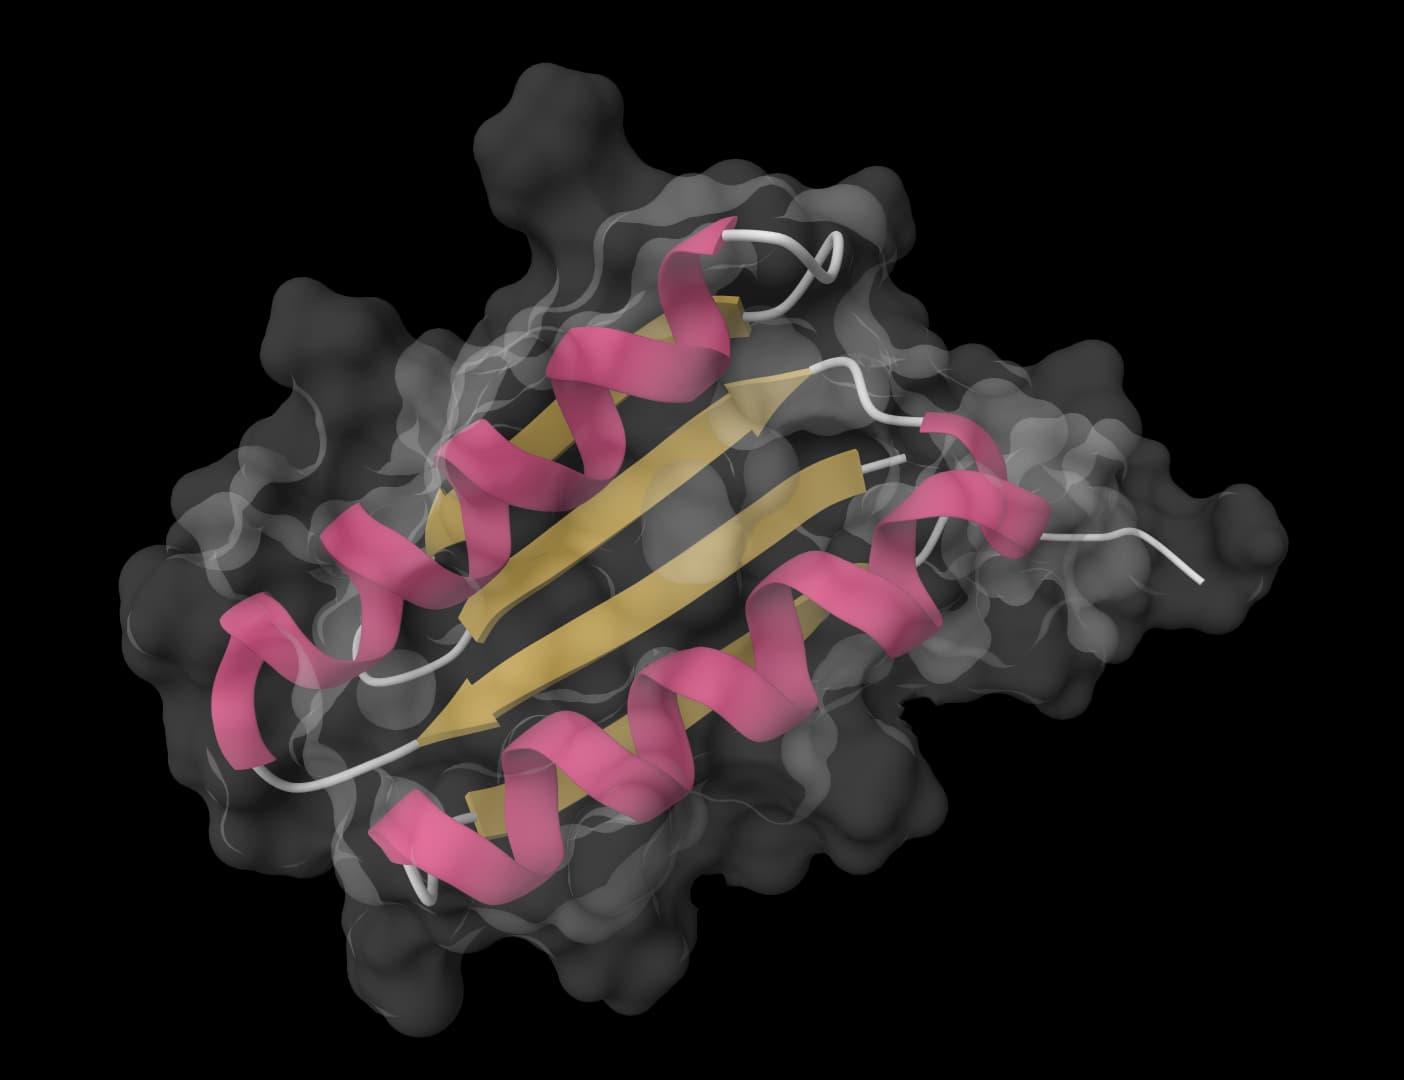
DSSP
Assign helices, sheets, turns, bends, and PPII structure from atomic coordinates.
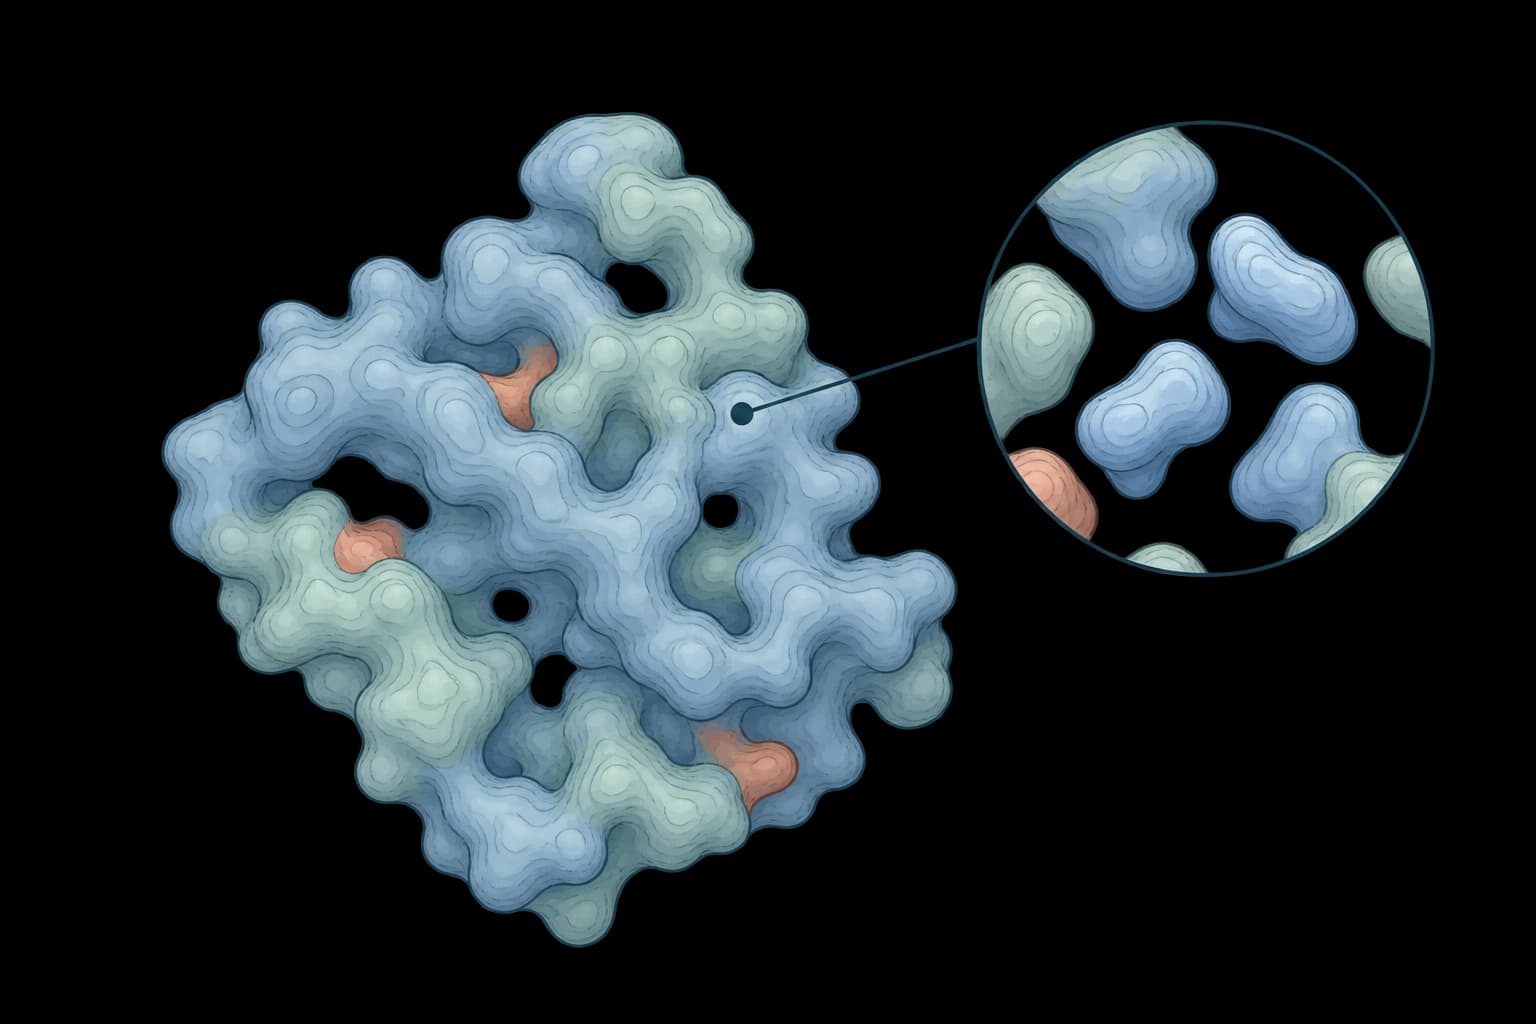
LocScale
Physics-informed local sharpening for cryo-EM density maps.