MolProbity
CCTBX 2026.4Validate protein structures with clashscore, Ramachandran, rotamer, and geometry checks.
Validate protein structures with clashscore, Ramachandran, rotamer, and geometry checks.
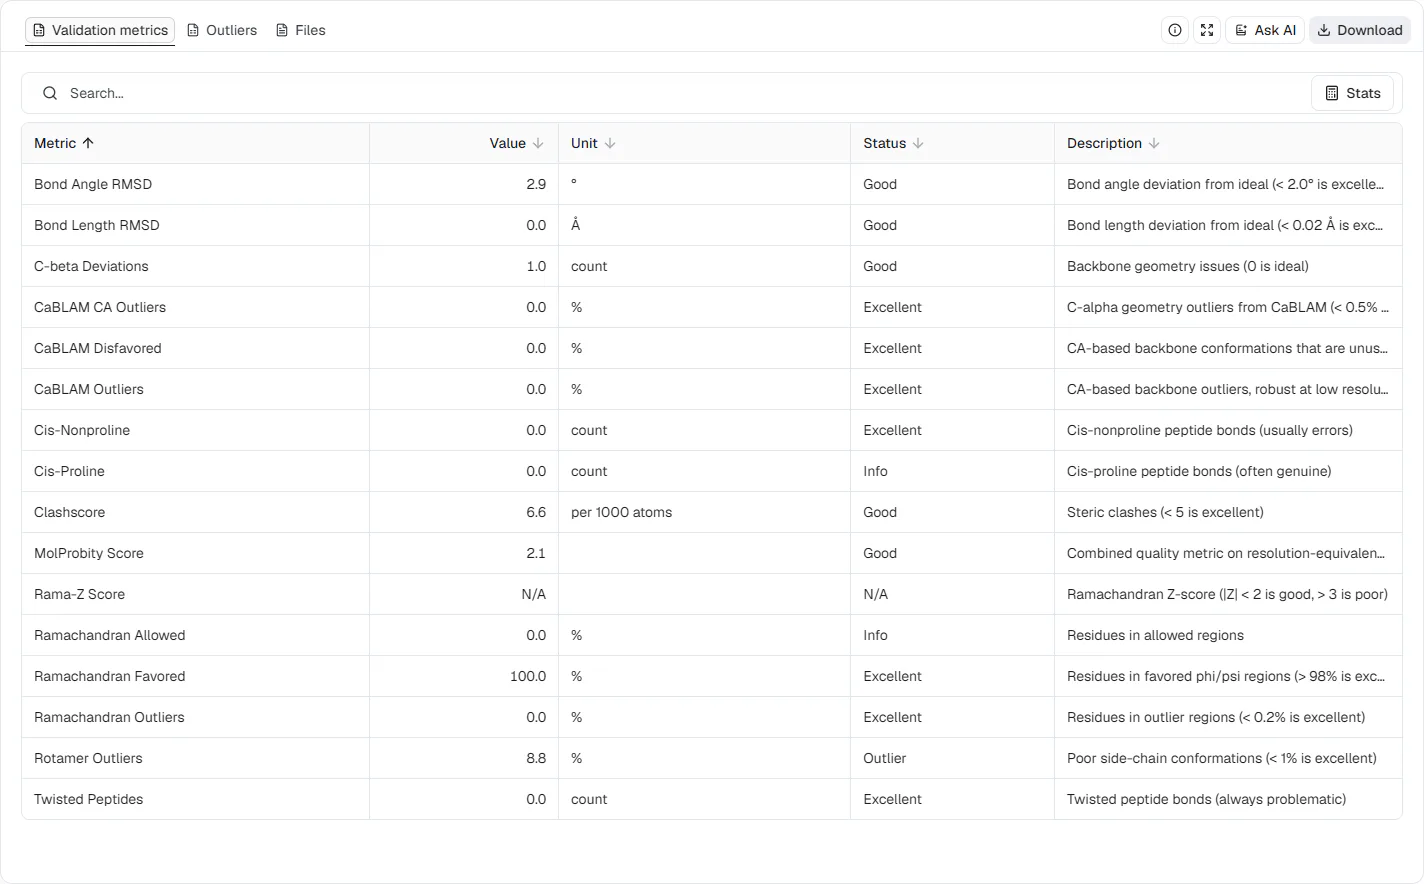
Ubiquitin is about as well behaved as a protein structure gets, yet the 1.8 Å crystal structure 1UBQ returns a MolProbity score of 2.09 on this server. That is what an average 2.1 Å structure would score, and the reason is visible one row down: 8.8% of its side chains are rotamer outliers. MolProbity finds this kind of problem by checking whether every atom sits where physics allows relative to its neighbors, not whether it fits the experimental map.
The ProteinIQ MolProbity server runs MolProbity, the all-atom structure validation method from the Richardson lab at Duke University, in its CCTBX 2026.4 implementation, with Reduce adding hydrogens and Probe measuring all-atom contacts. Its Ramachandran and rotamer criteria come from about a million quality-filtered residues in the Top8000 reference data, and the same validation runs in Phenix and at the worldwide Protein Data Bank (Williams et al., 2018). The report works for crystal structures, cryo-EM models and predictions from AlphaFold2, ESMFold or Boltz-2.
Upload a PDB or mmCIF file or enter an RCSB PDB ID, and the job returns clashscore, Ramachandran, rotamer, Cβ, CaBLAM, Rama-Z, peptide-bond and covalent-geometry checks, the combined MolProbity score, and a residue-level outlier table. The analysis runs at MolProbity's defaults, so a run needs only the structure.
A MolProbity job costs a 10-credit base plus 1 credit for each structure model in the submitted file, so a typical single structure costs 11 credits. There are no settings that change the price, and the exact quote appears before submission.
| Submitted structure | Credits |
|---|---|
| Single-model PDB file, mmCIF file, or RCSB PDB ID | 11 |
| Multi-model PDB file with 2 models | 12 |
| Multi-model PDB file with 10 models | 20 |
| Multi-model PDB file with 20 models, such as an NMR ensemble | 30 |
Each MODEL record in a PDB file counts as one model. An mmCIF file is priced as one structure whatever its model count. In a batch, each structure runs as its own job and is priced separately.
| Input | Accepted values | Limits |
|---|---|---|
Protein Structure | PDB (.pdb, .ent), mmCIF (.cif, .mmcif), or an RCSB PDB ID such as 1UBQ | One structure per job, up to 50 MB. A batch can collect up to 10 structures. |
RCSB IDs are fetched as PDB files. Multi-model PDB files, such as NMR ensembles, are accepted and passed to MolProbity with all their models. For proteins, complete backbone atoms (N, Cα, C, O) give the most complete validation.
MolProbity builds geometry restraints for every residue from the CCTBX chemical dictionaries, so some files are rejected before the run. These include duplicate atom names within a residue, generic ligand names (LIG, UNL, UNK, MOL, DUM, XXX, ORI), four-character residue names in PDB files, and the force-field histidine names HSD, HSP, HID and HIE. HIS, HSE and HIP are accepted.
A ligand with no dictionary entry, which includes many ligands deposited in the PDB, stays in the model without geometry restraints, as in phenix.molprobity. Its atoms still count in the clashscore, but it gets no bond or angle checks, and ProteinIQ does not accept custom ligand restraint files. Generic names such as LIG usually come from docking or simulation exports; the ligand needs its real component code, or must be removed, before validation.
MolProbity has no scientific settings on ProteinIQ. Each run uses the MolProbity defaults: hydrogens already in the file are kept, Reduce adds hydrogens to models deposited without them, side chains are scored against the Top8000 rotamer library, and the text report lists outliers only.
| Parameter | Type | Default | Description |
|---|---|---|---|
Job name | string | Structure validation | Label for the saved job. It does not change the analysis. |
| Output | Contents |
|---|---|
Validation metrics | One row per metric with its Value, Unit, Status and a short Description. |
Outliers | One row per flagged residue or atom contact with Category, Chain, Residue, Residue name, Atom, Target, Detail, Score and Unit. |
Files | _molprobity_summary.csv, _molprobity_outliers.csv, the full text report (_molprobity_full_report.out), Probe dots (_molprobity_probe.txt) and a Coot script (_molprobity_coot.py) when generated, and run.log. |
The run.log summarizes structure size, validation phases, headline scores and the number of outliers; raw Probe output stays in its own file. The Coot script loads the flagged sites into Coot for manual rebuilding. From a finished job, the input structure can be sent to the Ramachandran plot or to DSSP without uploading it again.
The MolProbity score combines clashscore, the percentage of rotamer outliers and the percentage of residues outside the Ramachandran favored regions into one number scaled to crystallographic resolution (Chen et al., 2010). Lower is better. A score below the structure's resolution means the model is better than an average structure at that resolution: 1HVR, a 1.8 Å structure, scores 1.75, while 1UBQ at 1.8 Å scores 2.09.
The formula ignores the first 1% of rotamer outliers and the first 2% of non-favored Ramachandran residues, so a model with no clashes that meets both levels scores the floor of 0.5. Cβ deviations, CaBLAM, Rama-Z and covalent geometry do not enter the score, which is why a good score can sit beside other problems in the same report. NMR models and predictions have no resolution, so judge them by the individual goals below.
Clashscore is the number of serious all-atom overlaps, 0.4 Å or more between atoms that are not hydrogen-bonded, per 1,000 atoms after hydrogens have been added. One misplaced side chain can produce several clashes with its neighbors, so a clashscore of 10 does not mean 1% of the structure is wrong. Each clash appears in the outlier table as a Clash row with both atoms and the overlap in Å.
The Duke MolProbity server judges clashscore and MolProbity score by percentile against structures of similar resolution, with 66 or above shown as good and below 33 as a warning. ProteinIQ reports the values without percentiles and flags them against fixed cutoffs, listed in the status table below.
Ramachandran favored is the share of residues whose φ and ψ angles fall inside the contour holding 98% of high-quality reference data, so MolProbity's goal is above 98% favored and at most 0.05% outliers. Rotamer outliers are side chains whose χ angles occur in fewer than 0.3% of good reference side chains; the goal is at most 0.3%. The Ramachandran plot shows where each residue falls.
A Cβ deviation is counted when the modeled Cβ atom sits more than 0.25 Å from the position its backbone predicts. A deviation that large usually points to local misfitting of the backbone or side chain, and the goal is zero.
CaBLAM checks backbone peptide orientation from Cα and carbonyl geometry and is more reliable than Ramachandran analysis at the 2.5 to 4 Å resolutions common in cryo-EM, where refinement restraints can make the other criteria look better than the model is (Prisant et al., 2020).
Rama-Z compares the whole Ramachandran distribution with the expected one, so it can flag a model with no outliers whose overall distribution is still unlikely, a sign of overfitting (Sobolev et al., 2020). Values within ±2 are normal and beyond ±3 are unlikely. Cis-proline peptides are often genuine; cis-nonproline and twisted peptides are rare enough in real proteins that each one deserves a look.
Each metric carries Excellent, Good or Outlier from ProteinIQ's fixed cutoffs, Info when no cutoff applies (Ramachandran allowed, cis-proline), or N/A when the value could not be computed. MolProbity's own goals, from its summary table guide, are stricter for several rows.
| Metric | Excellent | Good | MolProbity goal |
|---|---|---|---|
| MolProbity score | ≤ 1.5 | ≤ 2.5 | Percentile ≥ 66 at similar resolution |
| Clashscore | ≤ 5 | ≤ 20 | Percentile ≥ 66 at similar resolution |
| Ramachandran favored | ≥ 98% | ≥ 95% | ≥ 98% |
| Ramachandran outliers | ≤ 0.2% | ≤ 1.0% | ≤ 0.05% |
| Rama-Z | |Z| < 2 | |Z| < 3 | |Z| ≤ 2 |
| Rotamer outliers | ≤ 1% | ≤ 4% | ≤ 0.3% |
| Cβ deviations | 0 | ≤ 5 | 0 |
| CaBLAM outliers | ≤ 1% | ≤ 5% | ≤ 1% |
| CaBLAM CA outliers | ≤ 0.5% | ≤ 2% | ≤ 0.5% |
| CaBLAM disfavored | ≤ 2% | ≤ 5% | No separate goal |
| Cis-nonproline, twisted peptides | 0 | Not used | ≤ 0.05% cis; 0 twisted |
| Bond and angle RMSD | ≤ 0.02 Å, ≤ 2.0° | ≤ 0.03 Å, ≤ 3.0° | No RMSD goal; MolProbity counts outlier bonds and angles |
Anything worse than Good is flagged Outlier. The Richardson lab's advice applies to every row: an outlier is not necessarily a mistake, and the aim is an outlier you can justify, not a perfect table.
The Category column names the check: Ramachandran rows give φ/ψ in Detail, Rotamer rows the rotamer name, Omega rows the peptide type and angle, Clash rows the second atom in Target and the overlap, C-beta rows the deviation in Å, and CaBLAM rows the outlier type. Covalent bond and angle outliers, and RNA bond, angle, sugar pucker and suite outliers when nucleic acids are present, use their own categories.
Sort by chain and residue to find where problems cluster. Several categories pointing at the same few residues usually mean a local fitting error worth rebuilding; an isolated flag at a known active site or ligand contact may be a genuine strained conformation.
Predicted models from AlphaFold2 or Boltz-2 often score better than experimental structures because their geometry is relaxed. The AlphaFold Database model of sperm whale myoglobin, for example, scores the floor of 0.5 with no clashes or rotamer outliers. A clean report shows that the geometry is physical, not that the prediction is right, so read it alongside pLDDT and the predicted aligned error (structure prediction confidence).
MolProbity is most informative on models that skipped a relaxation step, such as designs, docked complexes, threaded mutants and hand-edited structures, where nothing guarantees clean contacts. Missing atoms can be rebuilt with PDB Fixer before validation.
MolProbity was developed in the Richardson lab at Duke University, which runs the original public server at molprobity.biochem.duke.edu. The Duke site has announced that it will move to MolProbity Next, hosted by the Berkeley Phenix project at molprobity.lbl.gov. ProteinIQ runs the CCTBX implementation of MolProbity with the Richardson lab's Reduce, Probe and Top8000 reference data.
The Duke server does more than this page. It can fetch X-ray data and electron density maps with the coordinates, validates NMR ensembles of up to 80 models in tabs, and adds hydrogens with Reduce, letting you review its Asn, Gln and His flips before downloading the modified model.
It also shows percentiles against similar-resolution structures and draws outliers on the model as kinemages or in an NGL view. MolProbity Next also takes ligand restraint CIF files and hydrogen-placement options. Its usage guidelines ask users to install MolProbity locally for batch runs.
ProteinIQ runs the core coordinate validation only. It does not return a hydrogenated or flip-corrected model, map or reflection-based checks, percentiles, kinemages or 3D outlier markup. What it adds is a saved job for every run, batches of up to 10 structures, metric and outlier tables with CSV downloads, the example jobs below, direct sending of the structure to the next analysis, and access through the ProteinIQ API on paid plans.
This example validates the compact, single-chain ubiquitin model deposited as RCSB PDB 1UBQ, a 1.8 Å X-ray structure. It is a concise introduction to the complete metrics table.
The submitted coordinates returned a MolProbity score of 2.09 and a clashscore of 6.64 per 1,000 atoms. Ramachandran favored is 100.0% with 0.0% outliers, so the score comes from clashes and the 8.8% rotamer outliers, and the outlier report contains 11 flagged residues or atom contacts. These results describe the deposited coordinates; they do not test agreement with the original diffraction data.
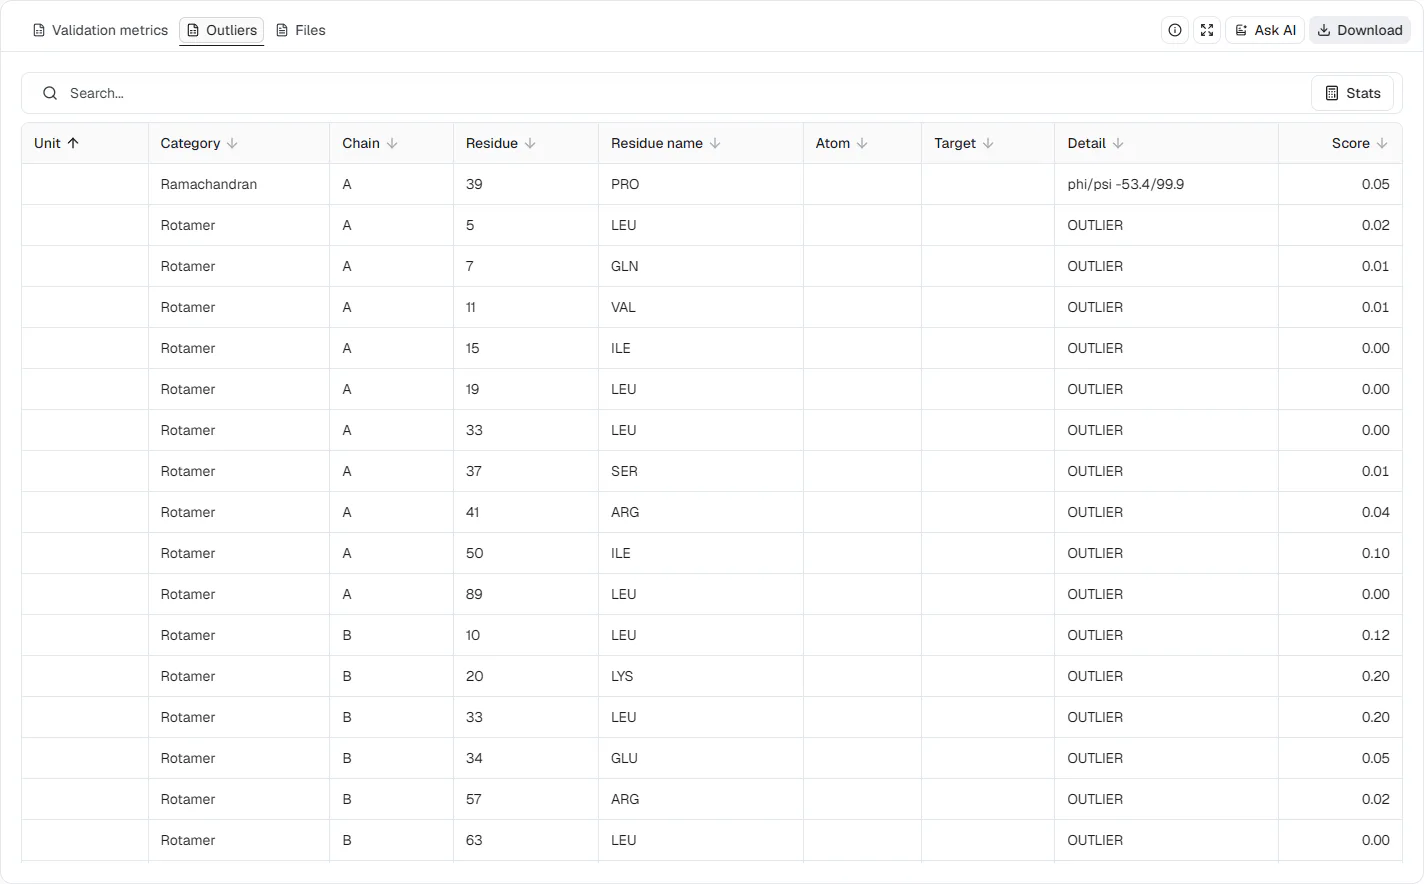
The 1HVR example is an inhibitor-bound, two-chain HIV-1 protease from a 1.8 Å X-ray structure. Its outlier table contains several validation categories, which makes it useful for learning how to prioritize local inspection.
MolProbity returned a score of 1.75 and a clashscore of 0.64 per 1,000 atoms, but the 45-row outlier report also includes 13.0% rotamer outliers, 11 Cβ deviations, a Ramachandran outlier at chain A Pro39, CaBLAM flags and one twisted peptide. A favorable composite score does not replace residue-by-residue review, and each flagged site still needs structural and experimental context.
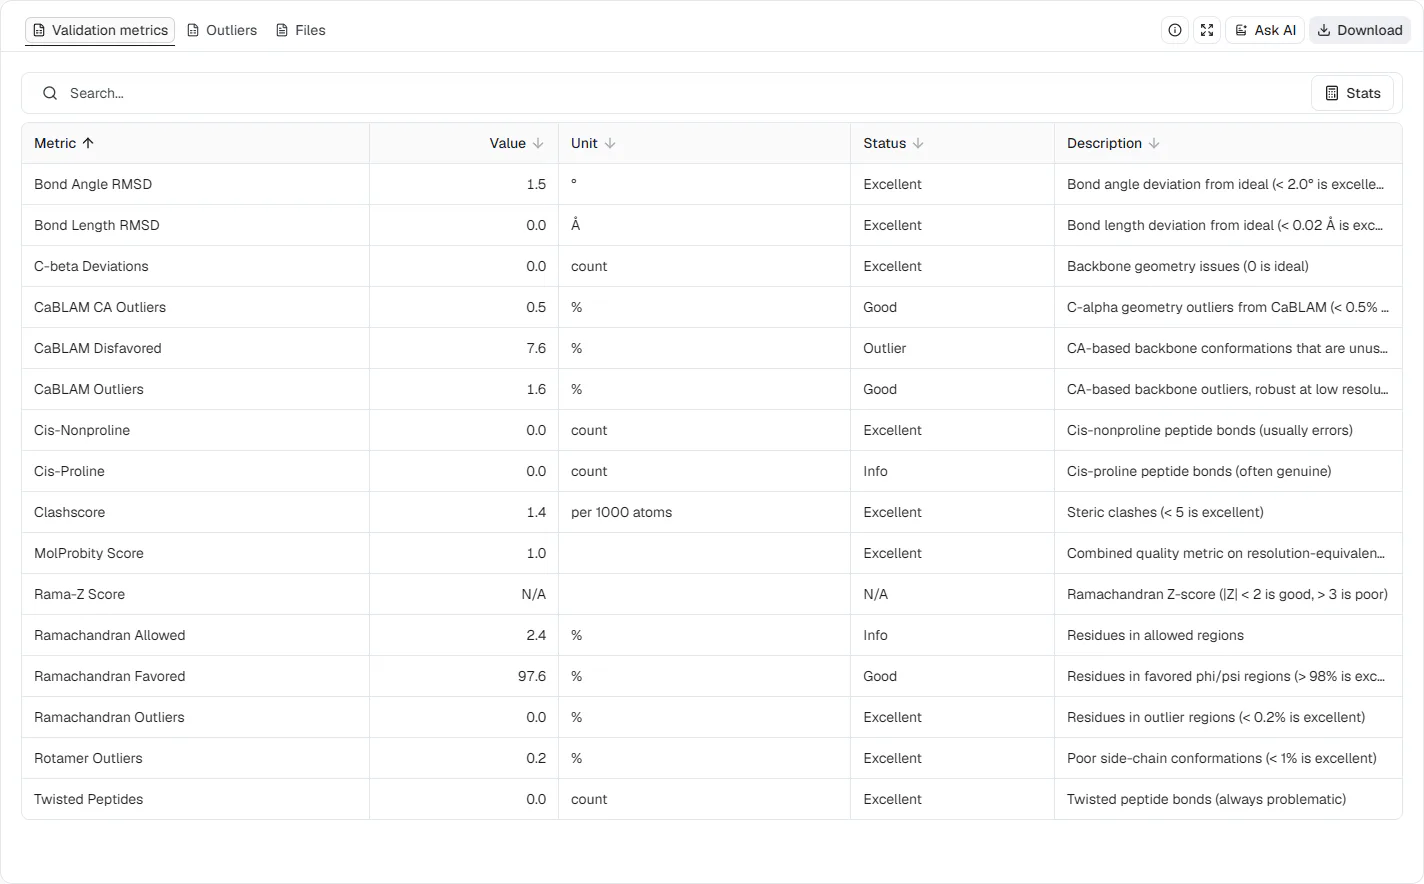
The closed SARS-CoV-2 spike trimer in RCSB PDB 6VXX is a much larger 2.8 Å cryo-EM model with chains A, B and C. CaBLAM is especially informative here because it evaluates backbone motifs from Cα and carbonyl geometry.
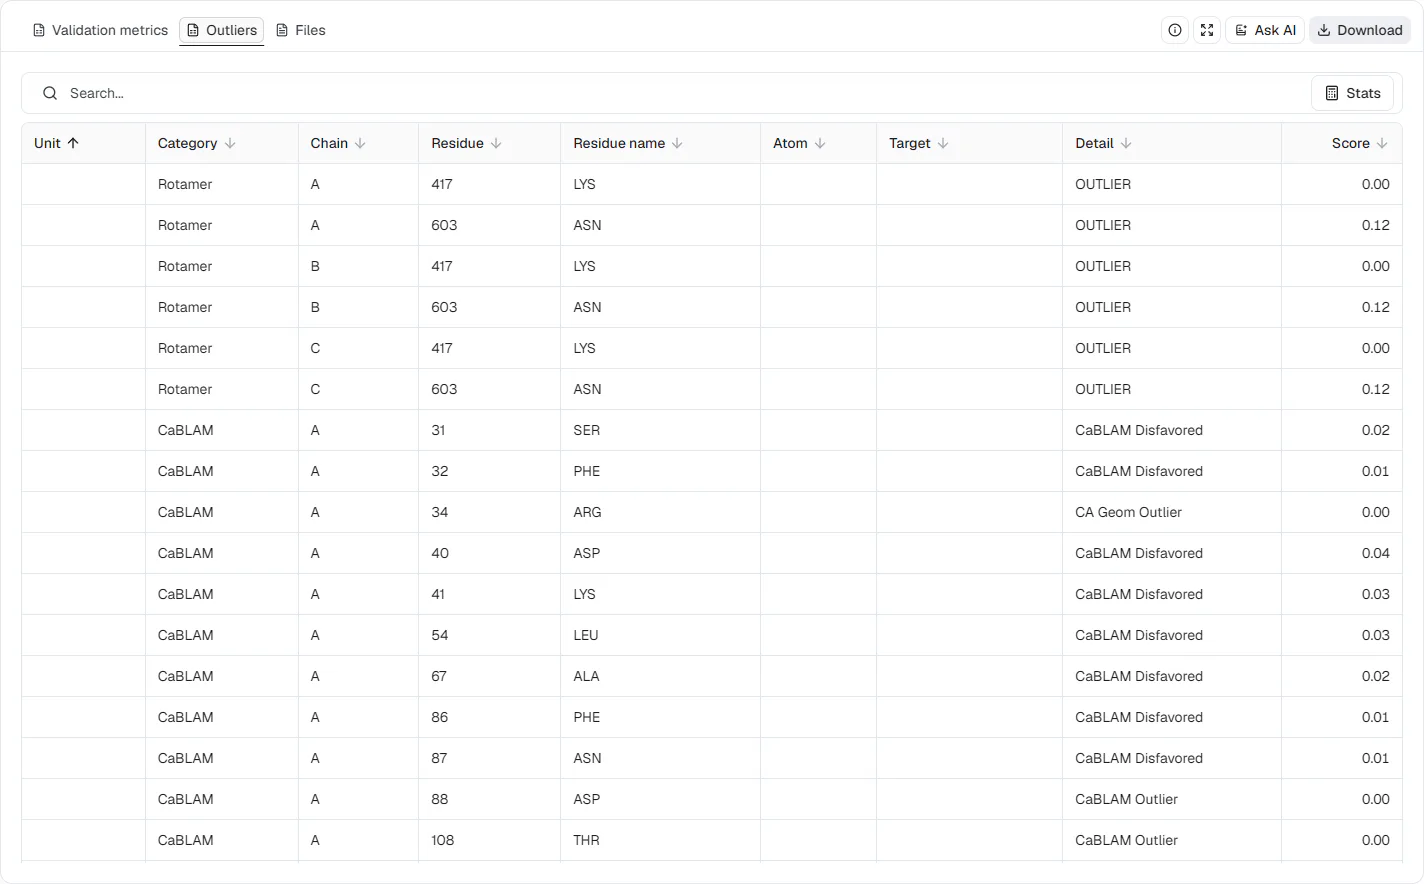
The overall table reports a MolProbity score of 0.96, a clashscore of 1.39 per 1,000 atoms, 97.6% Ramachandran favored and 0.2% rotamer outliers, far better than its resolution would predict. The backbone-focused metrics are less uniform: CaBLAM outliers are 1.62%, CaBLAM disfavored 7.58% and CaBLAM CA outliers 0.54%. Prisant et al. (2020) describe this pattern in cryo-EM models: refinement restraints can clean up clashes, rotamers and Ramachandran while backbone errors remain.
The 249-row outlier report identifies the chains and residues behind those percentages, including repeated rotamer flags across the trimer and CaBLAM backbone flags. These checks point to coordinates worth inspecting, but MolProbity here does not evaluate the cryo-EM density map, and the scores alone do not establish model accuracy.
MolProbity is most reliable for crystal structures between about 1.5 and 3.0 Å, where atomic positions are well determined. Below about 4 Å, density ambiguity weakens the all-atom checks, and refinement restraints can hide errors from them, so CaBLAM carries more of the weight. Designed proteins with no natural counterpart can also trip checks calibrated on natural structures.
All metrics come from coordinates alone. A model can pass every check here and still disagree with its experimental data, and a predicted model can pass and still be wrong in the regions that matter.
A serious clash is an overlap of 0.4 Å or more between the van der Waals surfaces of two atoms that are not hydrogen-bonded, measured by Probe after Reduce has added hydrogens. Clashscore is the number of serious clashes per 1,000 atoms, so lower is better, and each clash appears in the outlier table with both atoms and the overlap in Å.
A MolProbity score below the structure's resolution in Å is better than average for that resolution, and lower is always better. A model with no clashes, at most 2% of residues outside Ramachandran favored regions and at most 1% rotamer outliers scores the floor of 0.5 (Chen et al., 2010). Predicted models have no resolution, so judge them by the individual metrics.
MolProbity's rotalyze check gives each side chain a score: the percentage of Top8000 reference side chains of the same residue type that have similar χ angles. A score below 0.3% is a rotamer outlier, 0.3 to 2% is allowed and 2% or more is favored. On a Rotamer row of the outlier table, Score is that percentage and Detail names the nearest rotamer.
No. The original public server is run by the Richardson lab at Duke, and MolProbity Next is hosted by the Phenix project at Berkeley. ProteinIQ runs the same CCTBX validation on its own servers, as described in ProteinIQ and the Duke MolProbity server, and adds saved jobs, batches of up to 10 structures and CSV tables.
A single structure costs 11 credits: a 10-credit base plus 1 credit per model. A free account starts with 200 credits and is topped back up to 100 credits each month.
Chen VB, Arendall WB, Headd JJ, et al. (2010). MolProbity: all-atom structure validation for macromolecular crystallography. Acta Crystallographica Section D 66: 12-21. DOI: 10.1107/S0907444909042073
Williams CJ, Headd JJ, Moriarty NW, et al. (2018). MolProbity: more and better reference data for improved all-atom structure validation. Protein Science 27: 293-315. DOI: 10.1002/pro.3330
Prisant MG, Williams CJ, Chen VB, Richardson JS, Richardson DC. (2020). New tools in MolProbity validation: CaBLAM for CryoEM backbone, UnDowser to rethink "waters," and NGL Viewer to recapture online 3D graphics. Protein Science 29(1): 315-329. DOI: 10.1002/pro.3786
Sobolev OV, Afonine PV, Moriarty NW, et al. (2020). A global Ramachandran score identifies protein structures with unlikely stereochemistry. Structure 28(11): 1249-1258. DOI: 10.1016/j.str.2020.08.005

Assess docking quality between model and native structures

Generate structural summary reports and diagrams for a single protein PDB structure.

Score every protein interface with ESM-2 and a graph neural network

Score interprotein interactions in AlphaFold and Boltz predictions

Validate generated and docked ligand poses with structure, chemistry, and reference-pose checks.

Pairwise RMSD matrices for PDB structure ensembles

Predict metal and water binding sites in proteins with 3D CNN models.

Physics-informed local sharpening for cryo-EM density maps.

Predict protein-protein binding affinity from structure

Diffusion-based hydration site prediction for protein structures