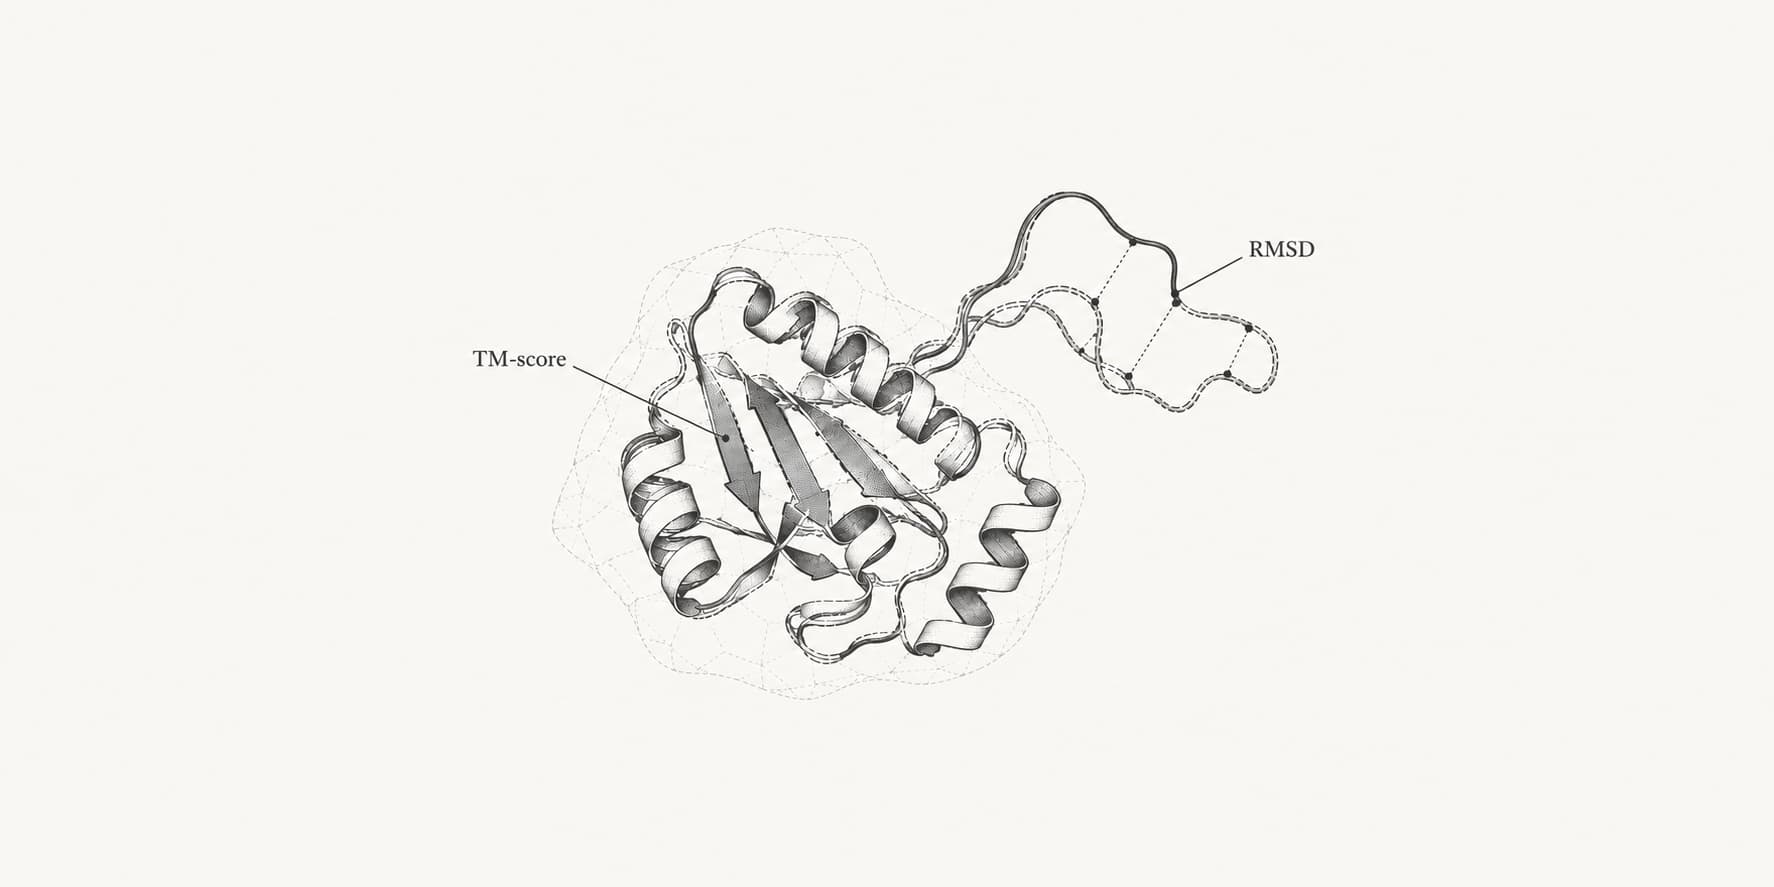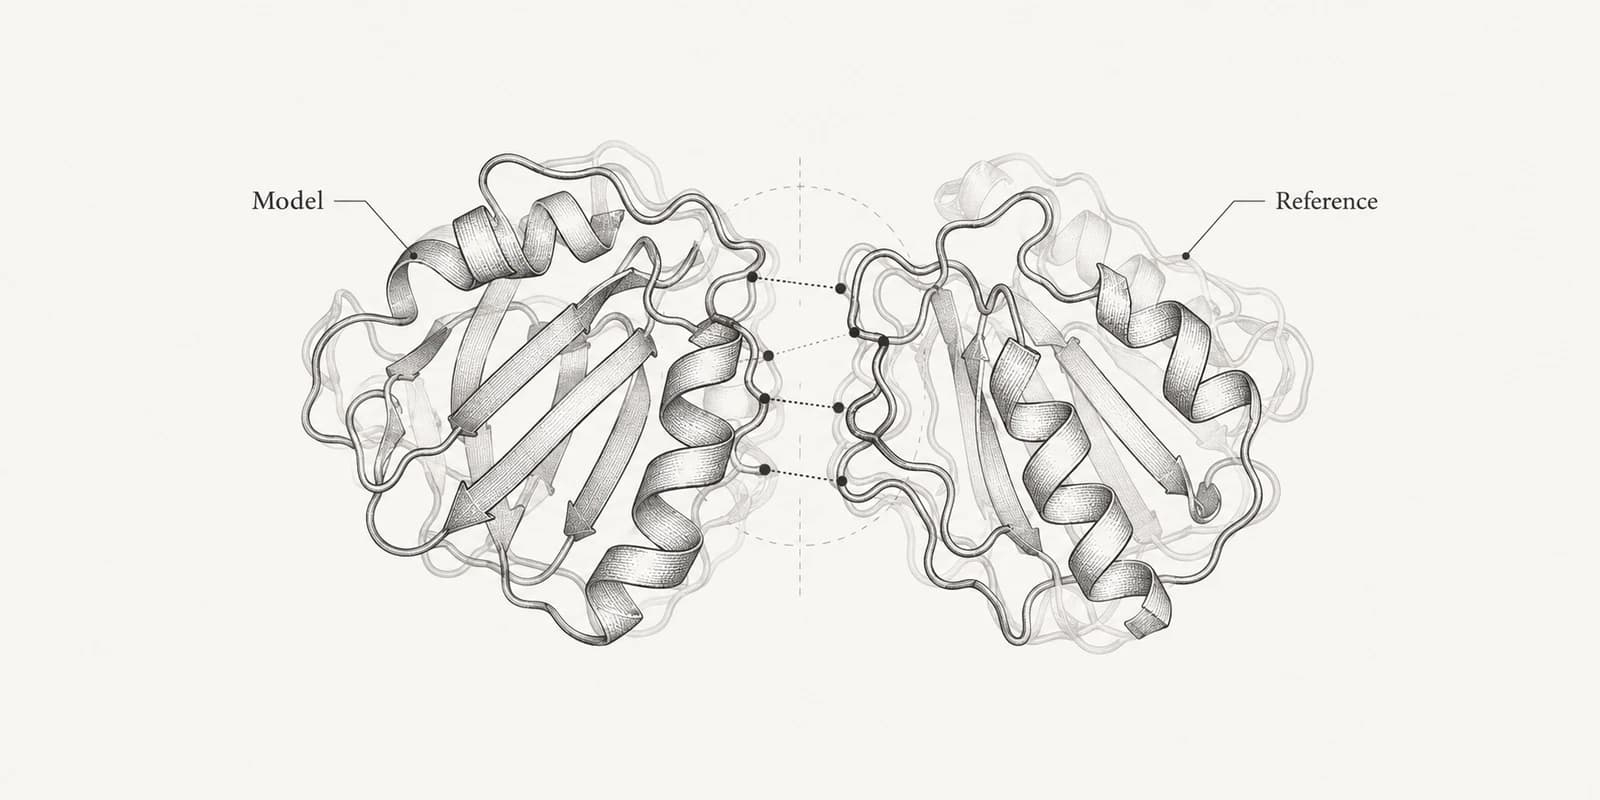
RMSD (root-mean-square deviation) measures how far apart the matching atoms of two structures are, as a single average distance in ångströms (Å). An RMSD of 0 Å means the coordinates are identical, and larger values mean the structures differ more. It is the standard number for comparing two models of the same protein, following a molecular dynamics simulation over time and judging whether a docked ligand landed where the crystal structure puts it.
What counts as a good RMSD depends on what is being compared. A docked ligand pose within 2 Å of the experimental pose is the usual definition of a correct prediction. In the examples below, the same protein solved twice by different methods agrees to about 0.5 Å over its Cα atoms, and protein design pipelines accept a refolded design within 2 Å of its intended backbone. Those numbers only mean something once you know which atoms were compared, whether the structures were superimposed first, and how large the protein is. You can compute it for your own files with the RMSD Calculator, which reports the fitted and unfitted values side by side.
The RMSD formula
For N pairs of matched atoms, where dᵢ is the distance between the two positions of atom i:
The calculation has three steps. Square each distance, take the mean of the squares, then take the square root so the result is back in ångströms.
A worked calculation
Take four matched atoms whose positions differ by 0.5 Å, 0.5 Å, 1.0 Å and 3.0 Å:
The plain average of the same four distances is 1.25 Å. RMSD comes out higher because squaring gives the largest deviation the most weight: the one atom that is 3.0 Å away contributes 9 of the 10.5 in the sum. Leave that atom out and the RMSD of the other three falls to 0.71 Å. This is the most useful thing to remember about RMSD. A few badly placed atoms can dominate it.
Some programs also offer a weighted RMSD, in which each squared distance is multiplied by a weight such as the atomic mass before averaging. With equal weights, which is the convention for Cα and backbone comparisons, the formula reduces to the one above.
Superposition: fitted and unfitted RMSD
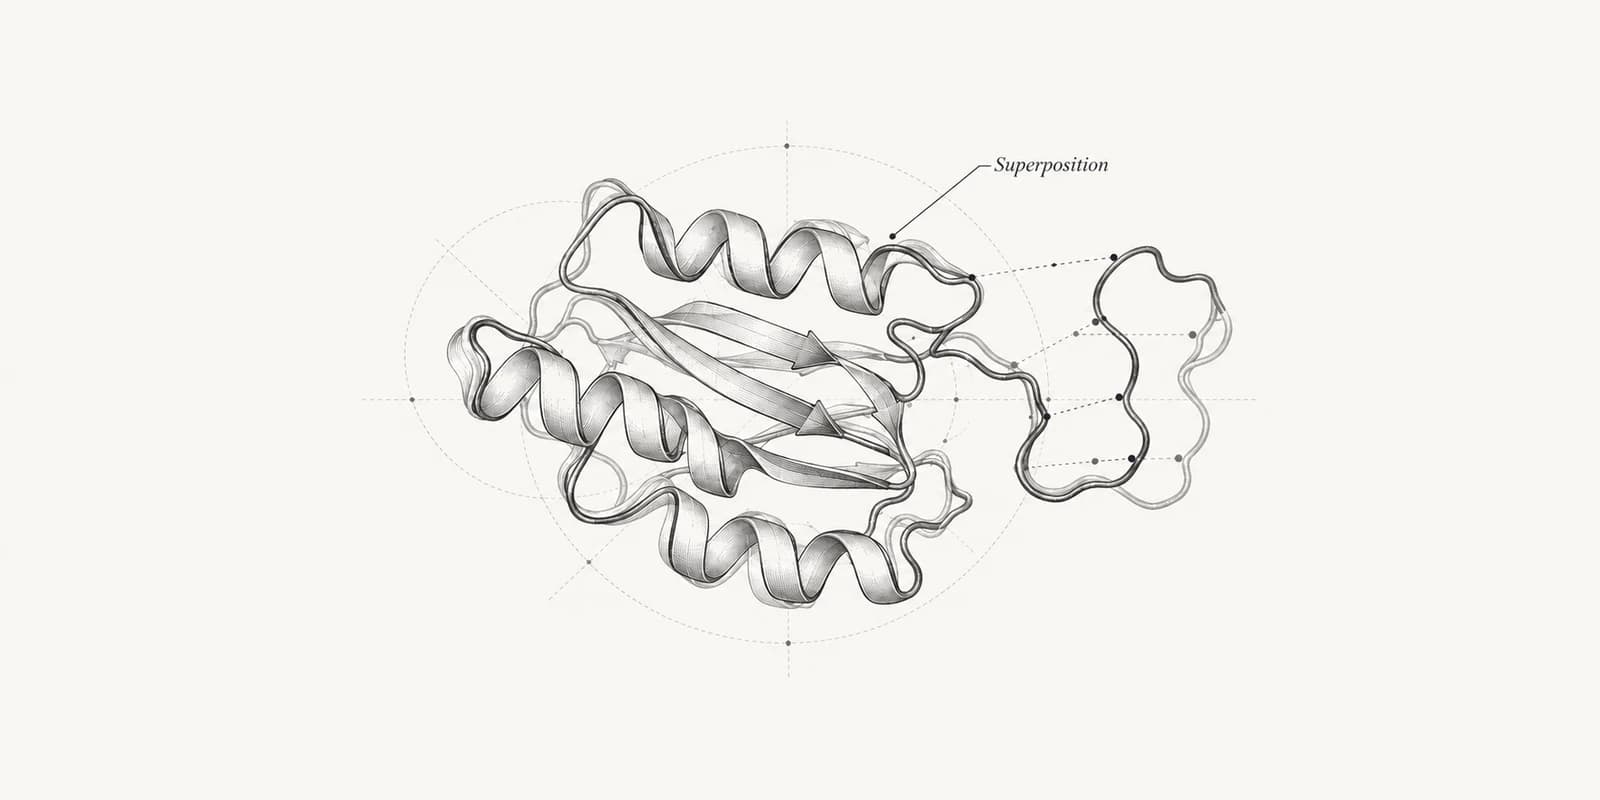
Two structure files rarely share a coordinate frame. A crystal structure and an NMR structure of the same protein can sit far apart in space, so the raw distances say more about where each file was placed than about the protein. Most protein comparisons therefore rotate and translate one structure onto the other first, choosing the movement that makes the RMSD as small as possible. The standard way to find that optimal rotation is the Kabsch algorithm, which solves it directly from the matched coordinates.[1] Structure comparison tools restrict it to a proper rotation, so a structure cannot be fitted to its mirror image.
Ubiquitin shows how large the difference can be. The crystal structure 1UBQ and the first model of the NMR ensemble 1D3Z describe the same 76-residue protein.[2][3] Measured as deposited, without superposition, their Cα RMSD is 115.06 Å. After a Kabsch superposition it is 0.52 Å.
Superposition is not always wanted. When you score a docked ligand, the receptor defines the frame, and the question is where the ligand sits inside it, so the ligand is never fitted onto the reference ligand. The same applies to a ligand compared across two receptor structures: superimpose the proteins on the binding site, then measure the ligands without moving them again. In a molecular dynamics trajectory, each frame is usually fitted to a reference on the protein, which removes the overall tumbling of the molecule, and the RMSD then reports internal changes only.
Cα, backbone, all-atom and heavy-atom RMSD
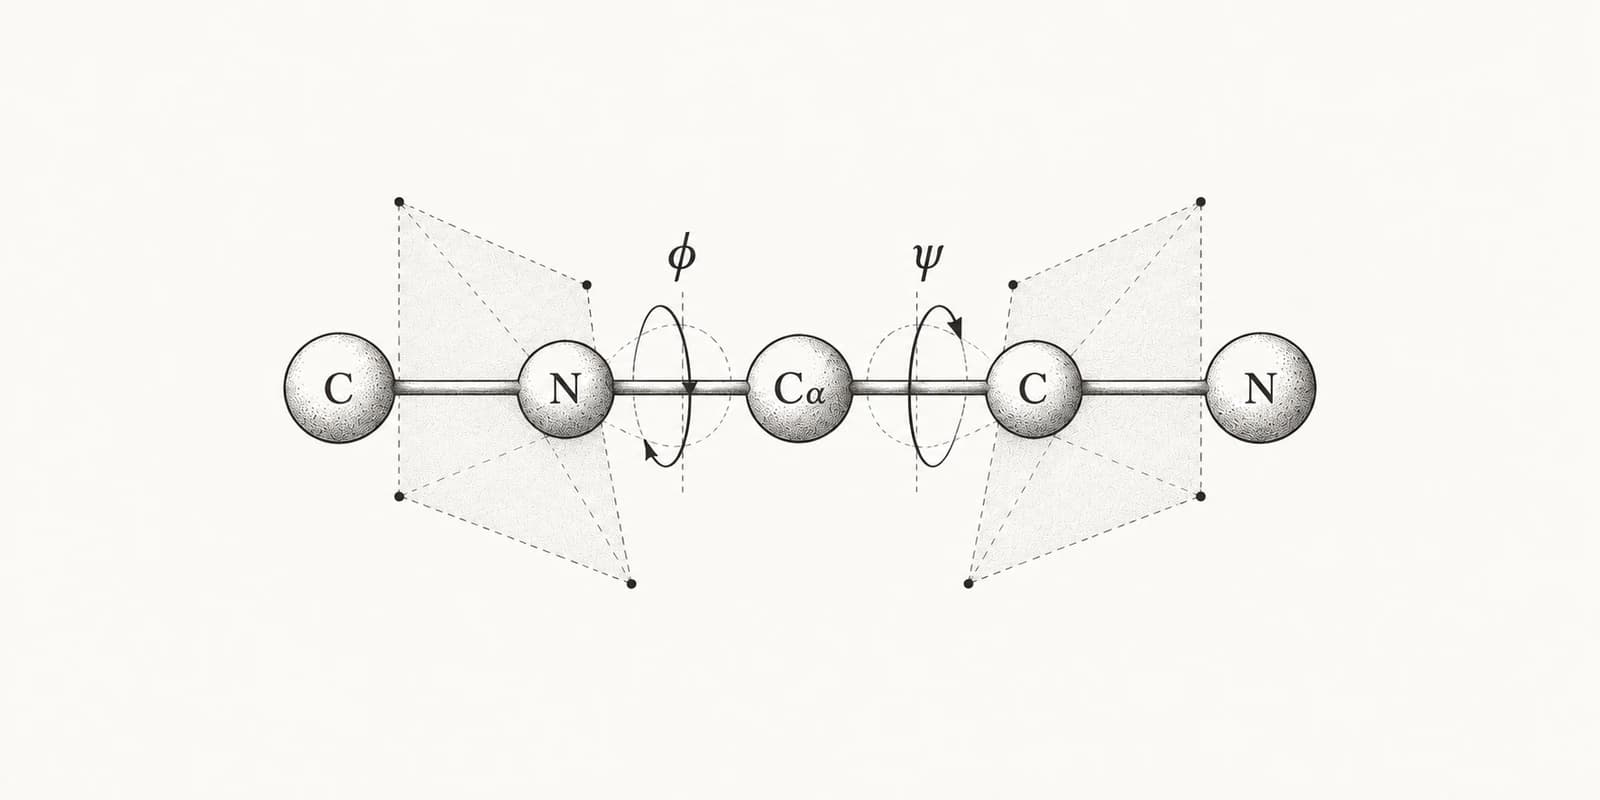
The atoms you include change the number, sometimes by more than the difference you are trying to measure. A Cα RMSD uses one atom per residue and describes the path of the chain. A backbone RMSD adds the N, C and O atoms of each residue. An all-atom RMSD includes side chains, which move more than the backbone, and a heavy-atom RMSD is the same but without hydrogens, which matters when one file has hydrogens and the other does not.
| Atoms compared | Atoms | RMSD |
|---|---|---|
| Cα, without superposition | 76 | 115.06 Å |
| Cα, residues 1 to 70 | 70 | 0.36 Å |
| Cα, all residues | 76 | 0.52 Å |
| Backbone (N, Cα, C, O) | 304 | 0.60 Å |
| All heavy atoms | 602 | 1.35 Å |
| All heavy atoms, symmetric side-chain atoms matched | 602 | 1.29 Å |
The heavy-atom RMSD is more than twice the Cα RMSD for the same pair, because surface side chains adopt different rotamers in a crystal and in solution. The last row also hints at a naming problem. The two ring carbons on each side of a phenylalanine or tyrosine, the two oxygens of an aspartate or glutamate, and the two terminal nitrogens of an arginine are chemically equivalent, but files label them as distinct atoms. Matching each pair whichever way fits better lowers the heavy-atom RMSD from 1.35 to 1.29 Å. For docked ligands, the same problem is larger.
The analysis script and structures reproduce every value in this guide. The RMSD Calculator gives the same 0.52 Å for this pair with its default Cα settings, and lets you fit on one atom selection or residue range and measure another.
RMSD for docked ligand poses
For small-molecule docking, RMSD is computed over the ligand's heavy atoms in the frame of the receptor, against the ligand in an experimental structure. The AutoDock Vina paper notes that a 2 Å cutoff is often used as the criterion for a correctly predicted bound structure.[4] The PoseBusters authors use the same default and describe it as arbitrary but commonly used and recommended for ligands of ordinary size.[5]
A redocking example
The public AutoDock Vina example on ProteinIQ docks imatinib, built from its SMILES string, back into the c-Abl kinase domain of PDB entry 1IEP with the crystal ligand removed.[6] Because the receptor keeps its original coordinates, each pose can be compared directly with the crystal imatinib.
| Vina rank | Vina score (kcal/mol) | RMSD to crystal pose | RMSD after fitting the ligand alone | Vina lower-bound RMSD to rank 1 |
|---|---|---|---|---|
| 1 | −12.51 | 0.94 Å | 0.70 Å | 0 Å |
| 2 | −11.29 | 1.43 Å | 1.33 Å | 1.41 Å |
| 3 | −10.49 | 12.24 Å | 1.95 Å | 2.88 Å |
| 4 | −10.29 | 13.39 Å | 1.79 Å | 1.79 Å |
| 5 | −9.78 | 12.54 Å | 2.44 Å | 2.28 Å |
The top-ranked pose is 0.94 Å from the crystal pose, a clear success by the 2 Å criterion, and so is the second. Poses 3 to 5 are 12 to 13 Å away. They lie in the same pocket with the molecule reversed end to end, its methylpiperazine close to where the crystal pose has its pyridine.
The other two columns show how easily that failure can be hidden. Fitting the ligand onto the crystal ligand before measuring removes its position and orientation, leaving only the difference in shape, and the reversed poses then score 1.8 to 2.4 Å. The lower-bound RMSD in Vina's output matches each atom to the nearest atom of the same element rather than to itself, and it compares poses with each other, not with any experimental structure. A reversed pose that fills the same volume as the top pose therefore looks only 1.8 to 2.9 Å away. Neither number is the accuracy of the pose.
How close two crystal structures are
A useful reference point for any ligand RMSD is how well experiments agree with each other. PDB entries 1IEP and 2HYY together hold six independent copies of imatinib bound to Abl: two in the asymmetric unit of 1IEP (mouse Abl, 2.1 Å resolution) and four in 2HYY (human Abl, 2.4 Å).[6][7] After superimposing the binding-site Cα atoms of each pair of copies, the six crystal ligands differ from each other by 0.19 to 0.34 Å over their 37 heavy atoms. A docked pose at 0.94 Å is about three to five times further from the crystal pose than independent experiments are from each other, which is still an excellent result and well inside the 2 Å cutoff.
Symmetry-corrected RMSD
Imatinib contains two rings that look the same after a 180° flip: the para-substituted benzene of the benzamide and the piperazine. That gives four equally valid ways to number its atoms. If a program pairs atoms strictly by their numbers, a ring that sits correctly but happens to be numbered the other way round counts as wrong. Applying those relabelings to one crystal copy of imatinib, without moving a single atom, gives an RMSD of 0.83 Å for the benzamide ring flip alone and up to 1.17 Å with both rings flipped. For the top Vina pose in Table 2, the RMSD is 0.94 Å with the best numbering and 1.36 Å with the worst.
A symmetry-corrected RMSD tries every equivalent numbering and keeps the lowest value. Allen and Rizzo added such a correction to DOCK and found that it raised the overall docking success rate by about 5% across 1,043 receptor and ligand systems, and by up to 16.7% for some protein families.[8] The method matters too. Meli and Biggin showed that matching atoms by the Hungarian assignment algorithm can pair atoms across the molecule and report an artificially low value, 1.00 Å for a pose whose RMSD by the molecular graph is 2.46 Å, and their spyrmsd tool uses graph isomorphisms instead.[9] PoseBusters reports a symmetry-aware heavy-atom RMSD for this reason. The RMSD Calculator pairs atoms by chain, residue and atom name, so it does not apply this correction.
RMSD alone does not make a pose correct
A pose can be within 2 Å and still be chemically impossible. On the Astex Diverse set, 72% of DiffDock's top poses were within 2 Å, but only 47% were both within 2 Å and physically valid, with sensible bond lengths, stereochemistry and no clashes with the protein. AutoDock Vina went from 58% to 56% on the same test.[5] Check both properties with PoseBusters. For protein and protein docking, DockQ combines an interface RMSD, a ligand RMSD and the fraction of native contacts into one score.
What is a good RMSD value?
There is no single threshold, because each kind of comparison has its own scale. The ranges below come from the examples in this guide and from studies that measured them.
| Comparison | Atoms | Typical RMSD |
|---|---|---|
| Same ligand in independent crystal structures (imatinib in Abl) | Ligand heavy atoms | 0.19 to 0.34 Å |
| Docked ligand counted as a correct pose | Ligand heavy atoms | 2 Å or less |
| Same protein, crystal vs NMR models (ubiquitin) | Cα | 0.47 to 1.55 Å |
| Models within one NMR ensemble (ubiquitin, 1D3Z) | Cα | 0.23 to 2.07 Å, mean 1.16 Å |
| Homologs with 50% sequence identity | Main chain of the shared core | About 1.0 Å |
| Homologs with 20% sequence identity | Main chain of the shared core | About 1.8 Å |
| AlphaFold2 models in CASP14, median | Cα over 95% of residues | 0.96 Å |
| Designed protein refolded by a structure predictor, counted as a success | Backbone | 2 Å or less |
For proteins, two cautions apply to every row. First, Chothia and Lesk measured the homolog values only over the regions that keep the same fold, and for pairs near 20% identity those regions can cover less than half of each molecule.[10] Second, AlphaFold2's figure is the r.m.s.d.95, which leaves out the worst 5% of residues before averaging.[11] Both are lower than an RMSD over every residue would be.
So for a protein alignment, a Cα RMSD below about 1 Å over most of the chain means the two structures agree as closely as repeated experiments do. Values of 1 to 2 Å are normal between close homologs, between a good prediction and an experimental structure, and between models of a flexible protein. Above 2 to 3 Å, check where the difference comes from before concluding anything, because a moving loop, terminus or domain can produce that on its own.
Why RMSD depends on protein size and outliers
Squaring the distances lets a small region dominate the average. In the ubiquitin pair from Table 1, residues 71 to 76 are 8% of the chain but contribute 48% of the summed squared Cα deviation. This is the C-terminal tail, and its last four residues already showed partial occupancy or large thermal motion in the crystal structure.[2] The effect is clearer across all ten NMR models. Fitted on all 76 Cα atoms, they range from 0.47 to 1.55 Å from the crystal structure. Leave out the tail and every model falls between 0.34 and 0.39 Å.
Size matters too. Unrelated compact chains of 50 residues cannot end up very far apart, while unrelated chains of 500 residues can, so the same RMSD means less in a small protein than in a large one. Maiorov and Crippen proposed judging an RMSD against the value obtained when one structure is replaced by its mirror image: two conformations are intrinsically similar when their RMSD is smaller than that.[13] For the ubiquitin pair, the mirror image of the NMR model gives 10.71 Å against the actual 0.52 Å. Carugo and Pongor took a different route and proposed RMSD100, a version rescaled to what it would be for a 100-residue protein.[14]
Other scores were designed to avoid these problems. TM-score rates each aligned residue between 0 and 1 with a distance scale that grows with protein length, so a misplaced loop costs only its own share and unrelated proteins score about the same at any size.[15] GDT counts the share of residues within several distance cutoffs after superposition.[16] lDDT compares the distances between atoms within each structure and never superimposes them, which makes it insensitive to domain motions.[17] Choosing between TM-score and RMSD comes down to whether the structures are nearly identical or only share a fold: a hinge motion in adenylate kinase pushes its RMSD above 7 Å while a TM-score of 0.68 still marks the same fold. The pLDDT score that AlphaFold and ESMFold attach to each residue is a prediction of lDDT, and structure search with Foldseek ranks hits by alignment scores and reports TM-score and lDDT.
RMSD in molecular dynamics trajectories
In a simulation every frame contains the same atoms in the same order, so the matching problem disappears and RMSD is the natural way to follow the structure over time. Each frame is fitted to a reference, usually the starting structure or an experimental one, on a stable selection such as the backbone or Cα atoms of the structured core. The resulting curve typically rises in the first part of the run as the structure relaxes from its starting coordinates and then fluctuates around a plateau.
A plateau is easy to over-read. Knapp and colleagues showed the same RMSD plots, randomized and repeated, to scientists who work with molecular dynamics and found no agreement on when the simulations had reached equilibrium, with decisions biased by how the plots were presented. They concluded that equilibration should not be argued from an RMSD plot alone.[18] A flat RMSD shows that the structure stays a similar distance from the reference, not that the simulation has sampled everything it can.
Experimental spread is the fairest yardstick for the plateau height. The ubiquitin NMR models in 1D3Z differ from each other by 1.16 Å on average over their Cα atoms, mostly because of the C-terminal tail, so an MD run of ubiquitin that settles around 1 Å from its starting model is within the spread of the experimental ensemble. Lindorff-Larsen and colleagues started 10 µs simulations of ubiquitin from 1D3Z in eight force fields and found the native state stable in all of them.[19] In the same study, the 10-residue peptide CLN025 was counted as folded once its Cα RMSD to the NMR structure fell below 1.0 Å and as unfolded once it rose above 4.0 Å.
Three practical points avoid most confusion. GROMACS reports RMSD in nanometers, so 0.2 nm is 2 Å. Align on the part of the protein you consider rigid and measure flexible parts separately, as with the ubiquitin tail above. Use RMSF, the per-residue fluctuation around the average structure, to find where the motion is, and an all-against-all RMSD matrix to find distinct conformations. MD Trajectory Analysis plots RMSD over time from GROMACS or OpenMM runs, and pyRMSD computes the pairwise matrix for an ensemble.
Calculating RMSD on ProteinIQ
Which tool fits depends on how the atoms should be matched. The RMSD Calculator compares a reference with one or more structures that share chain IDs and residue numbering, and returns the fitted and unfitted RMSD, matched coverage, a per-residue profile and the superimposed structures. When numbering or sequences differ, US-align finds the residue correspondence itself and reports RMSD together with TM-score over the residues it aligned. pyRMSD handles ensembles with identical atoms, such as MD frames or NMR models. For docking, run AutoDock Vina and check the poses against a reference ligand with PoseBusters.
Frequently asked questions
What is a good RMSD value for protein alignment?
For the same protein or a close homolog, a Cα RMSD under about 1 Å over most residues is as close as independent experiments usually agree, and 1 to 2 Å is normal for homologs, good predictions and flexible proteins. Always read it with the number of residues compared, and check whether a loop or terminus is responsible for most of it. For fold-level similarity between proteins of different size, use TM-score.
What does an RMSD of 0 mean?
The matched atoms have identical coordinates after the chosen superposition, which in practice happens when a structure is compared with itself. Independent experiments on the same molecule never reach 0; the six crystal copies of imatinib above differ by 0.19 to 0.34 Å.
Is a lower RMSD always better?
Only when the comparison is set up the same way. A lower value from fewer atoms, from Cα instead of all atoms, or from a tool that aligned only the agreeing part of the structures does not mean closer structures.
What is the difference between RMSD and RMSF?
RMSD compares a whole structure with a reference at one moment, giving one value per frame or per pair. RMSF (root-mean-square fluctuation) averages over time for each residue or atom, giving one value per residue that shows which regions move most in a simulation.
Why does my docking program report RMSD values for every pose?
AutoDock Vina's RMSD columns measure each pose against the program's own top-ranked pose, not against an experimental structure. To measure accuracy, compare the poses with a crystal ligand in the receptor frame, as in Table 2.