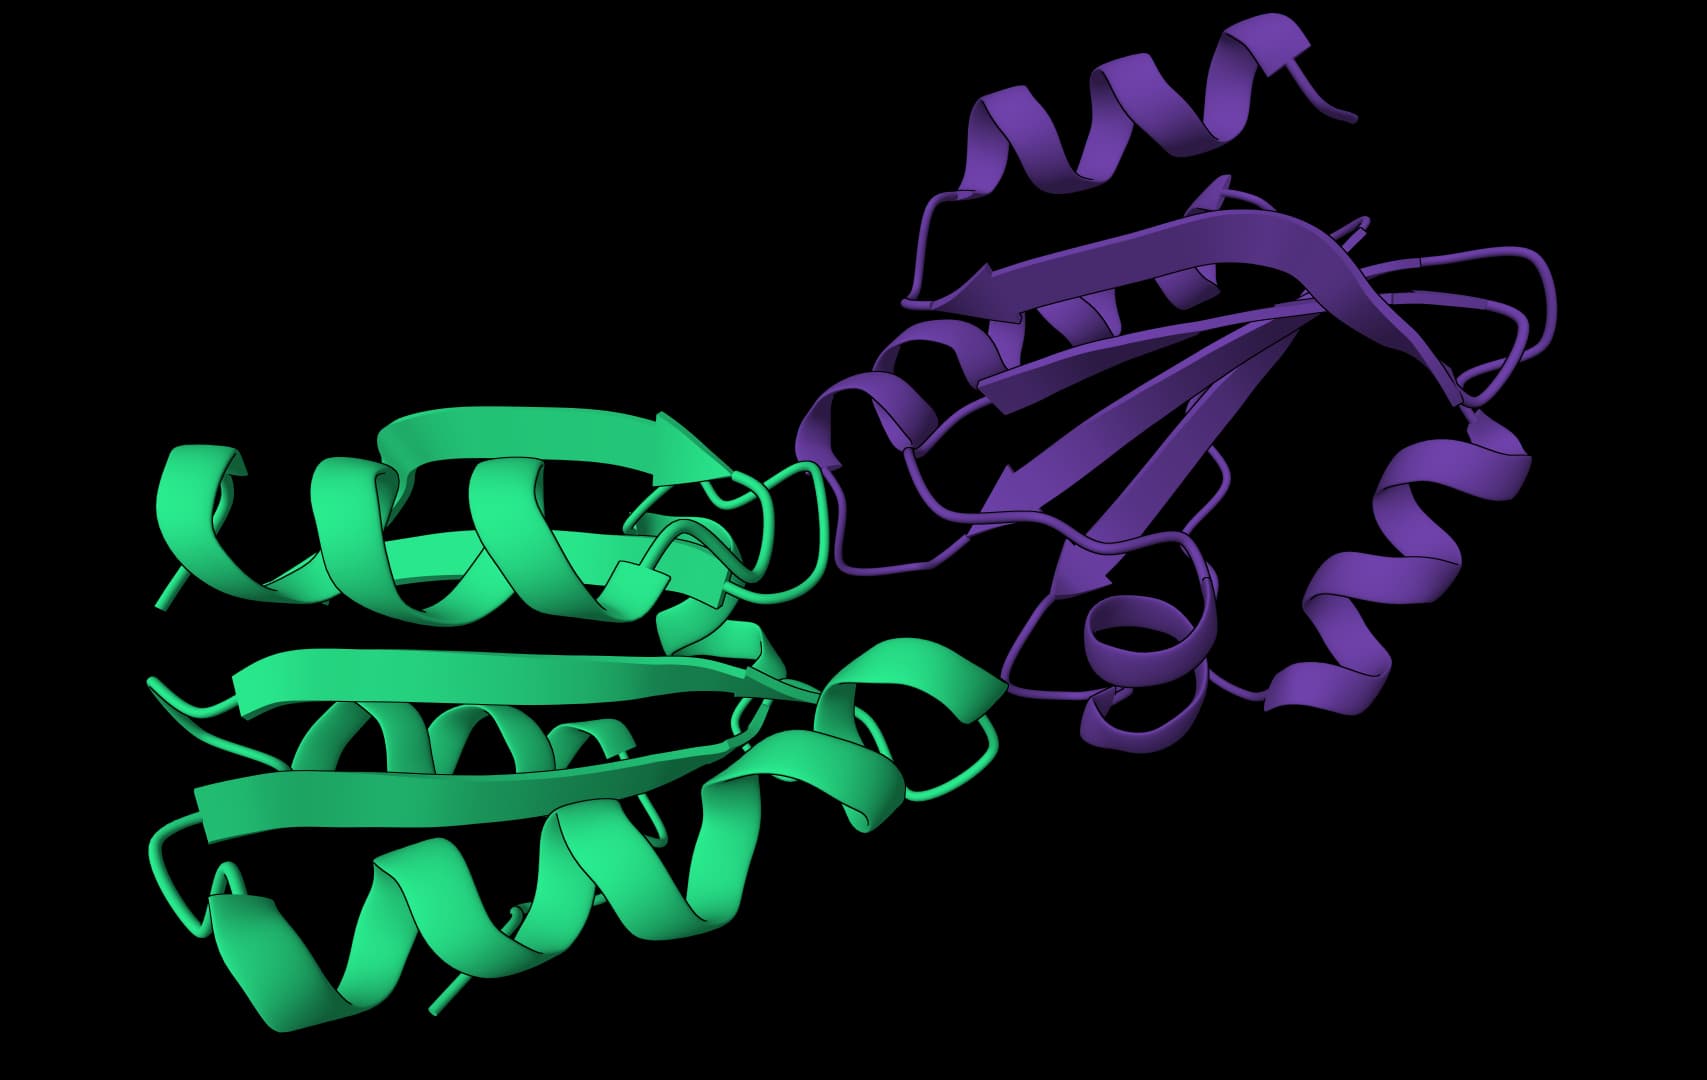
Assess docking quality between model and native structures
What is DockQ?
The DockQ score measures how closely each interface in a model matches the same interface in a reference complex, on a 0 to 1 scale that combines the fraction of native contacts (fnat), interface RMSD and ligand RMSD. Each polymer interface also gets a CAPRI quality class: Incorrect below 0.23, Acceptable from 0.23, Medium from 0.49 and High from 0.80. Small-molecule interfaces get no class, and the classes are not validated for CAPRI peptide mode.
Pricing
A single model/reference comparison costs 5 credits. Chain mapping, Small molecule mode, CAPRI peptide mode, Skip alignment, and Allowed mismatches do not change this per-job cost. The exact quote is calculated before submission; batch and workflow comparisons are quoted separately for each job.
Understanding the output
DockQ reports metrics for each interface in your complex:
Interface: The chain pair being evaluated (e.g., "A:B" for the interface between chains A and B). Multi-chain complexes produce multiple rows.
DockQ: The combined quality score (0-1). This is your primary metric for ranking models.
Quality: Categorical classification (Incorrect/Acceptable/Medium/High) based on the thresholds above.
iRMSD: Interface RMSD in Angstroms. Values under 1 indicate excellent interface geometry; values above 4 suggest significant structural differences.
LRMSD: Ligand RMSD in Angstroms. Measures global positioning error of the smaller chain. Values under 5 are generally acceptable.
fnat: Fraction of native contacts recovered (0-1). Values above 0.5 indicate the correct binding mode was identified.
fnonnat: Fraction of predicted contacts that are non-native (false positives). Lower is better. High values suggest your model creates artificial contacts.
F1: Harmonic mean of precision and recall for interface contacts. Balances (recall) against the complementary precision measure.
Clashes: Number of interfacial residue pairs with heavy atoms closer than 2 Å. Non-zero values indicate steric problems in your model.
Additional fields, when returned, include native contacts recovered (nat_correct), native contacts total (nat_total), non-native contacts (nonnat_count), model contacts total (model_total), chain lengths (len1, len2), chain roles (class1, class2), and the small-molecule indicator (is_het). A missing metric remains empty; it does not mean zero.
Native files and numerical precision
Completed jobs include dockq_results.json, dockq_stdout.log, and dockq_stderr.log. The JSON contains the complete native scores, interface and atom mappings, and global mapping at their original precision. Failure diagnostics retain both available source streams.
New jobs admitted with the updated result contract retain full native precision in the results table and workflow rows. Earlier admitted jobs retain their original rounded table values; the complete native JSON remains the source for exact values. Global DockQ is the average over the selected native interfaces. The additional best-interface and average summaries are separate from native best_dockq, which is the sum of interface DockQ values.
When to use DockQ
After docking: Evaluate binding poses from AutoDock Vina, DiffDock, GNINA, or LightDock against a known crystal structure. DockQ helps you select the best pose when multiple candidates exist.
Validating predicted structures: Compare AlphaFold 2 or Boltz-2 complex predictions against experimentally determined structures. DockQ provides more nuanced feedback than simple RMSD calculations.
Benchmarking methods: When developing or comparing docking algorithms, DockQ provides a standardized metric that correlates with CAPRI assessments.
Quality control: Verify that homology models of protein complexes preserve the interface geometry of their templates.
When to use alternatives
For overall structure comparison (not docking-specific), use our RMSD calculator with Kabsch alignment. For comprehensive single-structure validation including geometry checks, use MolProbity.
Input requirements
DockQ requires one model and one reference structure per comparison:
| Input | Accepted files | Limits |
|---|---|---|
| Model structure | PDB (.pdb, .ent) or mmCIF (.cif) | Required; 50 MiB per file; at least 2 chains |
| Native/reference structure | PDB (.pdb, .ent) or mmCIF (.cif) | Required; 50 MiB per file; at least 2 chains |
Compressed .gz files must be decompressed before upload. Both inputs support fetching a PDB entry from RCSB and trimming a PDB structure before submission. Only the first coordinate model is scored; an ensemble is not evaluated as a set of models. An optional Job name labels the run without changing the analysis.
Model structure: Your predicted or docked complex. Must contain all chains involved in the interfaces you want to evaluate.
Native structure: The reference (ground truth) complex. Chain naming doesn't need to match the model. DockQ performs automatic chain mapping.
Both structures should represent the same or highly similar complexes. DockQ decides chain correspondence from its own sequence alignment. Missing residues and aligned gaps can be accepted with the default mismatch tolerance of zero; complete sequence-string identity is not required. Significant differences can still produce a native homology or interface error.
Settings
| Parameter | Type | Default | Description |
|---|---|---|---|
Chain mapping (chain_mapping) | string | Empty, automatic | A single MODEL:NATIVE mapping; fixed chain IDs must exist in the selected mode. |
Small molecule mode (small_molecule) | boolean | false | Include supported heteroatom chains and use native small-molecule scoring for their interfaces. |
CAPRI peptide mode (capri_peptide) | boolean | false | Use experimental peptide contact and interface definitions described below. |
Skip alignment (no_align) | boolean | false | Use residue numbering instead of sequence alignment; structural superposition remains active. |
Allowed mismatches (allowed_mismatches) | integer | 0 | Allow 0 to 10 aligned substitutions during automatic chain matching. |
Chain mapping
By default, DockQ automatically determines the optimal correspondence between model and native chains by maximizing the average DockQ score. This works well when chains are similar length.
For explicit control, use the chain mapping option with format MODEL:NATIVE:
AB:AB- Map model chains A,B to native chains A,BAB:HL- Map model chains A,B to native chains H,L (common for antibodies)A*:W*- Wildcard mapping when chain names differ:BCor*:BC- Evaluate the selected native chains while optimizing their model correspondence
Mapping notation uses one character per chain and exactly one colon. Comma-separated pairs such as A:A,B:B are invalid. For mmCIF inputs, standard mode uses author chain IDs (auth_asym_id), while Small molecule mode uses label chain IDs (label_asym_id). Standard mode excludes HETATM-only chains.
Small molecule mode
Enable this for evaluating supported small-molecule docking poses. The ligand must already be present in the uploaded PDB or mmCIF file as a separate chain identifier. For hetero interfaces, DockQ primarily reports LRMSD in its CLI output because interface-contact metrics are less informative for small molecules.
For these interfaces, the native JSON supplies a symmetry-corrected LRMSD, an atom mapping, and a DockQ value derived from LRMSD. Polymer metrics such as iRMSD, fnat, fnonnat, F1, and clashes remain empty, and no per-interface Quality class is assigned. Standard polymer interfaces in the same complex retain their usual metrics. Small-molecule scores and aggregate Quality summaries should not be interpreted as validated polymer CAPRI classifications.
CAPRI peptide mode
CAPRI peptide mode (capri_peptide) is off by default. Enabling it changes the native-contact cutoff from 5 Å to 4 Å and defines interface residues using Cβ distances below 8 Å, with Cα used when Cβ is absent, instead of the standard 10 Å heavy-atom interface cutoff. iRMSD is still calculated from the selected residues' backbone atoms; the DockQ formula and its RMSD scaling constants are unchanged.
This option is experimental. DockQ v2.1.3 cautions against trusting DockQ scores with this setting, so conventional DockQ quality thresholds should not be treated as a validated peptide benchmark. The option changes polymer-interface scoring; hetero interfaces continue to use Small molecule mode's LRMSD-based calculation. See the pinned DockQ v2.1.3 scoring implementation and distance cutoffs.
Skip alignment
Enable this only when residue numbering provides the intended correspondence between the structures. It skips sequence alignment and uses residue numbers directly. DockQ still performs the structural superposition needed for RMSD scoring; the input coordinates do not need to share the same coordinate frame.
Allowed mismatches
Increases tolerance for sequence differences during chain mapping. Useful when comparing structures with point mutations or slight sequence variations. The default (0) allows no aligned substitutions; aligned gaps are handled by DockQ and do not automatically require a positive tolerance. The hosted setting accepts integers from 0 to 10.
Example workflow
Consider evaluating a docking prediction for the barnase-barstar complex:
- Download the crystal structure (PDB: 1BRS) as your native reference
- Generate docking poses using AutoDock Vina or similar
- Upload your best docked model and the 1BRS structure to DockQ
- Interpret results:
- DockQ > 0.8 with fnat > 0.8: Excellent pose, likely correct binding mode
- DockQ 0.5-0.8 with iRMSD < 2 Å: Good interface but some positioning error
- DockQ < 0.23: Incorrect binding mode. Try alternative poses
Common issues and solutions
"No valid interfaces found": Both structures must have at least two chains in contact. Single-chain structures cannot form interfaces for DockQ to evaluate.
Low DockQ despite visual similarity: Check chain mapping. Automatic mapping may assign chains incorrectly when multiple similar chains exist. Use explicit mapping.
High fnonnat with reasonable DockQ: Your model creates additional contacts not present in the native structure. This often indicates slight rotation or translation of the ligand.
Clashes > 0: Steric clashes indicate physically unrealistic overlap. Consider energy minimization or selecting alternative poses.
FAQ
Is DockQ suitable for protein-DNA complexes?
Yes. DockQ v2.1.3, which this tool runs, natively supports protein-nucleic-acid and nucleic-acid interfaces. The table assigns the same numerical quality thresholds to these polymer interfaces, though interpretation still depends on the specific biology of the complex.
Can I evaluate flexible docking results?
Yes, but with caveats. DockQ compares static structures. If your docking protocol included receptor flexibility, the native structure should ideally match the induced-fit conformation, not the unbound receptor.
How does DockQ handle symmetric complexes?
DockQ automatically tries different chain mappings and reports the one that maximizes the average score. For homodimers, this means it finds the correct subunit correspondence automatically.
What DockQ score should I aim for?
For standard polymer-interface scoring, Medium quality starts at 0.49 and High quality at 0.80. Higher scores indicate closer agreement with the chosen reference, but a DockQ score alone does not establish binding affinity, biological activity, or suitability for lead optimization. CAPRI peptide and small-molecule results require the mode-specific interpretation described above.
Can I compare models without a native structure?
No. DockQ requires a reference structure. For ranking docking poses without a native structure, rely on the scoring function from your docking tool (e.g., Vina affinity scores) or consensus approaches.
References
Basu S, Wallner B. (2016). DockQ: A Quality Measure for Protein-Protein Docking Models. PLoS ONE 11(8): e0161879. DOI: 10.1371/journal.pone.0161879
Related tools

PoseBusters
Validate generated and docked ligand poses with structure, chemistry, and reference-pose checks.

MolProbity
Validate protein structures with clashscore, Ramachandran, rotamer, and geometry checks.

DeepRank-GNN-esm
Score every protein interface with ESM-2 and a graph neural network

IPSAE
Score interprotein interactions in AlphaFold and Boltz predictions

PDBsum
Generate structural summary reports and diagrams for a single protein PDB structure.

pyRMSD
Pairwise RMSD matrices for PDB structure ensembles

RMSD calculator
Calculate RMSD between protein structures with automatic alignment

PLIP
Profile protein-ligand interactions from a PDB complex structure.

ProLIF
Calculate protein-ligand interaction fingerprints from 3D structures.

Oligo analyzer
Analyze independent DNA oligos or screen a bounded set for primer interactions with Primer3 thermodynamic conditions.