VMD alternatives and viewing MD trajectories in the browser
Who may use VMD, and what else plays a trajectory

Matic Broz, PhD11 min
A GROMACS run ends with two files that matter: a structure and an .xtc trajectory that can be hundreds of megabytes. The usual next step is VMD. Before you can install it, though, you register on the University of Illinois site, and the licence you accept covers academic, research and internal business use but not commercial use.[1][2]
That is fine for a thesis and a problem for a start-up. Either way it is a desktop install on a machine that may not be yours. People searching for VMD alternatives usually want something narrower: play this trajectory, see how it moves, and send the result to a collaborator without asking them to install anything.
Several programs do that, and one runs in a browser tab. We read each program's licence and format list in its own documentation, then ran a real trajectory through the PDB viewer by ProteinIQ, which is ours; the gaps in it are written down below as carefully as its strengths.

What VMD is, and who may use it
VMD (Visual Molecular Dynamics) comes from the University of Illinois and was described by Humphrey, Dalke and Schulten in 1996. The project says it is distributed free of charge and includes source code, but the licence is not an open-source one.[1] It grants use "for academic, research and internal business purposes only", states that commercial use requires a commercial licence, and limits redistribution of VMD or works derived from it.
Published work that uses VMD has to cite the 1996 paper.
Downloading means registering. The download page sends you to a registration and login page, and as of November 2026 it lists release 2.0.0 (March 25, 2026) as a 64-bit Linux build, with a 2.0.1 alpha from April.[2] The project's front page still advertises 1.9.4 for macOS, Unix and Windows, so check the download page for the build you need.
What VMD does well is read almost anything. Its trajectory plugins cover CHARMM and NAMD DCD, GROMACS XTC, TRR and TNG, Amber NetCDF, LAMMPS and several others, and DCD is the only trajectory format on that list that it also writes.[3] The university publishes a tutorial, "Using VMD", built around ubiquitin, and a separate one for its Timeline trajectory analysis plugin.[4] We found no hosted, in-browser version of VMD on the project's pages.
VMD alternatives at a glance
| Program | Form | Trajectory formats | Licence | Best for |
|---|---|---|---|---|
| VMD | Desktop | DCD, XTC, TRR, TNG, Amber NetCDF and more | Free for academic, research and internal business use; registration to download | The reference tool, with analysis plugins |
| PyMOL | Desktop | Through molfile plugins; DCD and XTC in the docs | Open-source code under a BSD-like licence; official builds paid or educational | Figures and movies |
| ChimeraX | Desktop | DCD, XTC, TRR, Amber NetCDF, LAMMPS dump | Free for non-commercial use | Playing a trajectory with a few commands |
| Mol* | Browser, library | Readers exist in the code; local import not documented in the viewer | MIT | Embedding in a web page |
| NGLView | Jupyter widget | Anything MDAnalysis, MDTraj, pytraj or ParmEd can load | MIT | Looking at a trajectory inside a notebook |
| MDAnalysis and MDTraj | Python libraries | DCD, XTC, TRR and many more | LGPL | Scripted, repeatable analysis |
| PDB viewer by ProteinIQ | Browser | XTC, DCD and TRR over a PDB or GRO topology | Free, no account; files stay in your browser | A quick look and a first analysis without installing |
PyMOL
PyMOL plays trajectories with load_traj, which uses the same molfile plugin backend as VMD. Its wiki shows DCD and XTC examples but does not list formats, and the page was last edited in 2019, so test your format on your version.[12]
The code is open source under a BSD-like licence; the installers on the website are Schrödinger's own builds, which cost from $99 a year for a single academic user and come as free educational builds that are not for research.[10][11] PyMOL 3.1.9 was released on October 7, 2026.[9]
The free PyMOL alternatives compared and the licence rules in detail go further; for trajectories the point is that PyMOL is better at the picture than at the analysis. Plan on making movies and figures there and the plots elsewhere.
ChimeraX
ChimeraX is free for academic, government, non-profit and personal use, and the licence text restricts it to non-commercial research.[5][8] Commercial users need a separate written agreement, so it has the same catch as VMD. Version 1.12 came out on June 11, 2026.[8]
It opens DCD, XTC, TRR, Amber NetCDF and LAMMPS dump files.[6] Open the structure first, then the coordinates with the structureModel option, for example open traj.xtc structureModel #1; the trajectory becomes one model that the coordset command plays.[7] For a CHARMM or NAMD run, open file.psf coords file.dcd reads the topology and coordinates together.
Mol*
Mol* is MIT licensed and open source.[14] Its home page says it can play MD trajectories, and the example it links is a Villin folding run stored as a saved Mol* state, not as a raw XTC.[22] The changelog shows a DCD reader since 2021.[14]
What we could not confirm is the route a reader needs: the viewer documentation describes uploading structure files from your computer and says nothing about loading an XTC or DCD over a topology.[13] Treat Mol* as the choice for embedding a trajectory in your own page, and test your files in the stock viewer before relying on it.
NGLView
NGLView is a Jupyter widget on top of the NGL viewer, MIT licensed, with version 4.0.1 released on February 2, 2026.[16][15] Its add_trajectory takes a trajectory from MDAnalysis, MDTraj, pytraj or ParmEd, so any format those libraries read can be played in a notebook cell.[15]
That suits a workflow that already lives in a notebook: load, analyse and look in one place, then share the notebook. It does not suit a collaborator who has a file and a browser.
MDAnalysis and MDTraj
These two are libraries, not viewers. MDAnalysis reads DCD, XTC, TRR, TNG, Amber NetCDF and a long list of other formats; it is licensed LGPL v3 or later, and version 2.11.0 appeared on October 21, 2026.[17][18][19] MDTraj reads and writes PDB, XTC, TRR, DCD, NetCDF and others under LGPL 2.1 or later; its latest release is 1.11.2 from October 5, 2026.[20]
If you will run the same analysis on fifty trajectories, write it as a script in one of them. The RMSD after superposition, per-residue fluctuations and radius of gyration are a few lines each, and the result is repeatable. Both are also the usual back end for NGLView.
The PDB viewer by ProteinIQ
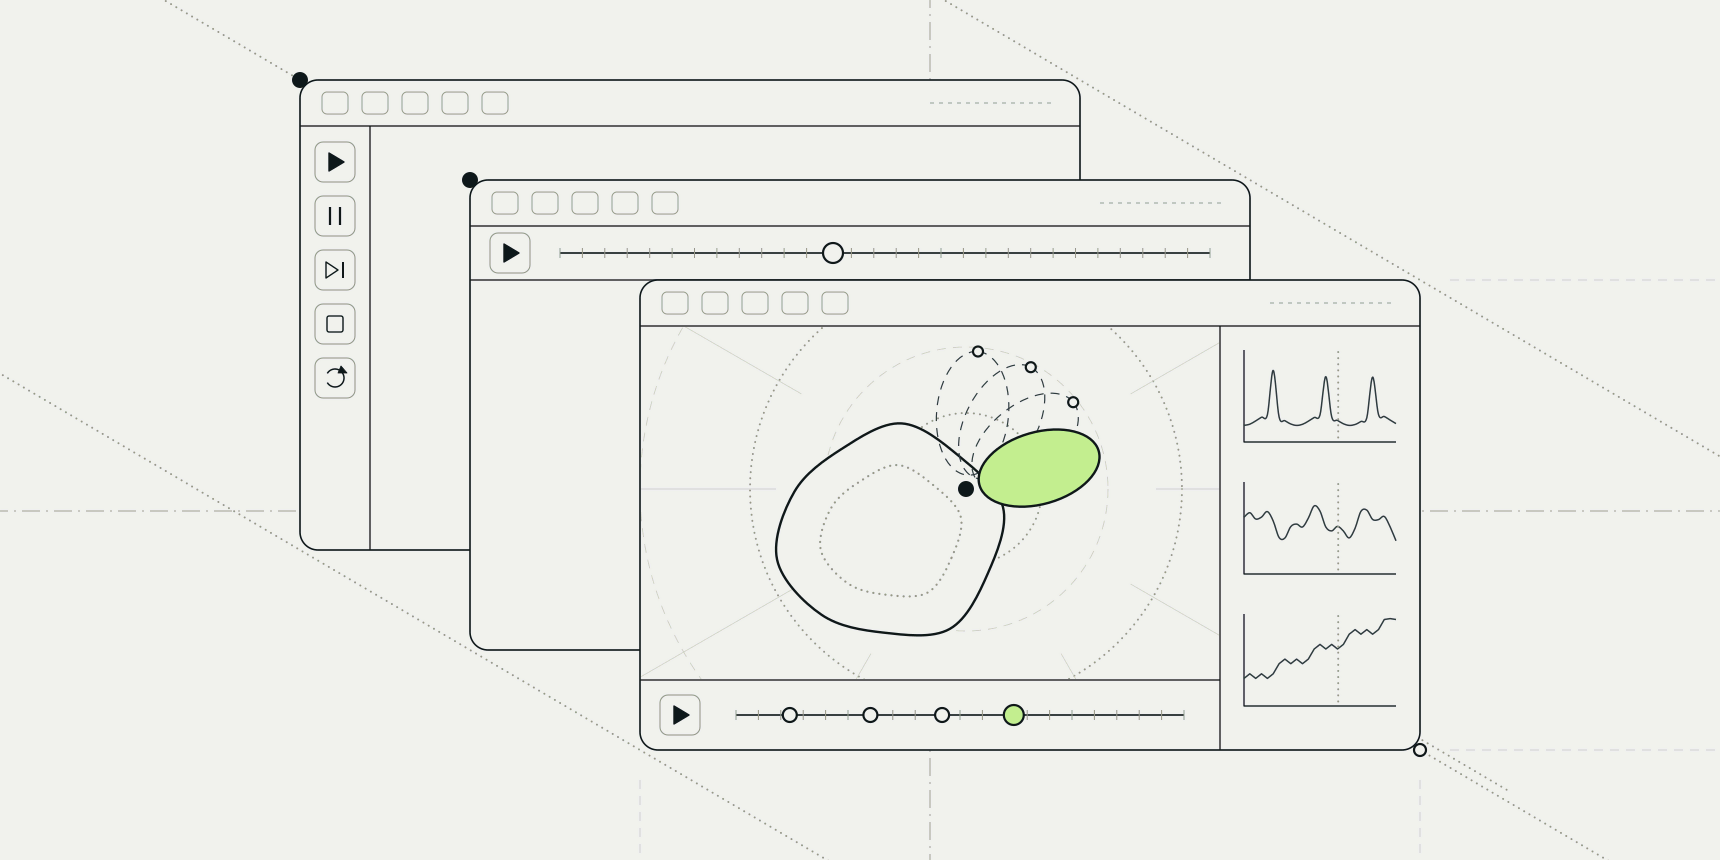
The PDB viewer by ProteinIQ opens XTC, DCD and TRR files over a topology in a PDB or GRO file. Open the topology as you would any structure, then click Open coordinates, or drop both files on the canvas together. A player appears along the bottom of the canvas with play and pause, single steps, a frame slider, speed and loop. The limits are 150 MB per file and 25 million atom-frames, the number of atoms times the number of frames.
The side panel plots the RMSD of every frame against a reference frame (the first by default), measured over your selection or, with none, every Cα. Analysis then adds four things: the RMSF of each residue, the radius of gyration of every frame, a hydrogen bond count per frame with a table of the most persistent pairs, and clusters of similar conformations by the GROMOS method at a cutoff you set, 2 Å by default.
Clicking a plot point moves the player to that frame, and the RMSD values, the per-frame values and the RMSF download as CSV.
Several limits matter. A hydrogen bond here is a nitrogen or oxygen donor and acceptor 2.5 to 3.6 Å apart, with no angle test and water left out, so it can count pairs that the angle cut in GROMACS gmx hbond rejects.
Long trajectories are thinned to at most 2,000 frames for the analysis and clustering uses up to 400, which the panel reports. The coordinates stay in your browser's memory and not in the tab's autosave, so after a reload you open the coordinate file again. The viewer cannot write XTC, DCD or TRR files, and it has no force-field or simulation features: it shows and measures a run, and does not make one.
A trajectory you can try
We needed a trajectory whose licence allows redistribution, so we used the AdK equilibrium dataset from MDAnalysis's data collection, which its authors Seyler and Beckstein released under CC BY 4.0.[21][23] It is a 1.004 µs simulation of apo adenylate kinase with the CHARMM27 force field in explicit water at 300 K and 1 bar, saved every 240 ps, with the solvent stripped and the protein fitted on its CORE domain.
The full file holds 4,187 frames of 3,341 atoms and is 168 MB, just over the viewer's 150 MB limit.
So we kept every 40th frame with MDAnalysis 2.11.0. That leaves 105 frames, 9.6 ns apart, in a 4.2 MB file, and 350,805 atom-frames, far inside the limit. The viewer takes a PDB or GRO topology rather than the dataset's PSF, so we wrote frame 0 out as a PDB. Both files are free to download under the same licence, with the changes noted: the 105-frame DCD, the PDB topology and a note on their origin.
How to play and analyse an XTC or DCD file
Open /app/pdb-viewer, drop adk-equilibrium-frame0.pdb on the canvas and then click Open coordinates for the DCD. With your own run, open the PDB or GRO you ran from first; the number of atoms in the coordinate file must match the topology. Press play, drag the slider to a frame, and set the RMSD reference frame if the first frame is not the one you want.
Click Analyse trajectory under the RMSD plot, leave the hydrogen bond group on Within the protein and the cluster cutoff at 2 Å, and wait for the progress bar to finish.
Which one should you use
If you are an academic user with a desktop and the VMD tutorials are what your group follows, install VMD; the licence is the only catch, and it matters most to anyone working for a company. In a company, ChimeraX has the same non-commercial restriction, so check before you open a proprietary run in either.
For one look at a trajectory with nothing to install, or to send a collaborator a way to see it, use the PDB viewer by ProteinIQ. For repeatable analysis across many runs, write it in MDAnalysis or MDTraj and view results in NGLView.
For a longer comparison of everything that opens a structure, see protein visualization software compared; if you are still choosing an engine to produce the trajectory, the best free molecular dynamics software covers that, and the MD trajectory analysis tool analyses a run on ProteinIQ's servers.