The best free Discovery Studio Visualizer alternatives in 2026
Interaction diagrams and contact lists from PLIP, PoseView, LigPlot+ and two browser viewers, run on the same complex

Matic Broz, PhD19 min
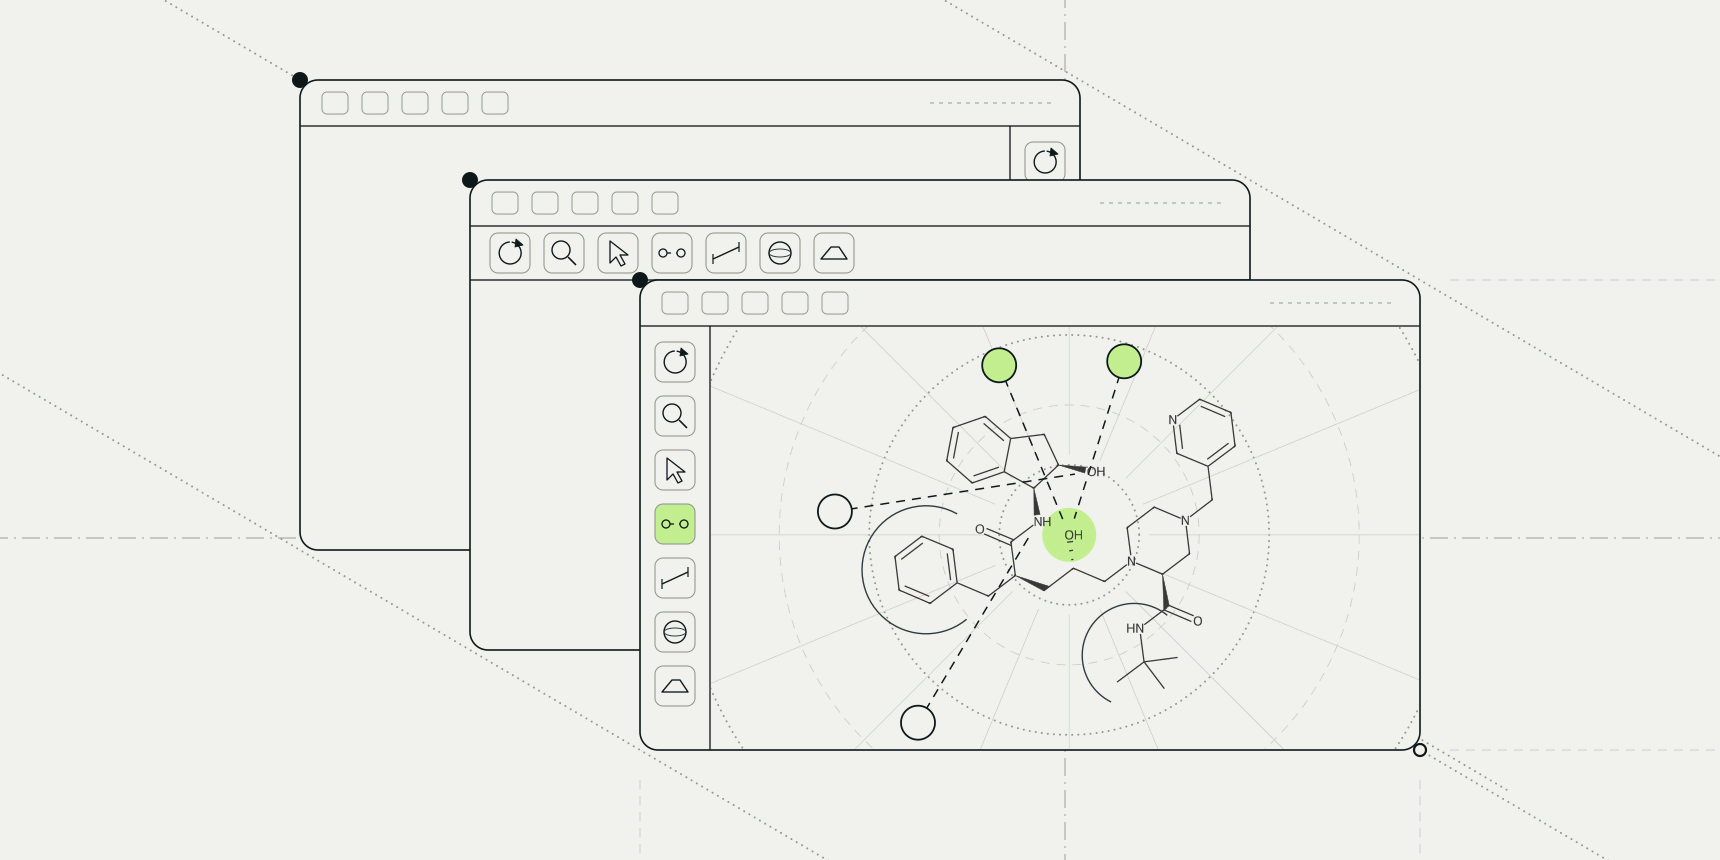
Take HIV-1 protease in PDB entry 1HSG, pick its inhibitor indinavir (ligand code MK1) and ask three free programs which protein atoms it touches. PLIP finds 6 hydrogen bonds. The PDB viewer by ProteinIQ finds 9. PoseView draws 6, but not the same six. The only thing all of them agree on is that the pocket is mostly hydrophobic, and even there PoseView bundles 15 contacts into four arcs.
That matters if you came here for a diagram. Discovery Studio Visualizer, BIOVIA's free desktop program, is the usual way people make a 2D picture of a ligand and its contacts, but it sits behind a registration form and installs only on a desktop. The alternatives below are free to use today, and we ran the ones we could on the same complex so that you can see how differently they count.
Two of them come from us. ProteinIQ builds the PDB viewer and runs PLIP as a hosted tool, so we have tried hard to give their cons the same weight as everyone else's and to show their output unedited.

The best free Discovery Studio Visualizer alternatives
- PLIP for a complete contact list you can script and cite
- PoseView for a publication-style 2D diagram from a browser
- LigPlot+ for the classic hand-editable diagram, if you can get a copy
- PDB viewer by ProteinIQ for contacts in 3D and a 2D diagram in one tab
- Mol* for a quick 3D look at the contacts of any PDB entry
What makes a good Discovery Studio Visualizer alternative?
People who search for a replacement usually want one of two things: a flat diagram of a ligand and the residues around it for a slide or a paper, or a fast check in 3D that a docked pose touches the residues it should. We judged each tool on what it draws, what it counts and by which rules, how you get hold of it, and what it costs to keep using.
The rules are the part most comparisons skip. Each program applies its own distance and angle limits, so a contact list describes the program as much as the complex. Our test complex was 1HSG, solved at 2.00 Å, where the inhibitor sits between the two chains of the protease dimer and reaches the catalytic Asp25 of each.[15] PLIP 3.0.1 ran locally with default settings, which keep crystal waters and add polar hydrogens. PoseView ran on ProteinsPlus through its public API for ligand MK1_B_902, and the PDB viewer opened the entry from the RCSB PDB.
We could not run Discovery Studio Visualizer or LigPlot+ without a licence form or a working download, so for those two we report what their pages say. Programs that need a paid licence for every use, such as the full Discovery Studio and Schrödinger's Maestro, are under other options at the end. Licence terms were checked on each project's pages on November 10, 2026.
The best Discovery Studio Visualizer alternatives at a glance
| Tool | Best for | Runs on | What it gives you | Biggest gap | Price |
|---|---|---|---|---|---|
| Discovery Studio Visualizer | An all-in-one desktop viewer | Desktop; operating systems not stated on the pages we could read | 2D receptor-ligand plots, 3D interaction monitors, interaction surfaces | Registration form; licence text not on the page | Free |
| PLIP | A full contact list you can script | Command line (Docker, pip, source); ProteinIQ web tool | Text and XML reports; images and PyMOL sessions if PyMOL is installed | No 2D diagram of its own | Free, GPL-2.0; 11 credits per run on ProteinIQ |
| PoseView | A 2D diagram from a browser | Web (ProteinsPlus) | 2D diagram as PNG, SVG and PDF | No water bridges or distances; cutoffs not documented | Free for academic and commercial use |
| LigPlot+ | The classic editable diagram | Java desktop application | 2D ligand-protein diagrams you can rearrange on screen | No download link on EBI's page when we checked | Not stated on EBI's page |
| PDB viewer by ProteinIQ | 3D contacts and a 2D diagram in one tab | Web | 3D contact lines, a contact table as CSV, 2D diagram as SVG and PNG | No water bridges; looser charge assignment than PLIP | Free |
| Mol* | A quick 3D look at any PDB entry | Web | Dashed 3D contact lines by type | No 2D diagram and no contact table | Free, MIT |
Discovery Studio Visualizer and what it does well
Discovery Studio Visualizer (Desktop)
Discovery Studio Visualizer pros:
- 2D interaction plots, 3D monitors and interaction surfaces in one program
- Free, from the company behind the full Discovery Studio
Discovery Studio Visualizer cons:
- A registration form before the download, and no licence terms, version or platforms on the pages we could read
BIOVIA pitches the visualizer as a free molecular modelling application for viewing, sharing and analysing protein and small-molecule data.[1] For ligand work its page lists 2D receptor-ligand interaction plots, analysis of the binding pattern between a protein and its ligands, surfaces coloured by hydrophobicity and hydrogen bonding, and monitors that flag favourable, unfavourable and unsatisfied non-bonded interactions.[1] That last feature is rarer than it sounds: none of the diagram tools below flags an unsatisfied donor or acceptor.
The friction is all in getting it. The download page asks you to register before it sends the installer, and the pages we read say nothing about whether use is limited to academic or non-commercial work.[2] Most advanced features and simulations belong to the paid Discovery Studio.[3] We did not register, so we have no counts from it, and you should read the licence the installer shows before using it for company work.
For a one-off figure on a Windows desktop it remains a reasonable choice. The reasons to leave are a script you can rerun, a browser instead of an install, or an open-source licence you can check.
Discovery Studio Visualizer price: Free after registration; the licence terms are not on BIOVIA's public pages.
Best free alternative for a complete contact list
PLIP (Command line, web)
PLIP pros:
- The fullest list here, including water bridges, with a version and thresholds you can report
- Open source and scriptable, with every threshold adjustable
PLIP cons:
- No 2D diagram of its own, and a local install that depends on a matching OpenBabel build
PLIP, the Protein-Ligand Interaction Profiler, came out of Michael Schroeder's group in Dresden, and Salentin and colleagues published it in 2015.[6] It reads a complex and sorts every non-covalent contact into eight types: hydrogen bonds, hydrophobic contacts, water bridges, salt bridges, π-stacking, π-cation interactions, halogen bonds and metal complexes. The current release is 3.0.1, and the 2025 paper extended it to protein-protein interfaces.[7]
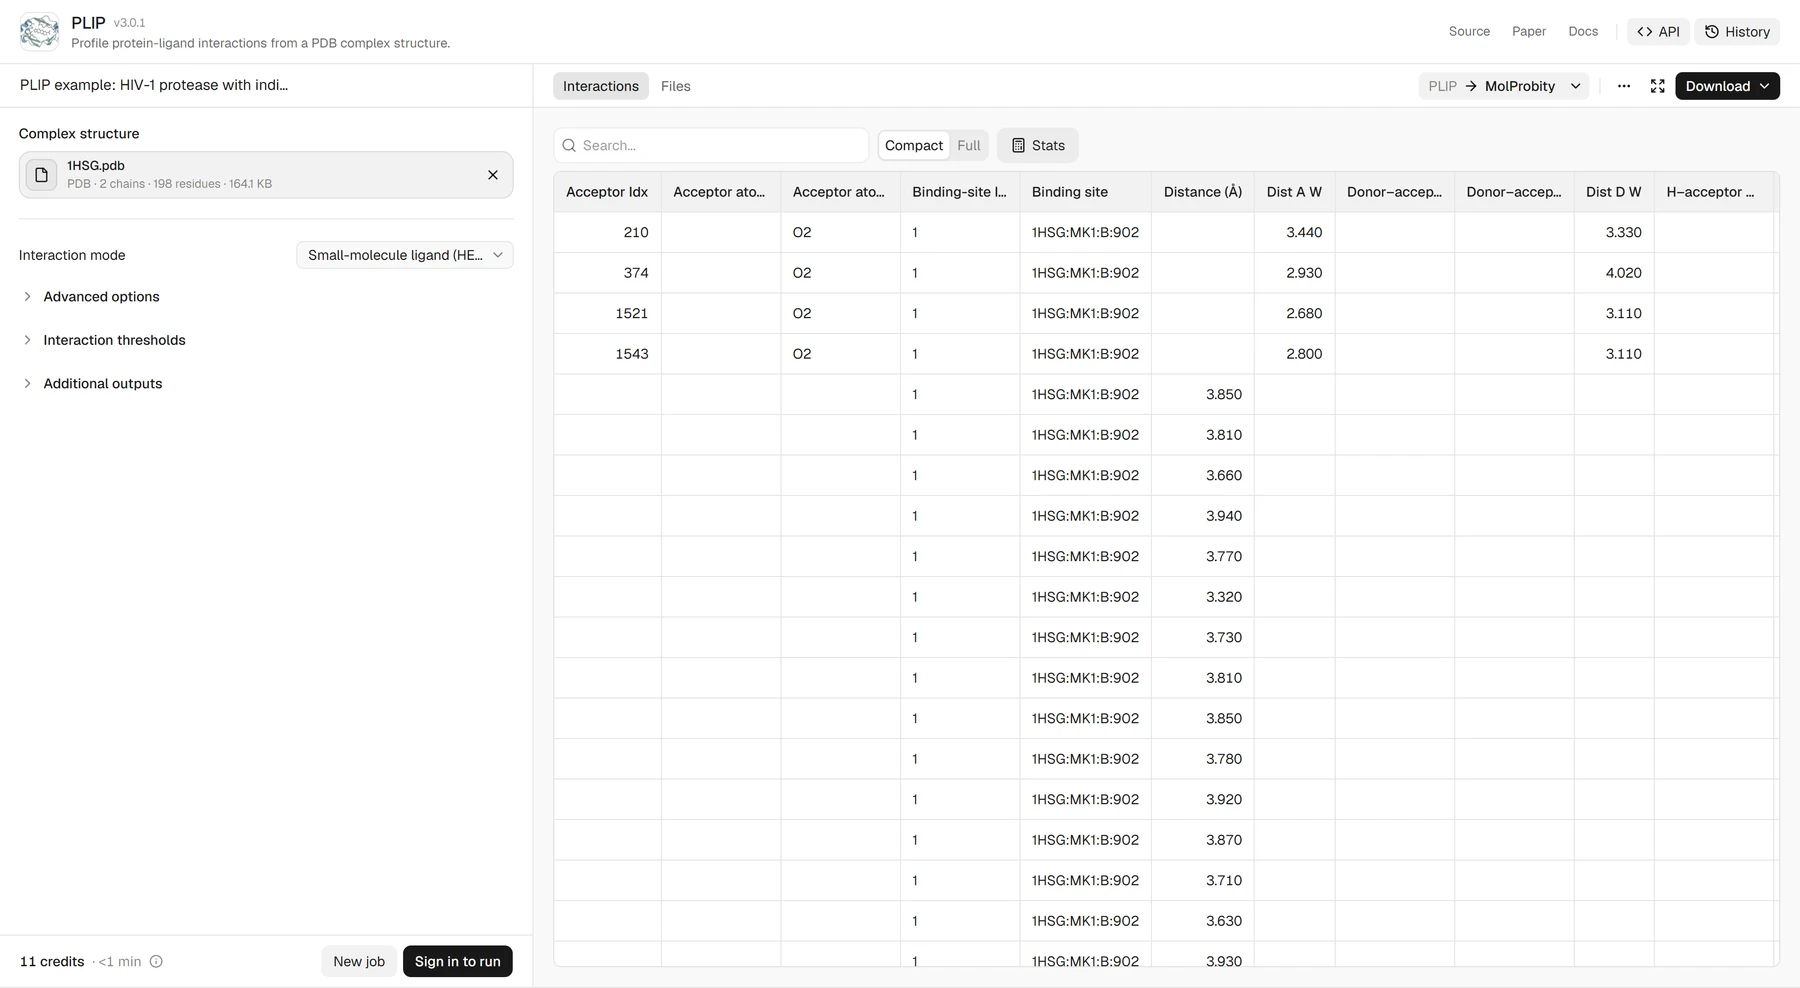
On 1HSG it reported 27 contacts for indinavir. Fifteen are hydrophobic, spread over 13 residues. The 6 hydrogen bonds all go to chain B, to Arg8, Asp25, Gly27 and Asp29. Two salt bridges join the ligand's amine to Asp25 of each chain, at 4.50 and 5.26 Å, and four water bridges pass through crystal waters to Gly27, Gly48 and Ile50 of chain A. It found no π-stacking, halogen bonds or metal complexes. Of the tools here only PLIP sees the waters, and in HIV protease the water held under the flaps is part of how inhibitors bind.
What PLIP will not give you is a picture to paste into a slide. Its output is tables, XML and text, and any image comes through PyMOL, which is optional.[8]
Installing it yourself means Docker, pip install plip or the source, plus OpenBabel 3 with Python bindings of the same version; our local run then took about a second. The hosted version on ProteinIQ skips that install, takes a PDB file or an RCSB ID, lets you change every interaction threshold, and returns the same XML and text reports. A docked receptor and ligand in separate files have to be merged into one PDB first.
PLIP price: Free and open source under GPL-2.0. On ProteinIQ a single-model run costs 11 credits, quoted before you submit, and a free account gets 200 credits a month.
Best free alternatives for a 2D interaction diagram
PoseView and LigPlot+ draw the same kind of picture, the ligand as a flat formula with residues around it. PoseView runs in a browser in seconds; LigPlot+ lets you drag every element into place, but you may not be able to download it.
PoseView (Web)
PoseView pros:
- A clean diagram from a PDB code in seconds, downloadable as PNG, SVG and PDF
- Free for academic and commercial use, with a REST API
PoseView cons:
- No distances, no water bridges and no documented cutoffs
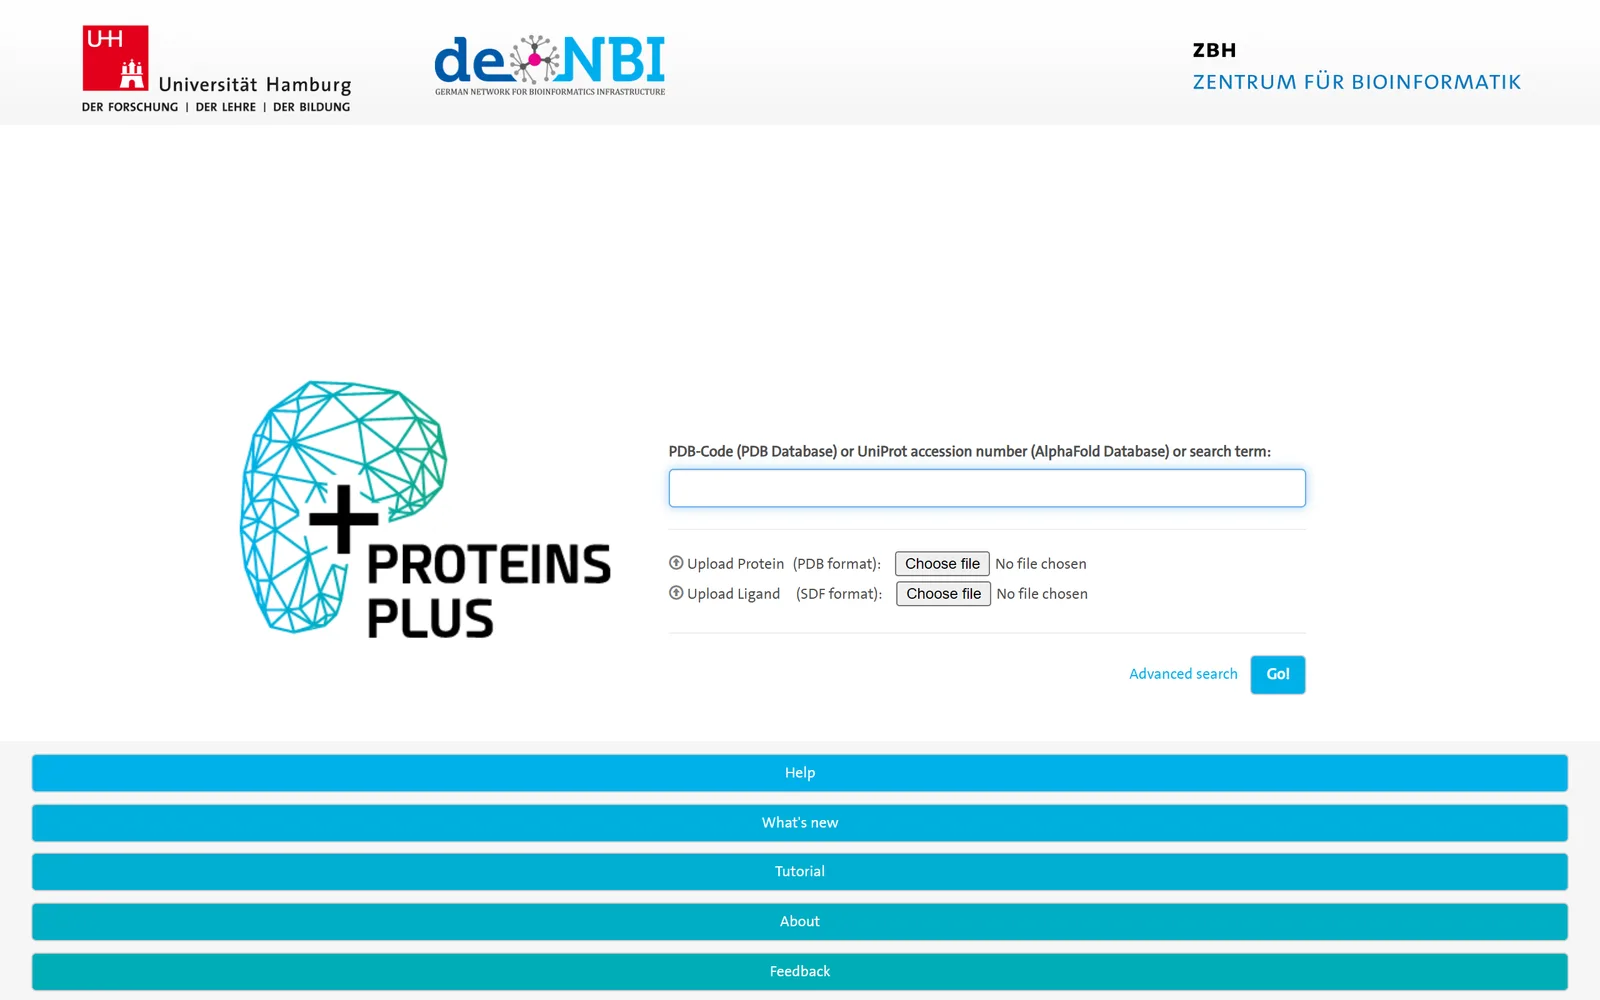
PoseView comes from Matthias Rarey's group at the University of Hamburg, whose 2010 paper set out to draw every complex in the PDB in two dimensions.[11] You reach it through ProteinsPlus: type a PDB code or upload a file, optionally add the ligand as SDF, choose the ligand and the diagram appears. The service is free for academic and commercial purposes and asks to be cited.[9] Its REST API accepts 30 jobs a minute, which is how we ran 1HSG without a browser.[10]
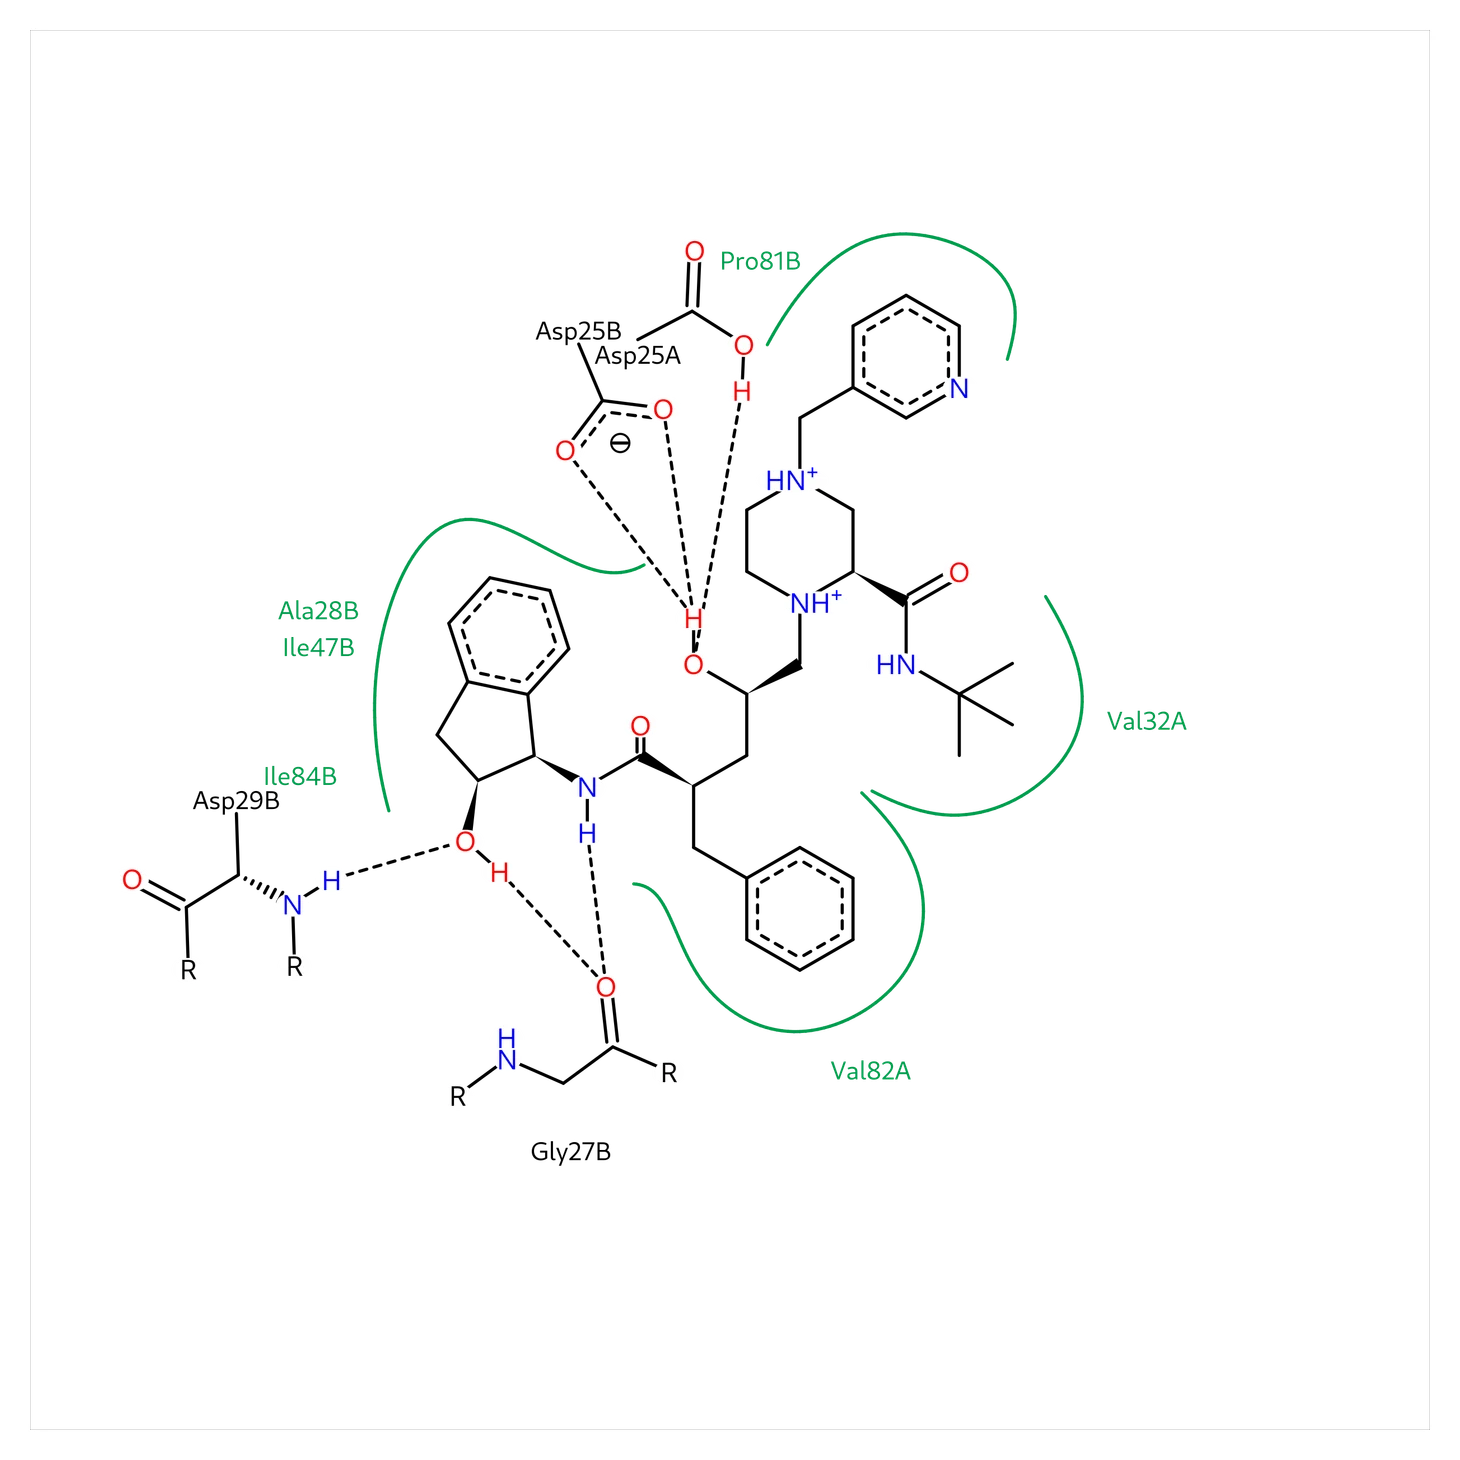
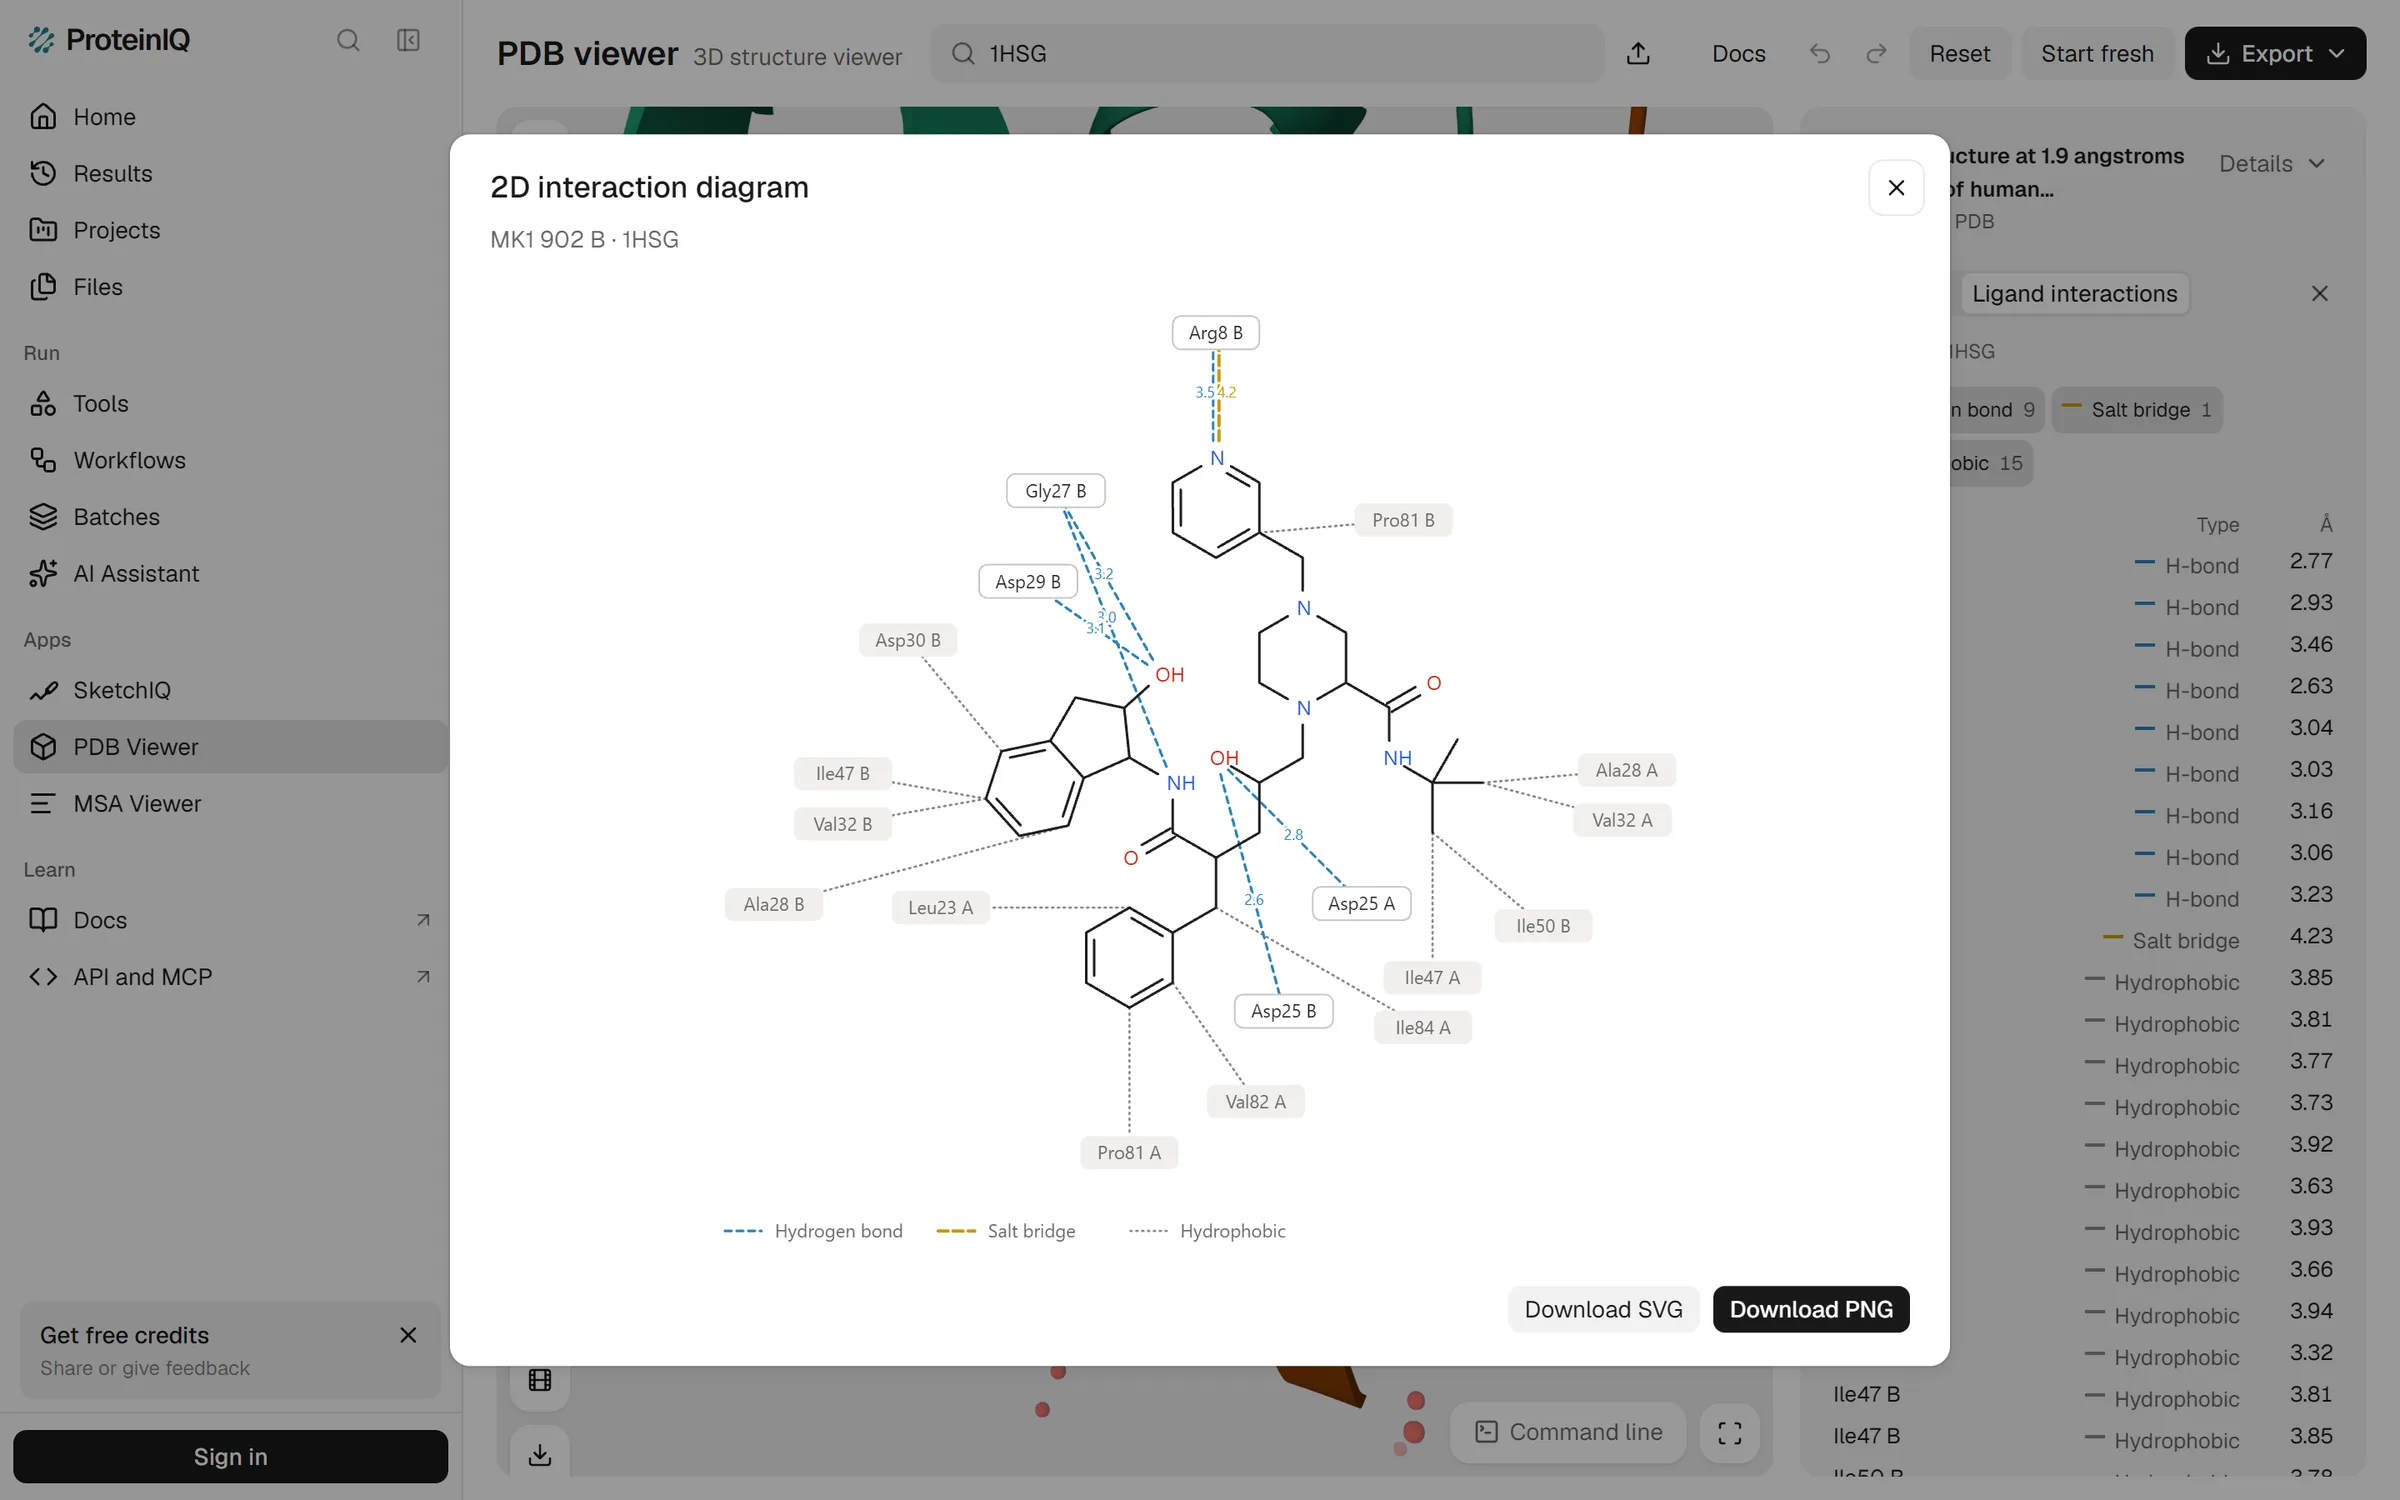
Counted from the picture, the diagram has six dashed hydrogen bonds to four residues (Asp25 of both chains, Gly27 and Asp29 of chain B) and four green arcs around six hydrophobic residues. There is no line to Arg8 and nothing through water. It is the most readable figure of the lot and the least informative: without distances you cannot tell a 2.6 Å bond from a 3.4 Å one. The help pages list no interaction types or cutoffs, so treat the drawing as PoseView's judgement and check any contact you plan to discuss in 3D.
PoseView price: Free for academic and commercial use.
LigPlot+ (Java desktop)
LigPlot+ pros:
- The style most published interaction diagrams follow, editable on screen
LigPlot+ cons:
- No download link and no licence terms on EBI's page when we checked
Most interaction diagrams in papers from the last twenty years were drawn by LIGPLOT or its successor, or made to look as if they were. Laskowski and Swindells described it in 2011 as the Java successor to LIGPLOT, with diagrams you can rearrange by hand, hydrogen bonds as dashed lines and non-bonded contacts as spoked arcs.[5][4] PoseView borrowed the look.
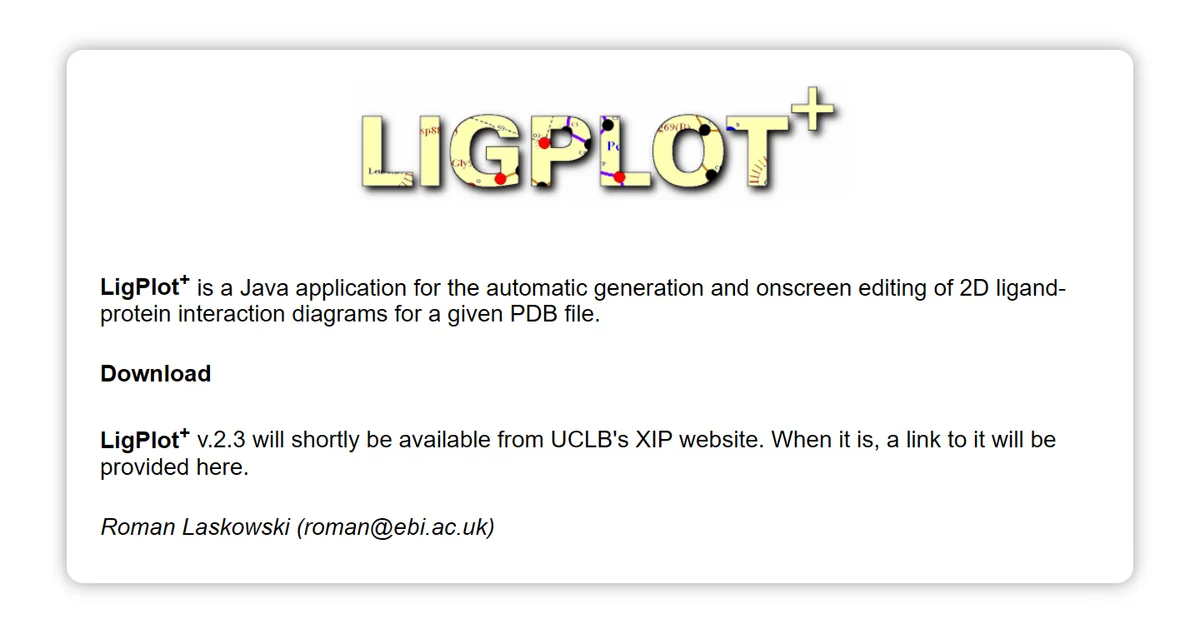
We could not run it. EBI's page said that version 2.3 would shortly be available from UCL Business's XIP website, with no download link and no licence terms.[4] Without the licence we cannot say whether commercial use is free, so ask the maintainer named on the page or check whether your institution already has a copy. PDBsum, the EBI database that served LigPlot diagrams for every PDB entry, was no substitute on the day either: its page said the service was unavailable and likely to remain so.
LigPlot+ price: Not stated on EBI's page.
Best free alternatives for checking contacts in 3D
A flat diagram cannot show whether a contact points the right way. For that you want the contacts drawn on the structure, and both of these do it in a browser. The PDB viewer adds a table and a 2D diagram; Mol* gives you the lines and nothing else.
PDB viewer by ProteinIQ (Web)
PDB viewer pros:
- Contacts in 3D, a sortable table with distances and a 2D diagram, all from one click
- Free with no install or account, and the table downloads as CSV
PDB viewer cons:
- No water-mediated contacts, and its charge assignment produced a salt bridge to a pyridine in 1HSG
- The diagram does not record the thresholds behind it
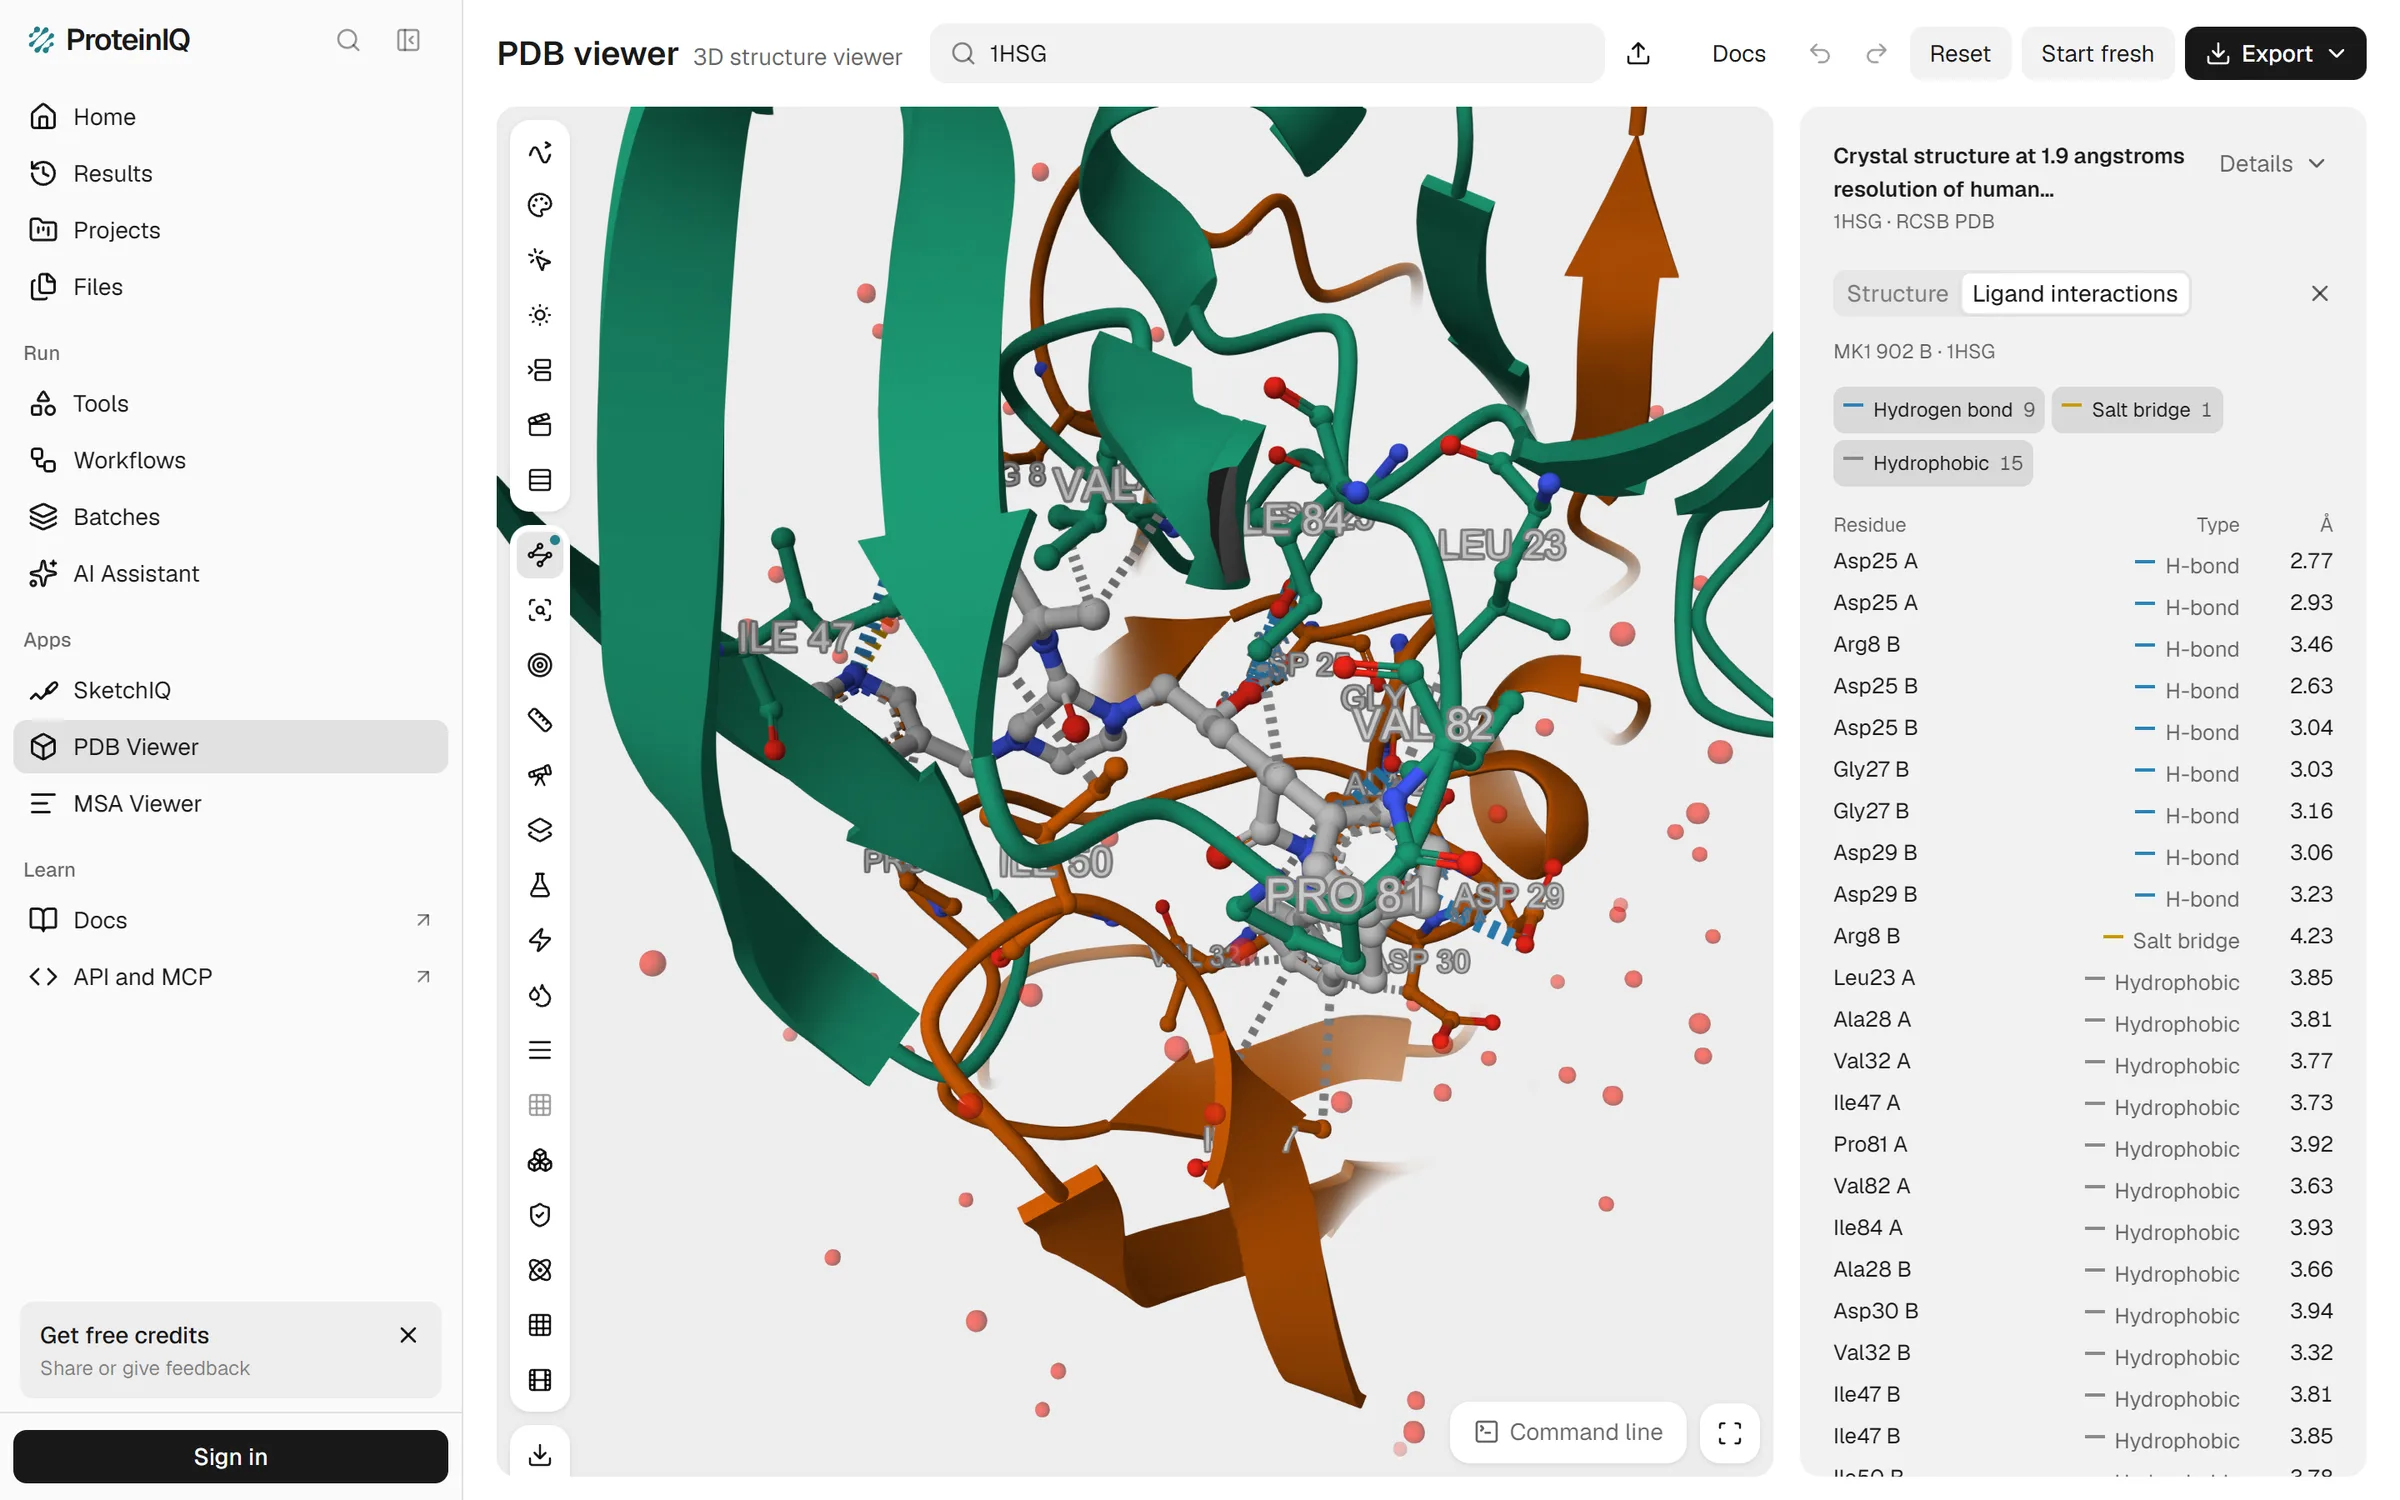
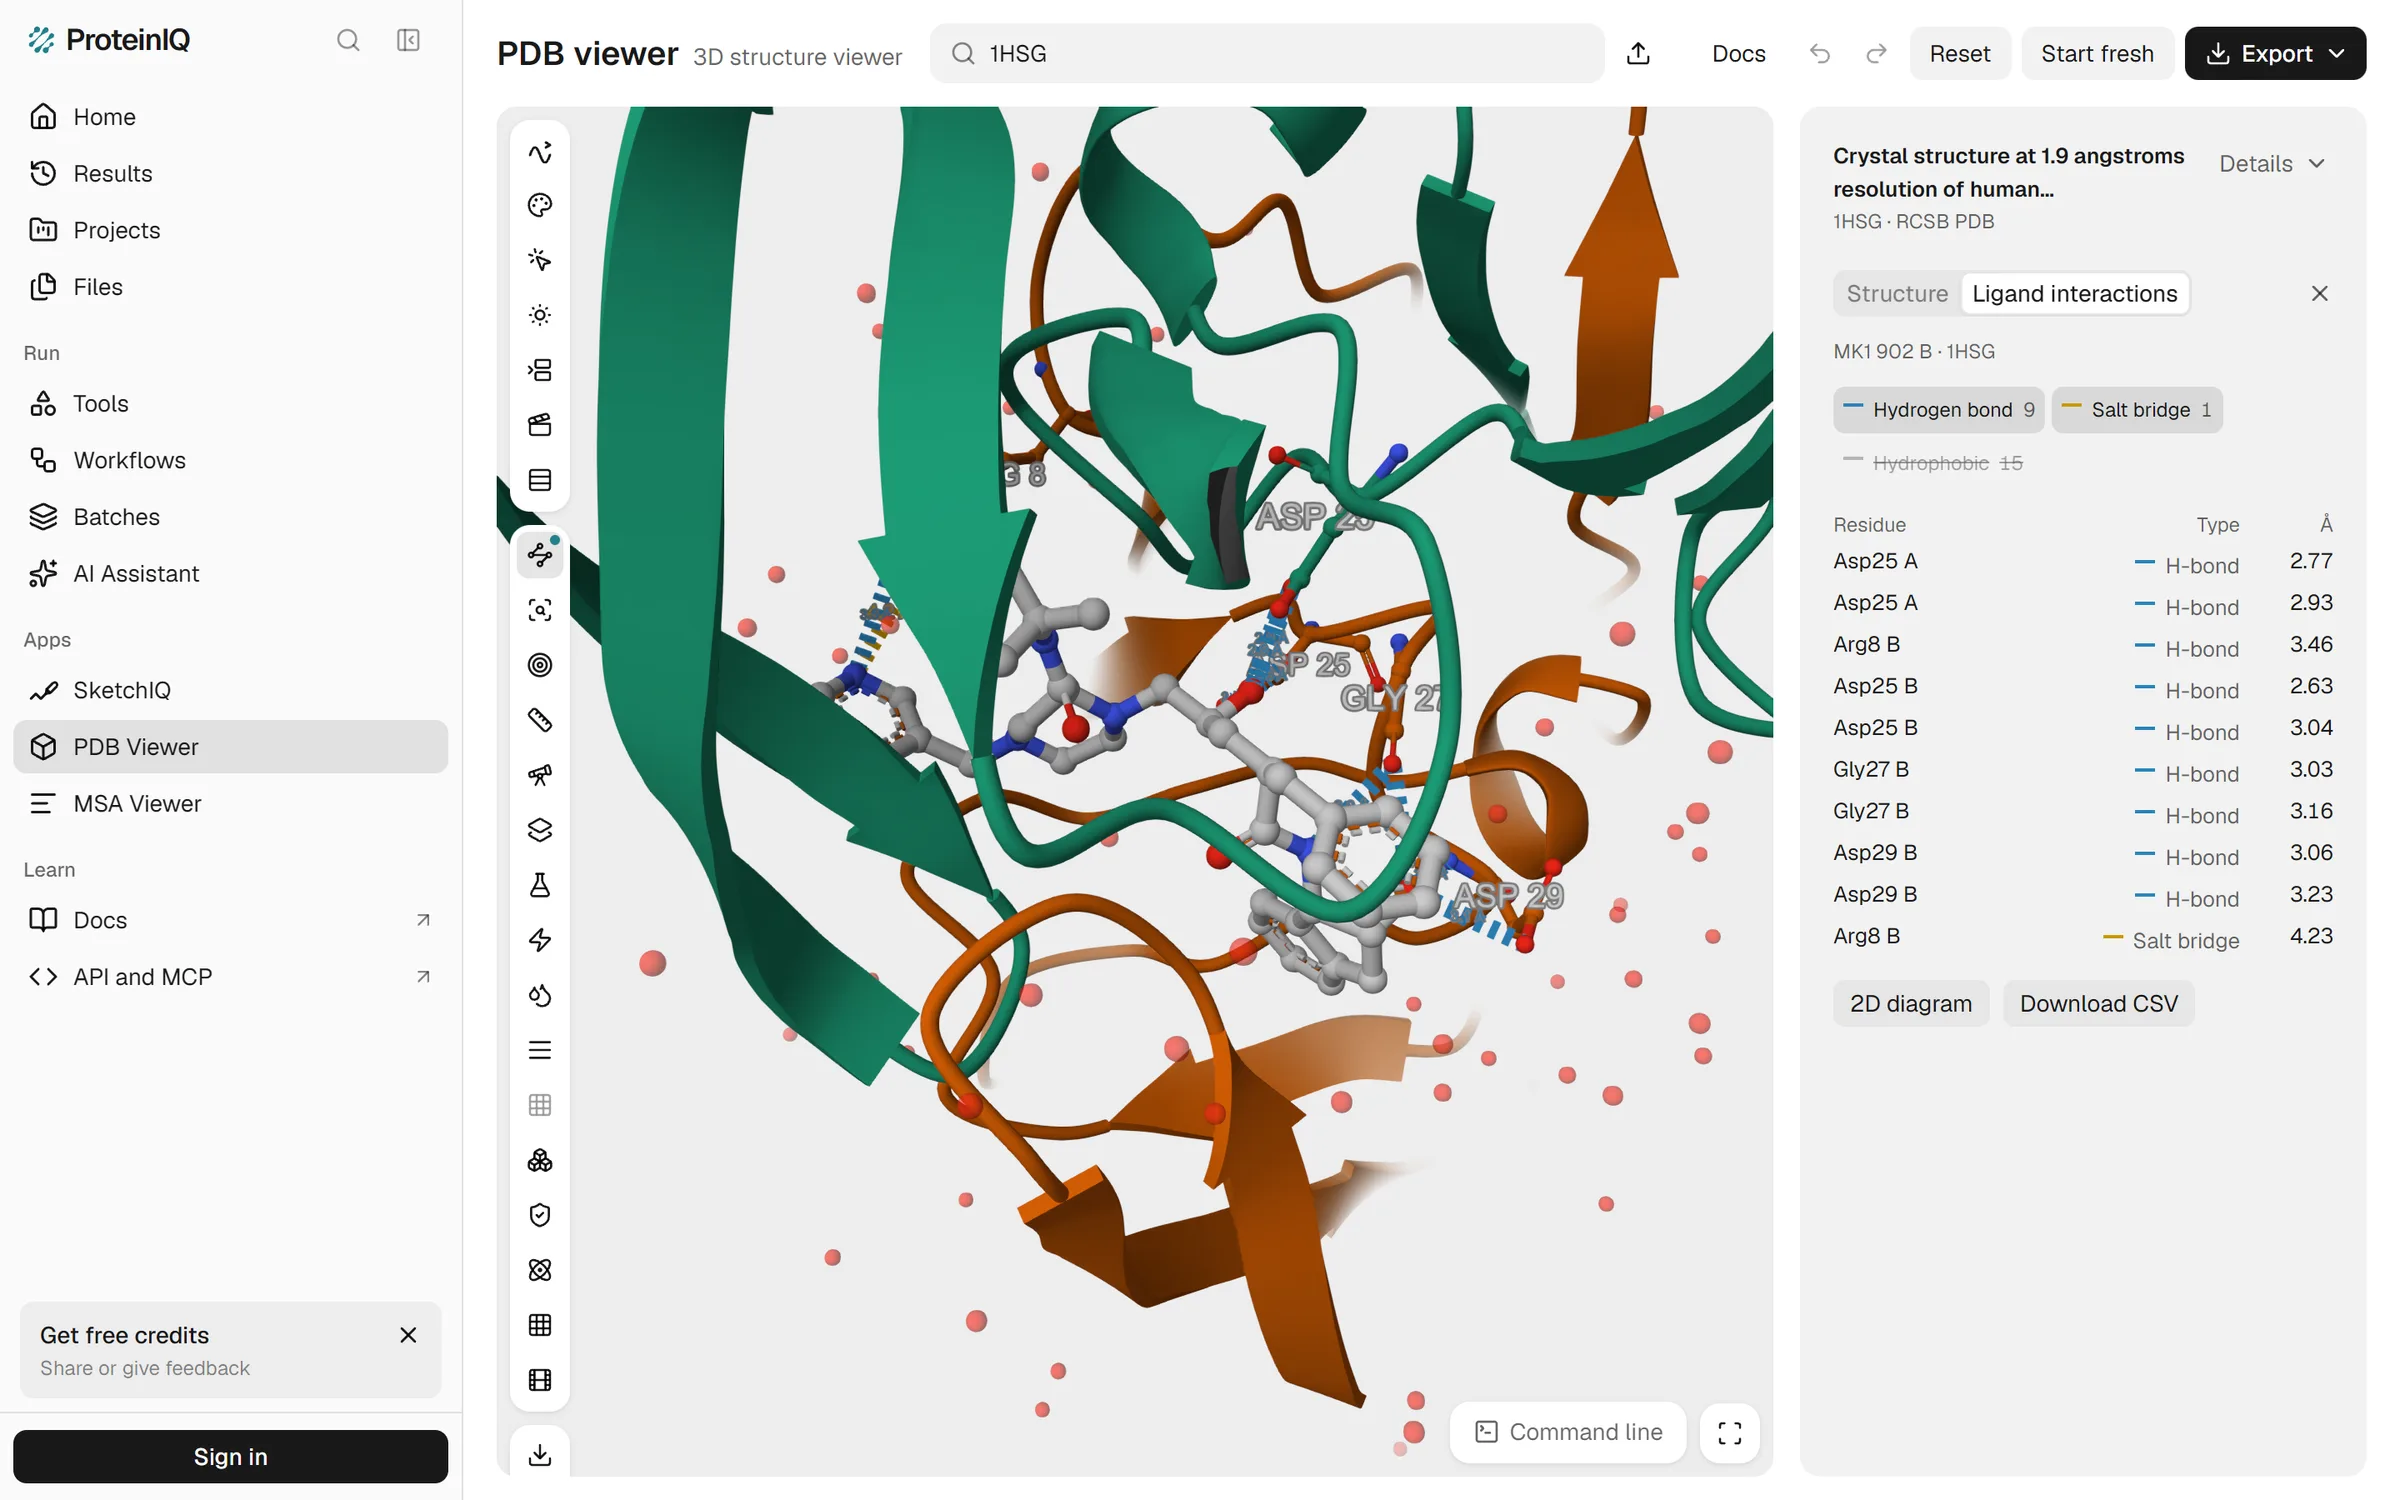
Open 1HSG, choose Ligand interactions in the left toolbar and pick the ligand, and the viewer draws dashed lines from indinavir to every contacting residue. For MK1 the side panel counts 9 hydrogen bonds, 1 salt bridge and 15 hydrophobic contacts, each row with its residue, type and distance. The chips above the table switch a type off in the table and in 3D at once, which is the quickest way to see just the polar network (Figure 7).
2D diagram turns the same contacts into a flat drawing, with hydrogen bonds as blue dashed lines, the salt bridge in gold and hydrophobic contacts as grey dotted lines, each polar contact labelled with its distance. It saves as SVG or PNG. In 1HSG the drawing puts Arg8 of chain B on the pyridine nitrogen with both a hydrogen bond at 3.5 Å and a salt bridge at 4.2 Å.
That salt bridge is the weak spot. A pyridine is rarely protonated at neutral pH, so the line says more about how the viewer assigns charge than about the complex. The limits come from Mol*'s defaults, as the viewer's documentation states: 3.5 Å between donor and acceptor for a hydrogen bond, 5.0 Å between charged groups for a salt bridge and 4.0 Å between carbons for a hydrophobic contact.
The longest contacts it listed in 1HSG, 3.46, 4.23 and 3.94 Å, fit those limits. The diagram does not carry them, though, so for a methods section you would still quote PLIP.
PDB viewer price: Free, with no account needed to view.
Mol* (Web)
Mol* pros:
- Contacts appear as soon as you click a ligand in any PDB entry
- Open source under the MIT licence, and the same view the RCSB PDB uses
Mol* cons:
- No 2D diagram and no list of contacts to count or export
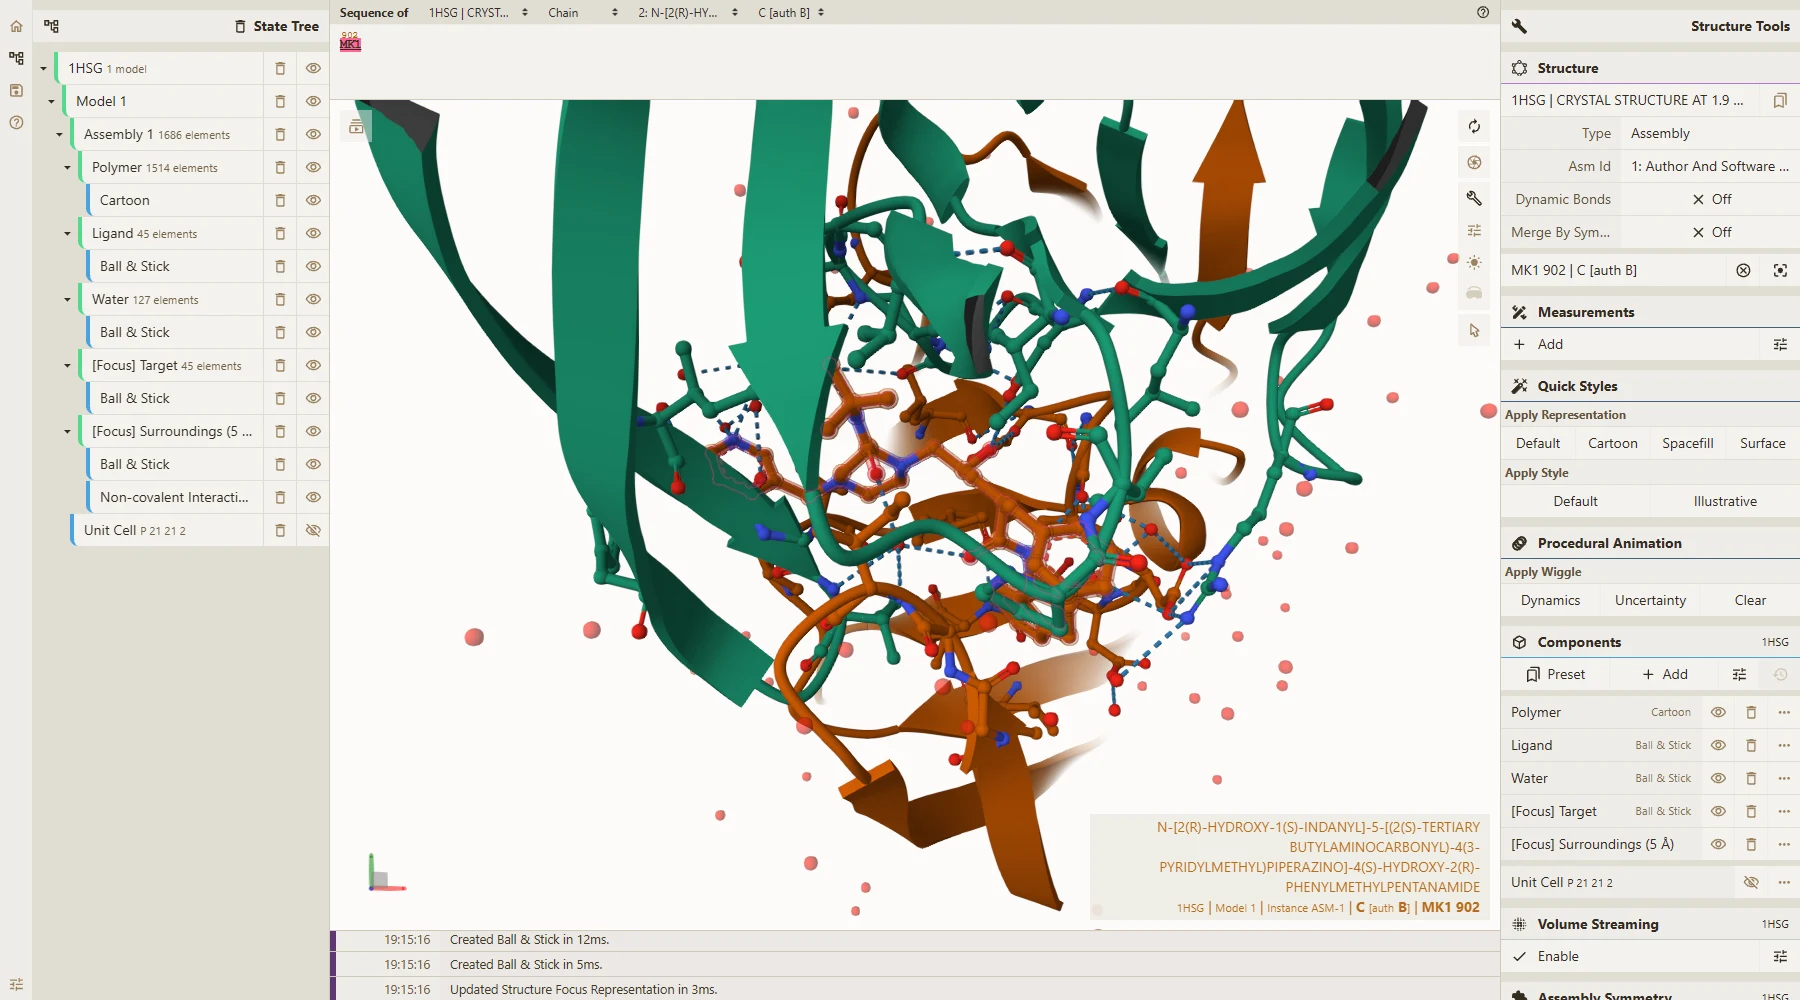
Mol* is the open-source viewer behind the RCSB PDB's 3D view and the AlphaFold Database, and it is also the engine inside the PDB viewer above.[13] Click indinavir at molstar.org/viewer/?pdb=1hsg and it zooms to the ligand, shows the residues within 5 Å and draws dashed lines for hydrophobic contacts, hydrogen bonds, halogen bonds, metal interactions and π interactions, each type with its own toggle.[14]
We did not count its lines separately. Since the PDB viewer uses Mol*'s default geometry, the two should agree, but we have not checked contact by contact. For a quick look with no account, Mol* is the fastest route here. For anything you need to write down, use one of the tools above.
Mol* price: Free and open source under the MIT licence.
Why the programs count different contacts
Table 2 sets the three runs side by side. PLIP's counts come from its XML report, the viewer's from its contact table and PoseView's from our reading of its diagram.
| Contact type | PLIP 3.0.1 | PoseView | PDB viewer by ProteinIQ |
|---|---|---|---|
| Hydrogen bonds | 6, with 4 residues | 6 drawn, with 4 residues | 9, with 5 residues |
| Hydrophobic contacts | 15, with 13 residues | 4 arcs around 6 residues | 15, with 13 residues |
| Salt bridges | 2 (Asp25 of each chain) | None drawn | 1 (Arg8 of chain B) |
| Water bridges | 4, with 3 residues | None drawn | Not reported |
The hydrophobic contacts match exactly. PLIP and the viewer list the same 15 on the same 13 residues at the same distances, from Leu23 of chain A at 3.85 Å to Val32 of chain B at 3.32 Å, because both use a 4.0 Å limit between carbons. PoseView folds them into four arcs around six residues and labels Ile84 as chain B, where the other two put it in chain A.
The hydrogen bonds overlap only in part. Five appear in both lists at identical distances, among them Gly27 at 3.03 and 3.16 Å and Asp29 at 3.23 Å. PLIP adds one the viewer lacks, Arg8 of chain B to the pyridine nitrogen at 4.07 Å, inside PLIP's 4.1 Å limit and outside the viewer's 3.5 Å. The viewer adds four that PLIP lacks, at 2.63 to 3.06 Å, three of them from the central hydroxyl to Asp25 of both chains.
Those four are short, so distance is not the reason. PLIP also tests an angle at a hydrogen it places itself, and a hydroxyl hydrogen can point at only one aspartate oxygen at a time; the viewer's documentation mentions no angle test. We have not measured the angles, so that is the likely explanation rather than a finding. The salt bridges share nothing at all: PLIP's two run from the tertiary amine to Asp25 of chain A at 5.26 Å and of chain B at 4.50 Å, the first beyond the viewer's limit, and the viewer's one goes to the pyridine.
So no program's count is the count. If a contact matters to your argument, name the program, its version and its thresholds, and look at the contact in 3D before you write about it. How each of the protein-ligand interaction types is defined decides which lines appear in the first place.
Is Discovery Studio Visualizer free?
BIOVIA calls it free, and the download page asks you to register through a form to receive it.[1][2] What the public pages do not say is on what terms: there is no licence text, version or list of supported systems. The full Discovery Studio, with simulations and most advanced features, is a paid product.[3] If you plan to use the visualizer at a company, read the licence the installer shows you first.
Other Discovery Studio Visualizer alternatives to consider
Maestro, Schrödinger's modelling suite, draws the Ligand Interaction Diagram that many medicinal chemists know, and it is the paid tool these free ones are most often compared with. Schrödinger sells academic licences to individuals, departments and institutions, and offers a separate Maestro Viewer it calls free to academia, which cannot run property predictions or simulations.[12] We tested neither, so we cannot say whether the free viewer draws the diagram. If your lab already has Maestro, use it.
The full Discovery Studio does everything the visualizer does and adds modelling and simulation, under a paid licence.[3] It is worth asking for only if you need those, not for diagrams.
Which Discovery Studio Visualizer alternative should you choose?
For a slide tomorrow morning, PoseView gives the tidiest diagram with nothing to install, as SVG. For a paper, run PLIP, locally or on ProteinIQ, report its version and thresholds, and draw the figure from its list. For a docked pose you just want to sanity-check, open it in the PDB viewer or Mol* and look at the contacts in 3D; visualizing docking results walks through what to look for after an AutoDock Vina run.
Discovery Studio Visualizer, LigPlot+ or Maestro are still worth using if your institution already has them, particularly Discovery Studio Visualizer when you want its monitors for unfavourable and unsatisfied interactions. Just do not compare their counts with another program's without reading both sets of cutoffs. If you also need a general viewer to replace PyMOL, the PyMOL alternatives cover that side.