How to read an electron density map: 2Fo-Fc and Fo-Fc
What the blue and green mesh says about a ligand, and what it cannot

Matic Broz, PhD15 min
What do the 2Fo-Fc and Fo-Fc maps show?
A 2Fo-Fc map shows where the experiment puts electrons, and an Fo-Fc map shows where the model and the experiment disagree. Together they are the first thing to look at when a crystal structure matters to you, because every atom in a PDB file is an interpretation of them.[1]
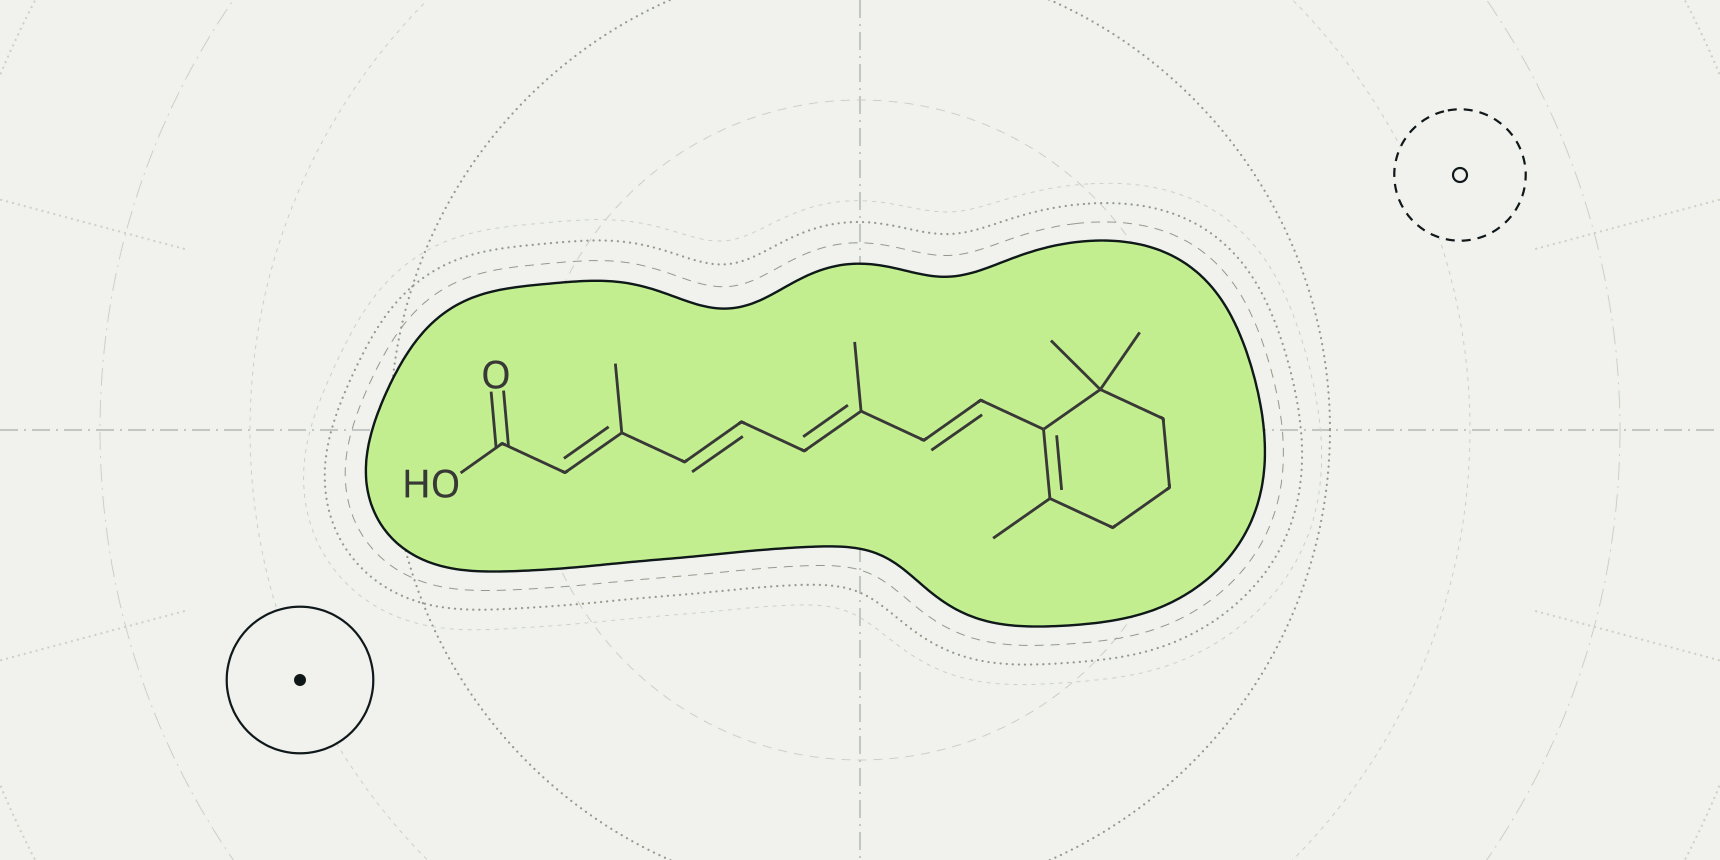
Take two ligands from the PDB, opened the same way. In 1CBS, a retinoic acid sits inside the blue 2Fo-Fc mesh with every one of its 22 atoms above 1.5 σ, and the green and red meshes around it are empty. In 8YRH, a 26-atom rosmarinic acid sits in almost nothing: its median 2Fo-Fc value is 0.66 σ, and 11 atoms lie inside negative Fo-Fc density below -3 σ (Table 3).
Both are deposited, validated entries with a ligand in the coordinates. Only the map tells them apart.
The PDB viewer by ProteinIQ loads both maps from PDBe with one click for X-ray entries, so the check takes a minute.

Both maps are Fourier syntheses, sums over every measured reflection of the crystal. The observed amplitudes come from the diffraction experiment. The calculated amplitudes and the phases come from the model, because the experiment cannot measure phases. The weights and come from a statistical estimate of how reliable the model's phases are.[4]
Here is the volume of the unit cell and a position in it. The first line is the 2Fo-Fc map (written 2mFo-DFc once the weights are included), and the second is the Fo-Fc difference map. Since , the first map is the observed density with the difference map added on top. That is why it shows the model and also tilts towards what is missing from it.[1]
A difference map is positive where the data hold more density than the model explains and negative where the model has atoms the data do not support. The wwPDB validation reports build their 2mFo-DFc maps with REFMAC from the deposited model and structure factors, so the fit they report is judged against a map of this kind.[3]
What contouring in σ means
A density map is a grid of numbers, and a mesh is the surface where the grid crosses one chosen value. Crystallographers state that value in units of σ, the root-mean-square deviation of all grid points from their average.[1]
A contour at therefore sits standard deviations above the map's mean, so the same level means the same thing for a well-ordered crystal and for a poor one. It does not mean the same absolute electron count, which is why maps from different entries cannot be compared by their raw values.
The usual levels are about 1 σ for a 2Fo-Fc map and ±3 σ for an Fo-Fc map.[1] Deller and Rupp draw their ligand figures at 2 σ,[2] and the PDB viewer opens 2Fo-Fc at 1.5 σ and Fo-Fc at +3 σ in green and -3 σ in red (Table 1). Lower levels show more of the model and more noise too; Wlodawer and colleagues warn that a low contour may emphasize noise instead of real features.[1]
| Map | Level | Where it is used | What to expect |
|---|---|---|---|
| 2Fo-Fc | About 1 σ | Usual display level | Model density plus some noise |
| Fo-Fc | +3 σ and -3 σ | Usual display level | Peaks worth a look, positive or negative |
| 2Fo-Fc | 2 σ | Ligand figures in Deller and Rupp | Fewer, firmer features |
| 2Fo-Fc and Fo-Fc | 1.5 σ; +3 σ and -3 σ | PDB viewer defaults | Blue mesh; green and red meshes |
The ±3 σ rule has a statistical reading, though a loose one. We calculated that if map noise followed a normal distribution, only 0.13% of grid points would exceed +3 σ by chance, against 15.9% above +1 σ. Real maps are not that tidy, so treat 3 σ as a convention that makes a peak worth examining and not as a significance test.
Why a map can flatter the model
Both maps lean on phases from the model, and phases dominate how a Fourier map looks. Wlodawer and colleagues explain that wrong phases keep reproducing the same wrong features, which in turn produce the same wrong phases, so a mistake in the model can survive refinement. This is model bias.[1]
A map phased with a ligand in place is the weakest test of that ligand. Deller and Rupp note that the maps the public servers calculate use phases from the whole protein-ligand model and are therefore biased towards the presence of the ligand, not its absence. Poor density in such a map is a strong warning.[2]
The remedy is an omit map: delete the suspicious part, refit and look again at the difference density. Deller and Rupp add that a real omit map has to be recalculated with crystallographic software and cannot be read off the public maps.[1][2] Whether the density really supports a ligand is then a judgement about shape, and that judgement is subjective for ambiguous density.[6]
What density looks like at 1.5, 2.5 and 3.5 Å
Resolution sets how much the map can show. Wlodawer and colleagues describe a progression. At low resolution individual atoms cannot be located, but known stereochemistry lets a builder place residues. With better data the peaks separate, and at atomic resolution, about 1.2 Å, peaks are resolved and their height distinguishes atom types.[1]
About 1.5 Å matches a typical C-C bond length, and medium resolution starts near 2.7 Å, where well-defined water molecules first become possible.[1]
We measured what that does to one ligand. Heme (HEM) is rigid, flat and common, so we sampled its 43 heavy atoms in three X-ray entries solved at about 1.5, 2.5 and 3.5 Å (the heme rows of Table 3). At 1.45 Å every heme atom sits above 1.5 σ. At 2.5 Å, 8 of 43 sit below 1 σ, and at 3.5 Å, 12 of 43 do, even though the wwPDB correlation between model and map for that heme is still 0.977.
Three entries show no trend, only that a good fit at low resolution is a lower, flatter map.
Open the maps in the PDB viewer
To look at the maps yourself, open the PDB viewer and search for an X-ray entry by its PDB ID, such as 1CBS. In the Density map tool, the X-ray tab has Load electron density. The viewer fetches the 2Fo-Fc and Fo-Fc maps that the PDBe density server computes from the structure factors deposited with the entry, and draws them as meshes: blue 2Fo-Fc at 1.5 σ, green Fo-Fc at +3 σ and red Fo-Fc at -3 σ, cut to within 5 Å of the largest ligand.
σ in the viewer is the standard deviation of the whole map, not only of the part on screen, so a level keeps its meaning when the mesh is carved. The maps around list switches to another ligand, Centre moves the view there, and the contour of each map can be changed in σ or absolute units. In the command line, xraymap 1cbs does the same as the button.
Entries with no deposited structure factors have no map, and neither do NMR or cryo-EM entries. How to open a PDB file in the viewer in the first place is covered in its own guide.
Checking whether the data support the ligand
Look at the mesh first, then count. A supported ligand sits inside the blue mesh along its whole length, the mesh has the shape of the ligand, and the green and red meshes beside it are empty.
An unsupported one sits outside the mesh, or only part of it is covered, and red density covers its atoms, a sign the data do not want atoms there. Green peaks next to a ligand mean the model has missed something nearby, such as a second conformation, a water or a larger ligand.
The wwPDB report also gives a number. For standard residues the validation report uses a normalized real-space R value, RSRZ, and flags values above 2 as outliers. Ligands have too few examples for that normalization, so the report gives the real-space R, the real-space correlation coefficient and a local ligand density fit score instead.[3][5] The correlation is
summed over the grid points around the ligand, where is the density from the data and the density calculated from the model.[2] Deller and Rupp sorted 382,588 PDB ligands by it and found most fit well (Table 2).
| RSCC | Share of ligands | Reading |
|---|---|---|
| 0.9 to 1.0 | 67% | Fits the density |
| 0.8 to 0.9 | 21% | Fits partially, may be over-modeled |
| 0.7 to 0.8 | 7% | Significant parts outside the density |
| Below 0.7 | 5% | Very poor fit, density almost or completely absent |
We then sampled the five entries above. The wwPDB RSCC values come from the RCSB PDB.[7] For the map values, we downloaded PDBe's 2Fo-Fc and Fo-Fc files for each entry,[8] each covering the whole unit cell, set σ to the standard deviation of all grid values and read the map at every ligand atom by trilinear interpolation. The viewer's server may use a finer grid, so values in the viewer differ slightly.
| Entry | Ligand | Resolution (Å) | RSCC | Atoms | 2Fo-Fc median (σ) | Atoms below 1 σ | Fo-Fc range (σ) |
|---|---|---|---|---|---|---|---|
| 1DWR | Heme | 1.45 | 0.977 | 43 | 2.77 | 0 | -2.92 to 1.34 |
| 1CBS | Retinoic acid | 1.8 | 0.949 | 22 | 2.73 | 0 | -1.12 to 0.93 |
| 8YRH | Rosmarinic acid | 1.84 | 0.354 | 26 | 0.66 | 23 | -5.40 to -0.36 |
| 1XBN | Heme | 2.5 | 0.947 | 43 | 2.21 | 8 | -2.11 to 3.76 |
| 6KZT | Heme | 3.5 | 0.977 | 43 | 1.78 | 12 | -1.23 to 1.18 |
The 8YRH row is the one to read slowly. The model has 26 ligand atoms where the map holds almost no density, and the difference map goes as low as -5.4 σ. Even though this map is phased with the ligand in place, which should flatter it, the ligand finds no support.
That does not prove the compound is absent from the crystal. A weakly occupied or disordered ligand, or one built in the wrong place, would look the same here. It does mean the entry should not serve as a redocking reference without a second look.
| Check | Supported | Sign of trouble |
|---|---|---|
| Blue 2Fo-Fc mesh at about 1 to 1.5 σ | Covers the whole ligand and follows its shape | Covers part of it, or none of it |
| Red Fo-Fc mesh at -3 σ | Absent at the ligand | Sits on the ligand's atoms |
| Green Fo-Fc mesh at +3 σ | Absent nearby | Unexplained peaks beside the ligand |
| RSCC from the validation report | 0.9 or higher | Below 0.8 |
| Map type | Omit map also shows the ligand | Only a map phased with the ligand shows it |
| Resolution | Fine enough to see the ligand's shape | Too coarse to tell orientations apart |
A passing set of checks says the model matches the experiment. It says nothing about whether the ligand binds the way the paper argues, which is a question for protein-ligand interactions and, in solution, for biochemistry.
Density maps for cryo-EM
The word density map also names cryo-EM reconstructions, and the two are different objects. A crystallographic 2Fo-Fc map is phased by the model and carries the bias described above. A cryo-EM map comes from a different experiment, covered in cryo-EM against X-ray crystallography, and has no 2Fo-Fc or Fo-Fc maps of the kind described here.
The viewer opens EMDB maps by ID, such as EMD-33198, at the contour EMDB recommends; for that entry it is 8.46 σ. The σ scale is therefore not comparable between a cryo-EM and a crystallographic map, and for cryo-EM the recommended level from the depositors is the better starting point.
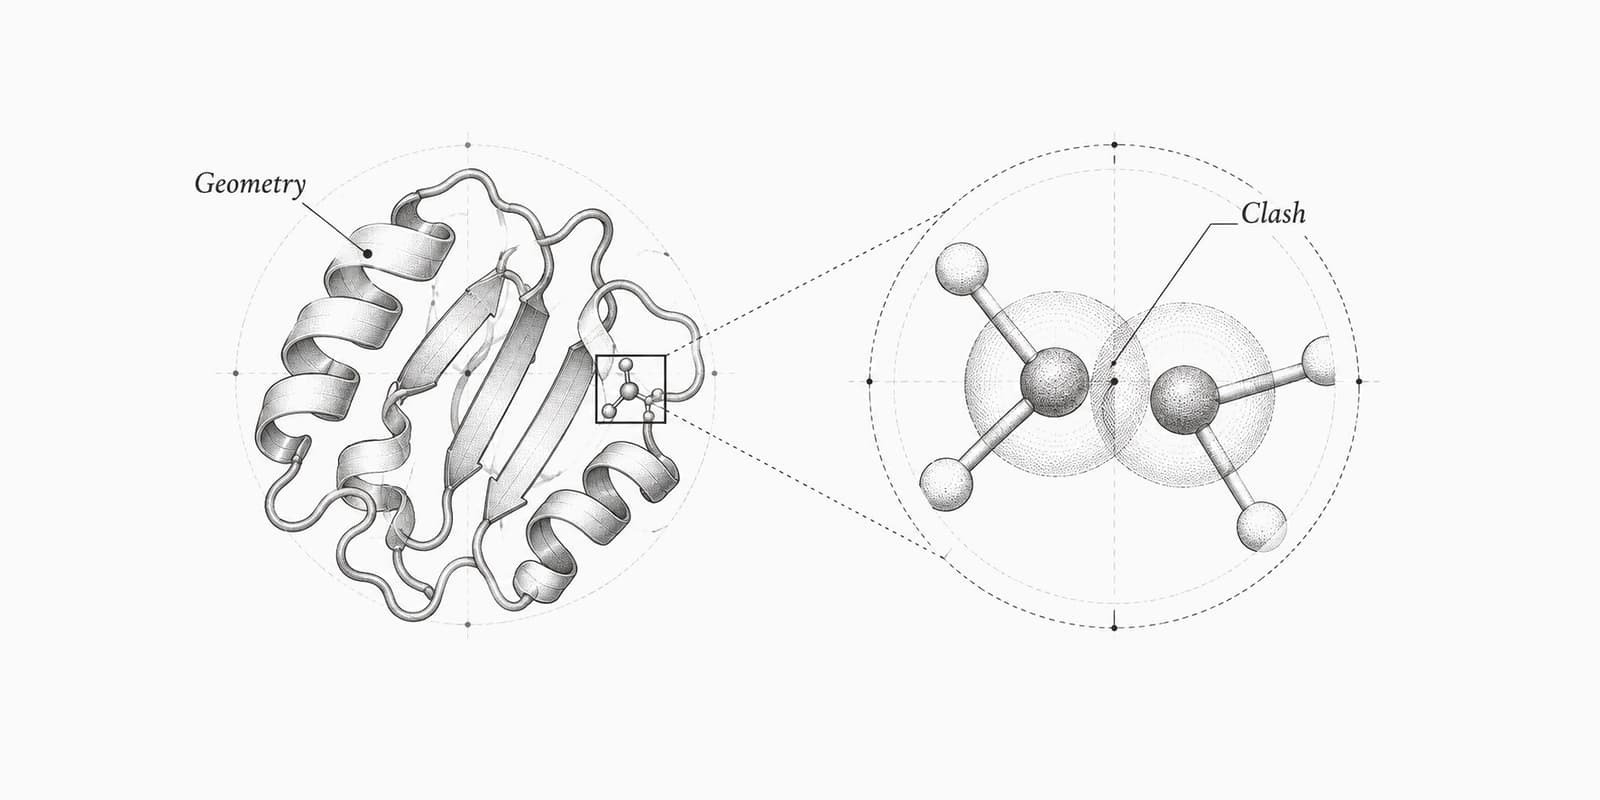
Geometry scores such as the Ramachandran plot, clashscore and MolProbity score check the model against chemistry. None of them looks at the map, so a model can score well and still sit in the wrong density.
Electron density tools on ProteinIQ
Start in the viewer with the maps, then check geometry and interactions.
| Task | Tool |
|---|---|
| Load 2Fo-Fc and Fo-Fc maps for an X-ray entry and inspect a ligand | PDB viewer |
| Download an entry by its PDB ID | PDB download |
| Score clashes, rotamers and geometry of the model | MolProbity |
| List the contacts a ligand makes with the protein | PLIP |
| Check that a ligand pose is physically plausible | PoseBusters |
Frequently asked questions
What is the difference between a 2Fo-Fc and an Fo-Fc map?
A 2Fo-Fc map, written 2mFo-DFc with weights, shows the density the experiment supports and is displayed around 1 σ. An Fo-Fc map is a difference map displayed at ±3 σ; positive peaks are density the model lacks and negative peaks are atoms the data do not support.[1]
What does contouring at 1 σ mean?
The mesh is drawn where the map equals its average plus one standard deviation, with σ taken over all points of the map. The same level means the same relative strength in any map, not the same absolute density.[1]
Why is the Fo-Fc contour usually ±3 σ?
It is the convention for difference maps because only a small fraction of grid points exceed it by chance. We calculated 0.13% above +3 σ for normally distributed noise, but real maps are not exactly normal, so a peak is a prompt to look, not proof.[1]
How do I know if a ligand is really in the density?
Check that the blue mesh covers the whole ligand, that no red mesh sits on its atoms and that no unexplained green peaks sit beside it. A validation RSCC of 0.9 or above fits the density, while below 0.8 means significant parts of the ligand are outside it.[2]
Can a map show a ligand that is not there?
Yes, when the map is phased with the ligand in place. Public maps are calculated that way and are biased towards the ligand's presence, so only an omit map recalculated without the ligand is a fair test.[2]
Does every PDB entry have an electron density map?
No. The viewer offers maps for X-ray entries with deposited structure factors, and NMR and cryo-EM entries have none of this kind. 1HSG is an X-ray entry with no map available.