Michaelis-Menten kinetics: Km, Vmax and kcat explained
Three fitted numbers that look like fixed properties of an enzyme

Matic Broz, PhD17 min
What are Km, Vmax and kcat?
Vmax is the fastest rate an enzyme sample reaches when substrate is saturating. kcat, the turnover number, is that rate per active site, so Vmax = kcat[E]total. Km, the Michaelis constant, is the substrate concentration at which the rate is half of Vmax. The ratio kcat/Km is the rate constant for enzyme meeting substrate at low concentration, and it is the number that best describes how good an enzyme is.
All three read like fixed properties of an enzyme, and none of them is. E. coli dihydrofolate reductase has a Km for dihydrofolate of 0.53 µM, yet dihydrofolate leaves the enzyme with a dissociation constant of 1.3 µM, so Km is not its affinity. Its kcat of 10.7 s−1 is not the speed of the chemistry either.[9] The hydride transfer runs at 950 s−1, and kcat is set by the product letting go.[10]
Predictions add a second layer. DLKcat puts the kcat of human carbonic anhydrase II at 1,218 s−1; the measured value is 1.4 million, about 1,150 times higher.[4] How far to trust any of these numbers comes down to three things: which step of the mechanism sets it, which substrate concentrations the fit covered and, for a prediction from DLKcat or CatPred, how close the enzyme is to the data the model learned from.
The Michaelis-Menten equation
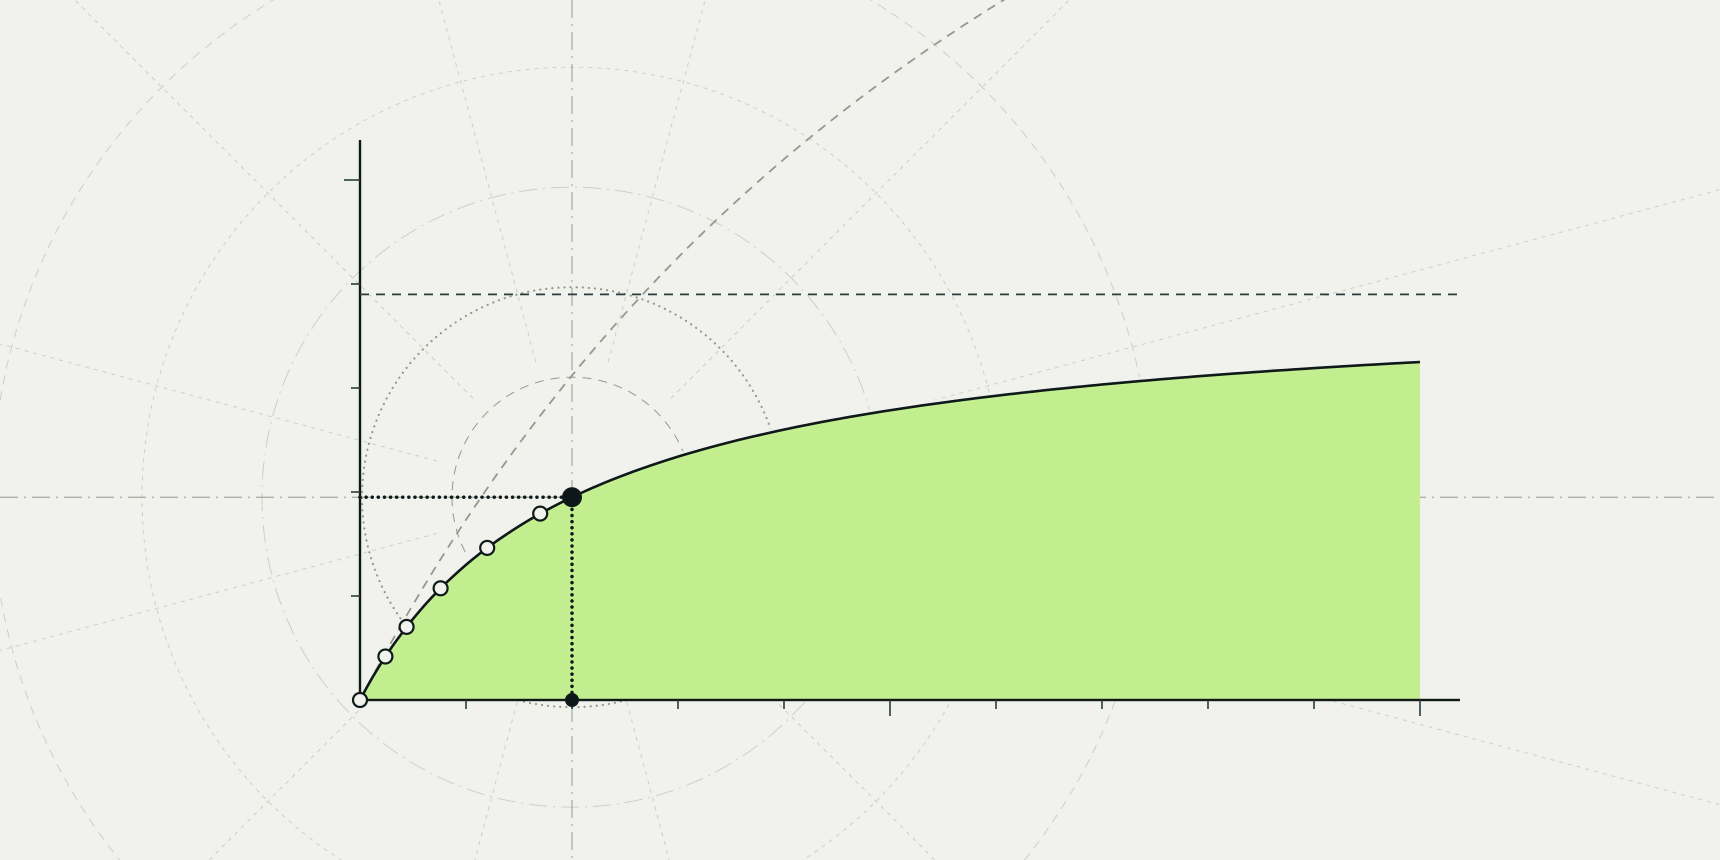
For one substrate S and an enzyme E that forms a complex ES before releasing product P, the initial rate v follows a rectangular hyperbola:
At low substrate the rate rises in proportion to [S], at [S] = Km it is half of Vmax, and at high substrate it flattens toward Vmax.
Leonor Michaelis and Maud Menten fitted this form to invertase data in 1913, assuming that the enzyme and sucrose reach binding equilibrium faster than the reaction proceeds.[1] In 1925 George Briggs and J. B. S. Haldane replaced that assumption with the steady state, in which ES forms and disappears at the same rate, and that is the version used today.[2]
The steady-state view is what makes Km slippery. For the simple scheme E + S ⇌ ES → E + P with rate constants k1, k−1 and kcat, the Michaelis constant is Km = (k−1 + kcat)/k1. It includes a catalytic term, and real mechanisms add more steps that change it further.
The equation also carries conditions that the numbers inherit. It describes initial rates, before product builds up and substrate is depleted, with substrate in large excess over enzyme. It assumes no inhibition by substrate or product and no cooperativity between sites. A Km or kcat belongs to one construct, one buffer, one pH and one temperature, and an enzyme with two substrates has a Km for each that depends on the concentration of the other.
Vmax and kcat set the ceiling on rate
Vmax is measured in concentration per time and depends on how much enzyme is in the cuvette, so it only means something together with the enzyme concentration. Dividing by the concentration of active sites gives kcat in s−1, which can be compared between labs. The division is where errors enter: a preparation that is half inactive gives a kcat half the true value, and total protein is not the same as active sites.
Across several thousand enzymes, Bar-Even and colleagues found a typical kcat of about 10 s−1.[3] The range is enormous. Rubisco fixes about 3.2 CO2 per second per site in spinach, while carbonic anhydrase II hydrates 1.4 million.[12][4] The fastest enzymes sit near a ceiling set by how fast molecules can diffuse.
The catch is that kcat reports the slowest step of the whole cycle, which is often not the chemical step. In E. coli dihydrofolate reductase, Fierke, Johnson and Benkovic showed that the release of tetrahydrofolate limits kcat, while hydride transfer runs at 950 s−1, roughly 90 times faster than turnover.[10] A mutation that speeds up the chemistry would not change kcat at all there, which is why engineers who read kcat as a measure of active-site chemistry are sometimes surprised.
Km is not an affinity
Km is printed in molar units like a dissociation constant, and textbooks often call a low Km "high affinity". That is true only when the chemical step is much slower than substrate dissociation, so that kcat is negligible against k−1 and Km collapses to Kd. In the simple scheme, any appreciable kcat pushes Km above Kd.
More steps can push it below. Class A β-lactamases such as TEM-1 form a covalent acyl-enzyme before hydrolysing it. From the expressions Matagne, Lamotte-Brasseur and Frère give for kcat and kcat/Km, Km equals the binding constant multiplied by k3/(k2 + k3), where k2 is acylation and k3 deacylation, so Km is smaller than the binding constant whenever acylation is fast.[6] Dihydrofolate reductase shows the same direction from a different cause: a Km of 0.53 µM against a binary-complex Kd of 1.3 µM.[9]
What Km does say is practical. It is the substrate concentration around which the rate responds to substrate, so comparing Km with the concentration of substrate in the cell tells you whether the enzyme runs near saturation or in proportion to supply. A typical Km is about 100 µM, with most values between 10 µM and 1 mM.[3] For inhibitors, the binding constant is Ki, and IC50 and Ki depend on Km in the assay for that reason.
kcat over Km measures specificity
At substrate concentrations well below Km, the Michaelis-Menten equation reduces to v = (kcat/Km)[E][S], a second-order reaction between enzyme and substrate. kcat/Km, in M−1 s−1, is therefore the rate constant that matters when substrate is scarce, which in cells it often is. When two substrates compete for one enzyme, the ratio of their rates equals the ratio of their kcat/Km values, which is why it is called the specificity constant.
Bar-Even and colleagues put the typical value at about 105 M−1 s−1.[3] Diffusion caps it at roughly 108 to 109, and a handful of enzymes reach that range: carbonic anhydrase II at 1.5 × 10⁸ and TEM-1 with benzylpenicillin at 4.1 × 10⁷.[4][5] For triosephosphate isomerase, Blacklow and colleagues concluded that the rate is limited by substrate reaching or leaving the active site rather than by the chemistry.[8]
kcat/Km has a second advantage that is easy to miss: it is the best-determined number in a kinetic experiment. The next section shows why.
How the substrate range decides what you can fit
Km and Vmax are fitted from initial rates at several substrate concentrations, and the fit can only recover what the data cover. Rates measured below Km lie on the nearly straight part of the curve, whose slope is Vmax/Km. Many pairs of Vmax and Km give the same slope, so the data fix their ratio and leave each value loose.
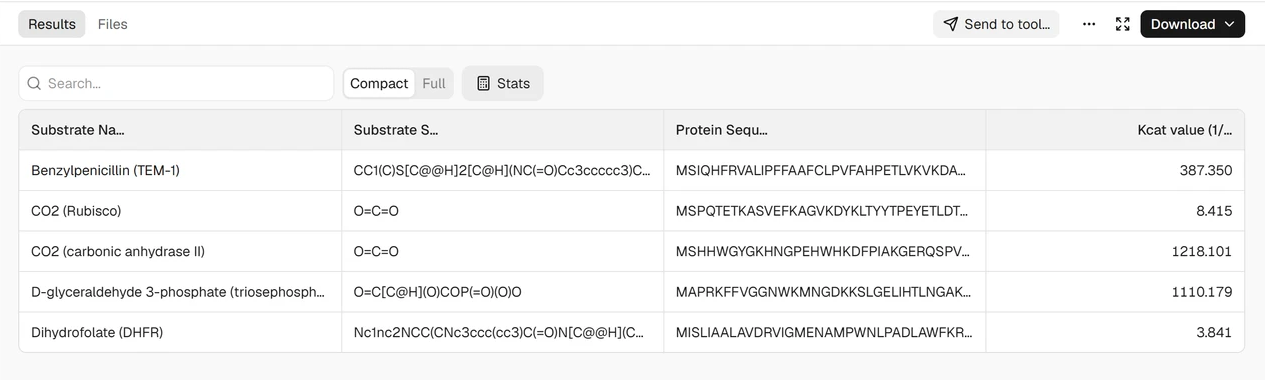
We simulated how much that costs. The true curve had Km = 1 and Vmax = 1, with eight substrate concentrations spaced evenly on a log scale and noise of 2% of Vmax plus 5% of each rate, a modest error for a plate-reader assay. Each of three designs was repeated 10,000 times and fitted by nonlinear least squares and by a Lineweaver-Burk line (Table 1). The script and its output are in fit-simulation.py.
| Substrate range | Km estimate | Vmax estimate | kcat/Km estimate | Lineweaver-Burk fits unusable or off by more than 2× |
|---|---|---|---|---|
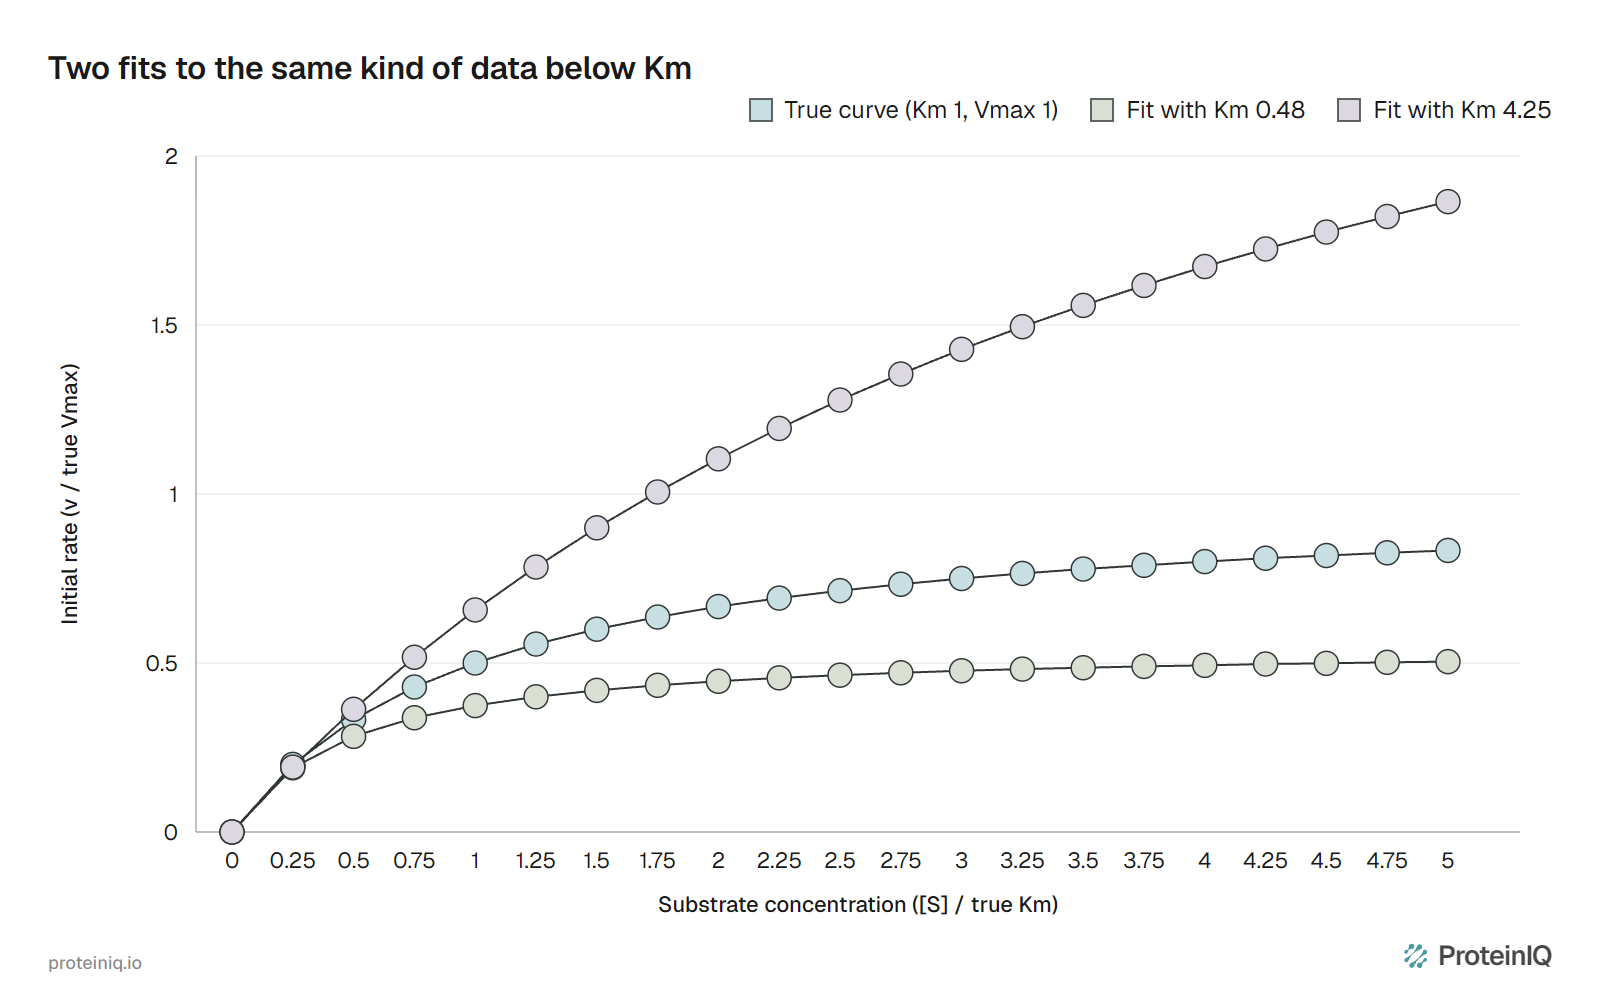
| 0.05 to 0.5 × Km | 0.48 to 4.25 | 0.59 to 3.44 | 0.80 to 1.27 | 75% |
| 0.2 to 5 × Km | 0.81 to 1.24 | 0.91 to 1.10 | 0.88 to 1.15 | 3% |
| 2 to 20 × Km | 0.68 to 1.39 | 0.94 to 1.07 | 0.76 to 1.40 | 0.5% |
When every point sits below Km, the fitted Km spans a ninefold range across replicates and 22% of fits are off by more than a factor of two, yet kcat/Km stays within about 25% of the truth. Figure 1 shows two of those fits. Both pass through data of the same kind, and they disagree by a factor of 6 about Vmax.
The Lineweaver-Burk plot of 1/v against 1/[S] makes this worse. Taking reciprocals inflates the error of the slowest rates, which sit furthest out on the plot, and in the below-Km design 35% of the lines crossed the axis with a negative intercept, a negative Vmax.
The STRENDA guidelines call the double-reciprocal plot the least accurate way to estimate the parameters and ask authors to report the substrate range they used.[16] The plot is still fine for showing an inhibition pattern; fit the hyperbola itself for the numbers.
When substrate solubility or cost keeps every point below Km, report kcat/Km from the initial slope and say that Km and kcat could not be resolved. A Km quoted without its substrate range cannot be judged.
Measured and predicted kcat and Km for five enzymes
Machine-learning models now predict kcat and Km from an enzyme sequence and a substrate structure. We ran two of them on five textbook enzymes whose kinetics have been measured many times: one DLKcat job and two CatPred jobs, one for kcat and one for Km. Each used the full UniProt sequence and the substrate as SMILES; CatPred's kcat run also listed NADPH for the reductase and ribulose 1,5-bisphosphate for Rubisco, as its documentation asks. All three jobs are public.
Table 2 sets the predictions against measured values. We chose enzymes that are so well studied that their kinetics are almost certainly in both models' training data, which makes this an easy test.
| Enzyme and substrate | Measured kcat (s⁻¹) | DLKcat kcat | CatPred kcat | Measured Km | CatPred Km |
|---|---|---|---|---|---|
| Carbonic anhydrase II, CO2 | 1,400,000 | 1,218 (1/1,150) | 6,450,000 (4.6×) | 9.3 mM | 10.5 mM (1.1×) |
| TEM-1 β-lactamase, benzylpenicillin | 1,160 | 387 (0.33×) | 467 (0.40×) | 28 µM | 14 µM (0.51×) |
| Triosephosphate isomerase, glyceraldehyde 3-phosphate | 4,270 | 1,110 (0.26×) | 46,900 (11×) | 0.47 mM | 0.41 mM (0.86×) |
| Dihydrofolate reductase, dihydrofolate | 10.7 | 3.8 (0.36×) | 16.3 (1.5×) | 0.53 µM | 2.9 µM (5.5×) |
| Rubisco, CO2 | 3.2 | 8.4 (2.6×) | 3.5 (1.1×) | 12.1 µM | 21 µM (1.7×) |
Eight of the ten kcat predictions land within a factor of 5, which is roughly what the models promise. The two misses are the interesting part.
DLKcat puts carbonic anhydrase three orders of magnitude too low, a value typical of an ordinary metabolic enzyme rather than one near the diffusion limit. CatPred is 11 times too high for triosephosphate isomerase, but it reports a standard deviation of 0.60 log units for that row, a fourfold uncertainty that at least warns of the miss. Its 4.6-fold overshoot for carbonic anhydrase carries a standard deviation of 0.32, which implies only about twofold, so the uncertainty columns help but do not catch every miss.
The Km predictions are closer, four of five within a factor of 2, and they fail where the mechanism is unusual: dihydrofolate reductase, whose Km sits below its Kd, is predicted 5.5 times too high. Combining CatPred's two predictions into kcat/Km gives 6.1 × 10⁸ M−1 s−1 for carbonic anhydrase against a measured 1.5 × 10⁸, and 1.2 × 10⁸ for triosephosphate isomerase against 9.1 × 10⁶. Errors in two predicted numbers multiply when you divide them.
How far to trust predicted kcat and Km
The published benchmarks agree with what the five enzymes show, once you read which test set produced them. DLKcat was trained on 16,838 kcat entries from BRENDA and SABIO-RK and reached a Pearson correlation of 0.71 on a random 10% test split, with a root mean square error of 1.06 log10 units, a typical error of about 11-fold.[13] Kroll and colleagues pointed out that 91% of that test set shares 99 to 100% sequence identity with a training enzyme, so the split mostly measures recall of close relatives.[14]
Performance falls with distance from the training data. For their own model, TurNuP, Kroll and colleagues report an R² of 0.67 for test enzymes 99 to 100% identical to training sequences and 0.33 below 40% identity.[14] Boorla and Maranas built CatPred on 23,197 kcat and 41,174 Km entries and tested it on enzymes held out by sequence. R² fell from 0.60 to 0.40 for kcat and from 0.64 to 0.53 for Km; the share of kcat predictions within tenfold fell from 76% to 61%.[15]
Measurements set the floor. Kroll and colleagues found that two published kcat values for the same enzyme and reaction differ on average by 5.7-fold, and that a single measurement differs from the mean of the others by 3.3-fold, against 4.8-fold for TurNuP's predictions.[14] Training labels carry differences in pH, temperature, construct and assay, so a model cannot be more accurate than the scatter it learned from, and a single literature value is not a gold standard either.
That puts predicted values in their place. They are useful where an order of magnitude is enough: filling gaps in enzyme-constrained metabolic models, flagging a pathway step that is likely to be slow, or ranking a large panel before choosing what to assay. They do not resolve a twofold improvement in an engineered variant, and the carbonic anhydrase row shows that a model can be a thousandfold off for an enzyme it has almost certainly seen.
Which number answers your question
Table 3 matches common questions to the number that answers them and the check that keeps it honest.
| Question | Number to use | Sign of trouble | Cheap check |
|---|---|---|---|
| Which of two substrates does the enzyme prefer? | kcat/Km for each | Comparing Km alone | Run both under the same conditions, or in a competition assay |
| How fast can the enzyme go at saturation? | kcat | Highest [S] below about 3 × Km | Titrate active sites, not total protein |
| Is the enzyme saturated in the cell? | Km against cellular [S] | Km taken from a different construct or pH | Measure at physiological pH and temperature |
| How tightly does the substrate bind? | Kd, not Km | Km quoted as affinity | Binding assay without catalysis, or a pre-steady-state measurement |
| Did a mutation improve the enzyme? | kcat/Km, then kcat and Km | Change smaller than twofold | Replicate wild type and variant on the same day |
| What is a plausible kcat for a parameter I cannot measure? | Predicted kcat | Low sequence identity to known enzymes, large epistemic SD | Compare against a measured homologue and treat the value as order-of-magnitude |
Two habits cover most of the table. Report kcat/Km whenever you report the other two, because it survives a narrow substrate range that the others do not. And quote every value with its substrate range, pH, temperature and enzyme construct, since without them a Km from another lab tells you less than it seems to.
Enzyme kinetics tools on ProteinIQ
Start with predicted kcat and Km to set expectations and design the substrate range, then use the design tools to make variants worth assaying. The enzyme design and enzyme engineering pages show how these steps connect.
| Task | Tool |
|---|---|
| Predict kcat for enzyme and substrate pairs | DLKcat |
| Predict kcat, Km or Ki with uncertainty estimates | CatPred |
| Convert an inhibitor IC50 to Ki using the assay Km | IC50 to Ki calculator |
| Score how point mutations change stability | ThermoMPNN |
| Scaffold a catalytic site into a new protein | RFdiffusion2 |
| Redesign a pocket around a substrate or cofactor | LigandMPNN |
Frequently asked questions
What is the Michaelis-Menten equation?
It is v = Vmax[S]/(Km + [S]), the initial rate of an enzyme reaction as a function of substrate concentration. Michaelis and Menten published it in 1913 assuming rapid binding equilibrium, and Briggs and Haldane rederived it in 1925 under the steady-state assumption used today.[1][2]
What is the difference between kcat and Vmax?
Vmax is the maximum rate of a whole enzyme sample, in concentration per time, so it scales with the amount of enzyme. kcat is Vmax divided by the concentration of active sites, the number of substrate molecules each site converts per second. A typical kcat is about 10 s−1.[3]
Does a low Km mean high affinity?
Not reliably. Km equals the dissociation constant only when the chemical step is much slower than substrate release. E. coli dihydrofolate reductase has a Km of 0.53 µM for dihydrofolate but a binary-complex Kd of 1.3 µM, so its Km makes it look tighter-binding than it is.[9]
What does kcat/Km tell you?
It is the second-order rate constant for enzyme and substrate at low substrate concentration, and the ratio of two substrates' values gives the enzyme's preference between them. Typical enzymes reach about 105 M−1 s−1, and the fastest approach the diffusion limit near 108 to 109.[3]
Why should I not use a Lineweaver-Burk plot to get Km?
Taking reciprocals magnifies the error of the slowest rates and gives them the most weight in the line. The STRENDA guidelines call it the least accurate method.[16] In our simulation with data below Km, 35% of Lineweaver-Burk fits gave a negative Vmax; fit the hyperbola directly by nonlinear regression.
How accurate are predicted kcat values?
Typical errors are 3 to 10-fold. DLKcat reports a root mean square error of 1.06 log10 units on a random test split, and CatPred keeps 61% of kcat predictions within tenfold for enzymes held out by sequence.[13][15] Two lab measurements of the same enzyme differ by 5.7-fold on average, so no model can be much better than that.[14]