Epitope prediction: B-cell vs T-cell
Two problems that share a name and almost nothing else

Matic Broz, PhD13 min
What is epitope prediction?
Epitope prediction means finding the parts of an antigen that the immune system recognizes, and "the immune system" covers two very different recognizers. Antibodies and B-cell receptors bind the surface of the folded protein. T-cell receptors bind short peptides that an MHC molecule has cut out and displayed. The two tasks use different inputs, different models and different benchmarks, and they fail in different ways.
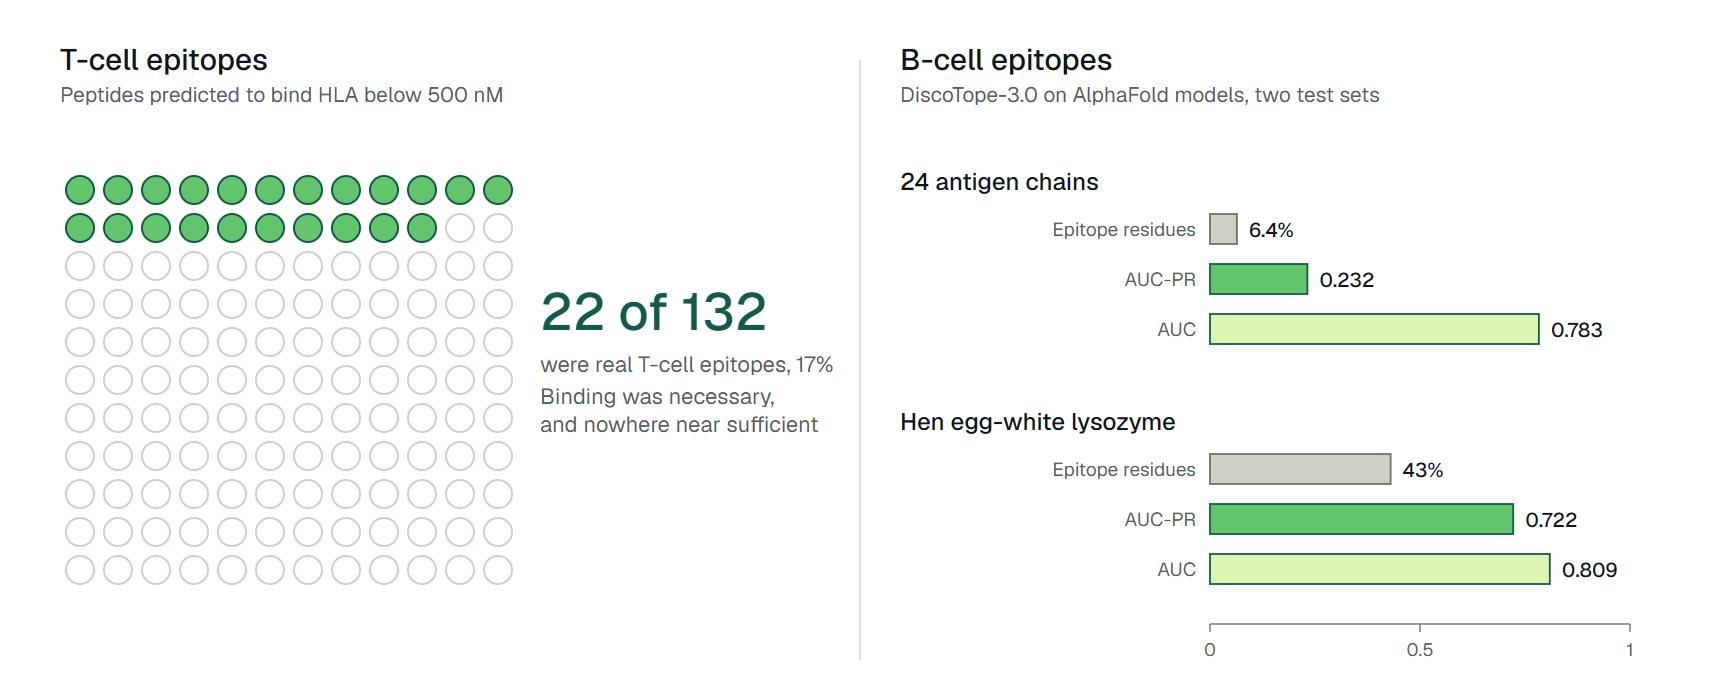
The failures are easy to see in published numbers. For T-cell epitopes, a Dengue virus study reanalyzed by Calis and colleagues listed 132 peptides that were all predicted to bind their HLA molecule with an affinity better than 500 nM. Only 22 of them (17%) were real T-cell epitopes.[1] Binding was necessary, and it was nowhere near sufficient.
For B-cell epitopes, the sequence-only tool BepiPred-2.0 scored an AUC of 0.523 on an external set of 3,560 antigen sequences from IEDB, where 0.5 is a coin flip.[2] Its successor, BepiPred-3.0, reached 0.663 on the same set. That is a real gain, and it is still far from the near-perfect ranking a colored epitope map on a web server implies.
The rest of this page follows those two gaps. It covers what a linear epitope is and why conformational epitopes are harder, how well sequence and structure methods do, where T-cell prediction stops being reliable, and what the ProteinIQ tools TLimmuno2 and ScanNet can and cannot tell you.

Linear and conformational epitopes
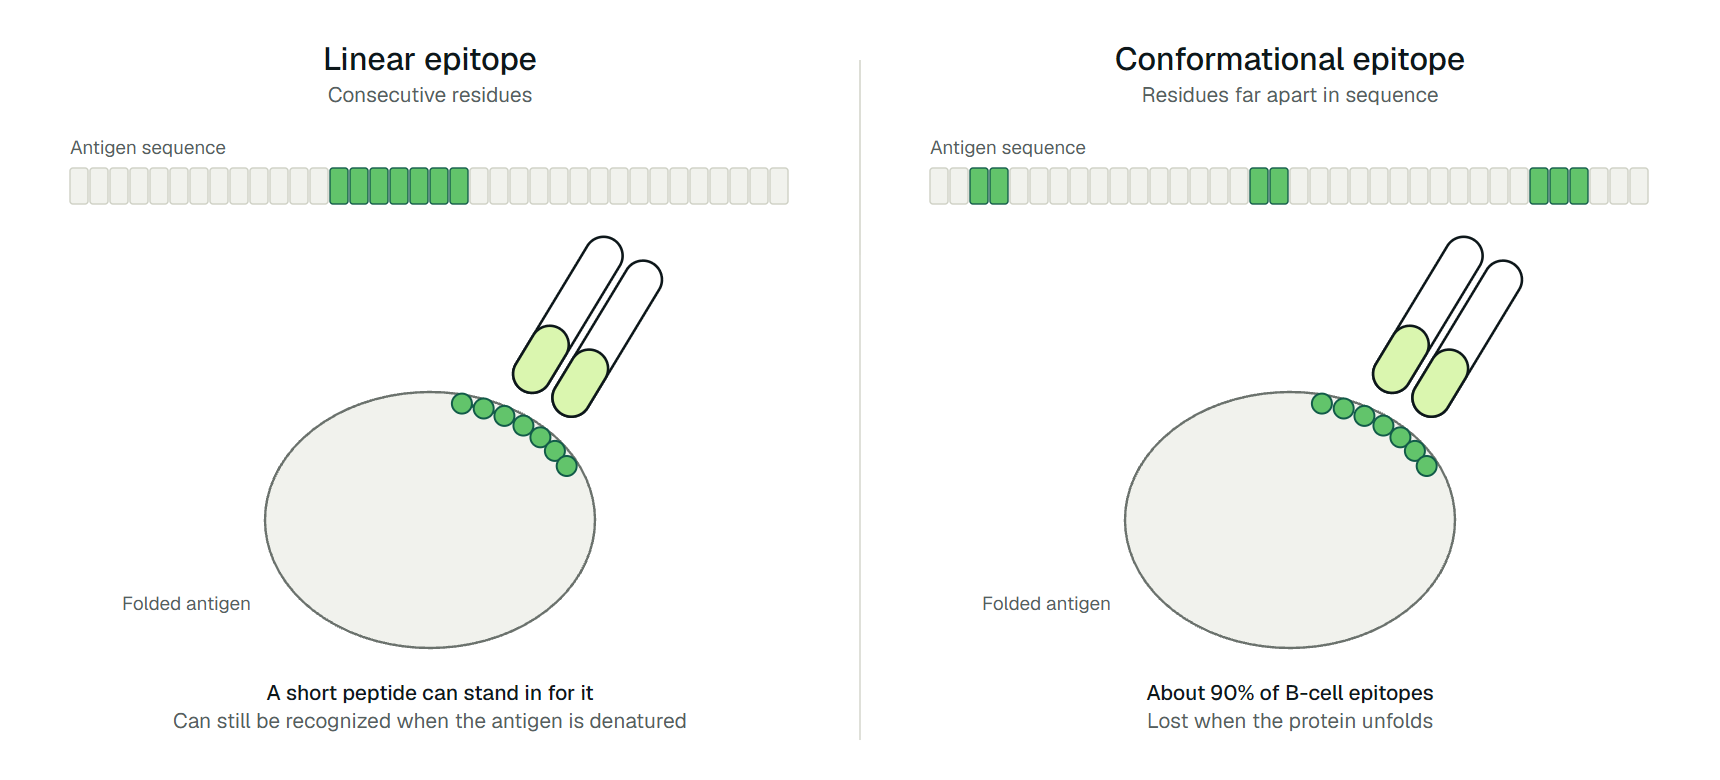
A linear epitope is a stretch of consecutive residues that an antibody binds, so a short synthetic peptide can stand in for it. A conformational (or discontinuous) epitope is a patch of solvent-exposed atoms from residues that may be far apart in sequence but sit next to each other on the folded surface. Antibodies against linear epitopes can recognize denatured antigen; antibodies against conformational epitopes lose recognition when the protein unfolds.[3]
The same review puts the share of conformational epitopes at about 90%, and notes that only a minority of native antigens contain linear B-cell epitopes at all.[3] That ratio explains why linear epitope prediction, which only needs a sequence, is popular for peptide vaccines and antibody production, and why it is the weaker of the two B-cell approaches.
T-cell epitopes are linear by construction, because the T-cell receptor sees a peptide lying in an MHC groove. The word "linear" therefore only distinguishes between B-cell epitopes. Table 1 sets the two families side by side.
| B-cell epitope | T-cell epitope | |
|---|---|---|
| Recognized by | Antibodies and B-cell receptors | T-cell receptors, through peptide-MHC complexes |
| Form | Linear peptide or conformational surface patch | Linear peptide in an MHC groove |
| Needs the folded protein | Usually (about 90% conformational) | No, the protein is processed into peptides first |
| Class division | None | MHC class I (intracellular peptides, CD8) and class II (extracellular peptides, CD4) |
| Typical prediction input | Antigen sequence or 3D structure | Peptide sequence plus an HLA allele |
| Weakest step in this guide's numbers | Sequence-only linear epitope prediction | Predicting which presented peptides provoke a response |
Accuracy of B-cell epitope prediction
Older linear epitope predictors relied on amino acid propensity scales such as hydrophilicity or flexibility. Blythe and Flower tested 484 scales and their plotting parameters, more than a million combinations in all, against epitopes mapped on 50 proteins with polyclonal antibodies. Even the best combination was only marginally better than random, and they concluded that single-scale propensity profiles cannot locate epitopes reliably.[4]
Modern sequence methods are machine-learning models trained on antibody-antigen crystal structures. BepiPred-2.0 used a random forest on epitope residues taken from solved complexes.[5] BepiPred-3.0 swapped the hand-built features for embeddings from the ESM-2 protein language model and improved on its predecessor on every external set that Clifford and colleagues tested (Table 2).[2]
Structure-based methods work on the surface instead of the sequence. ElliPro, from 2008, scores protruding regions of a given structure and reached an AUC of 0.732 on a benchmark of discontinuous epitopes, counting the best-scoring prediction for each protein.[6]
DiscoTope-2.0 added half-sphere exposure and a spatial neighborhood definition.[7] DiscoTope-3.0 replaced hand-built features with inverse folding representations, and it accepts AlphaFold models as well as experimental structures.[8]
| Method (year) | Input | Test set | Result |
|---|---|---|---|
| BepiPred-2.0 (2017) | Sequence | 3,560 IEDB antigens, 8,818 epitope residues | AUC 0.523 |
| BepiPred-3.0 (2022) | Sequence | Same IEDB set | AUC 0.663 |
| BepiPred-2.0 and 3.0 | Sequence | 15 structure-derived antigens | AUC 0.668 and 0.771 |
| ElliPro (2008) | Structure | Discontinuous epitope benchmark, best prediction per protein | AUC 0.732 |
| DiscoTope-3.0 (2024) | Solved structure | 24 antigen chains, at most 20% similar to training data | AUC 0.795, AUC-PR 0.223 |
| DiscoTope-3.0 (2024) | AlphaFold model | Same 24 chains | AUC 0.783, AUC-PR 0.232 |
Read the DiscoTope-3.0 row against its base rate. The test set holds 436 epitope residues among 6,788 residues, a prevalence of 6.4% (we calculated this). An AUC-PR of 0.232 is therefore about 3.6 times what random ranking would give, which is good progress and still means most top-ranked residues are not epitopes.[8] The same paper reports that DiscoTope-3.0 beat BepiPred-3.0 (0.177 on predicted structures), SEMA (0.185 on solved structures) and ScanNet on this set.[8]
Scores also depend on how the benchmark is written. Kringelum and colleagues pointed out that few antigens have every epitope mapped, so unmapped true epitopes get counted as false positives. For 13 proteins where the biology allowed a proper redefinition, average AUC rose from 0.791 to 0.824; on an independent set it rose from 0.712 to 0.727.[7] Benchmarks can understate a method, and they can also flatter one that was tuned on a familiar protein, as the worked example below shows.
How T-cell epitope prediction works
T-cell epitope prediction is two problems stacked. The first is presentation: will this peptide be processed, loaded onto a given HLA molecule and carried to the cell surface? The second is immunogenicity: given that it is presented, will a T cell respond? Presentation prediction is the mature part.
NetMHCpan-4.1 and NetMHCIIpan-4.0 predict peptide binding to class I and class II molecules, and they train on both measured binding affinities and mass spectrometry data of ligands eluted from cells.[9] Which peptides each side presents is the subject of the guide on MHC class I vs class II: class I mostly intracellular peptides, class II mostly extracellular ones.[9]
The class II groove is open at both ends, so bound peptides range from 9 to 22 residues even though only a nine-residue core sits inside.[3] MHCflurry 2.0 adds an antigen processing model to its class I binding model, and it outperformed both components alone as well as NetMHCpan 4.0 and MixMHCpred 2.0.2 on held-out mass spectrometry experiments.[10]
Immunogenicity is where accuracy drops. Calis and colleagues built a simple model of which residues make a presented class I peptide immunogenic: positions 4 to 6 matter most, and large aromatic residues are enriched. It reached an AUC of 0.65 in cross-validation, and 0.61 when immunogenic and non-immunogenic peptides were matched for binding affinity.[1] Those are modest numbers, from a deliberately simple enrichment model.
Class II immunogenicity has less data still. TLimmuno2 addresses that with transfer learning: a recurrent network pretrained on binding affinities is fine-tuned on immunogenicity labels, and its authors report better performance than existing models on independent validation sets.[11] The IEDB collects the experimental epitope records behind this field, covering antibody, T cell and MHC binding contexts, and it supplied the linear epitope test set that BepiPred-2.0 was benchmarked on.[12]
A worked example where the numbers disagree
Table 2 hides a large spread within a single paper. DiscoTope-3.0 was also tested on hen egg-white lysozyme, an antigen with 12 antibody epitope sets mapped. On that one AlphaFold model it reached an AUC-PR of 0.722 and an AUC of 0.809, against 0.232 and 0.783 on the 24-antigen set. The reason is mostly prevalence: after collapsing the 12 antibodies' epitopes, 55 of lysozyme's 129 residues (43%, our calculation) are labeled epitope, compared with 6.4% on the larger set.[8]
The ranking itself did not collapse; AUC barely moved. The precision metric swung because on a heavily mapped antigen so much of the surface is labeled epitope. A tool that looks excellent on lysozyme can therefore be ordinary on a typical antigen, and the reader's own protein is rarely lysozyme.
The T-cell version of the same lesson is the Dengue set above. A binding filter of 500 nM left 132 candidates, and an immunogenicity model scored the true epitopes higher than the non-epitopes with an AUC of 0.69. Calis and colleagues calculated that skipping the 38% of peptides with a negative score would still have kept 86% of the epitopes.[1] That is an enrichment tool, not a verdict, and the authors framed it that way.
Both examples point at the same rule. A prediction narrows a search; it does not confirm an epitope. Experimental mapping, or at least a binding or response assay, decides.
| Question | Start with | Add | Check |
|---|---|---|---|
| Where might antibodies bind this folded protein? | A structure-based method on a solved or AlphaFold structure | A sequence-based score such as BepiPred-3.0 as a second opinion | Treat output as a ranking; compare against any known epitope mapping |
| Which peptides could replace the antigen as an immunogen or assay target? | A linear epitope predictor | Surface accessibility from a structure | Test whether antibodies raised against the peptide bind the native protein |
| Which peptides will an HLA allele present? | NetMHCpan-4.1, NetMHCIIpan-4.0 or MHCflurry 2.0 for the person's alleles | An antigen processing score for class I | Confirm the exact allele is covered |
| Which presented peptides will trigger T cells? | An immunogenicity model for the right MHC class | A presentation filter applied first | Expect modest accuracy; validate in an assay |
Use the table as a sequence, not a menu. For any T-cell question, filter by presentation before scoring immunogenicity, and for any B-cell question decide first whether you have a structure.
Epitope prediction tools on ProteinIQ
ProteinIQ covers two points in this workflow: a T-cell immunogenicity model and a structure-based binding site model. The structure comes first if you only have a sequence, and the T-cell tools take peptides, so you tile a protein yourself.
- AlphaFold 2: predict a structure for an antigen that has none.
- ScanNet in antibody epitope mode: mark residues likely to be bound by antibodies on a 3D structure.
- TLimmuno2: score peptides for a CD4 T-cell response through MHC class II.
- DeepImmuno: score peptides for a CD8 T-cell response through MHC class I.
ScanNet is a geometric deep learning model that predicts protein-protein, protein-antibody and disordered-protein binding sites from a 3D structure.[13] On ProteinIQ it accepts a PDB or mmCIF file, a PDB identifier or a UniProt accession (which retrieves the AlphaFold Database model) and returns a 0 to 1 binding probability for each residue. It runs in the no-MSA mode, defines no probability cutoffs, and analyzes a single static conformation.
It predicts antibody-binding propensity for the surface, not which antibody binds, and it was one of the tools DiscoTope-3.0 outperformed in that paper's benchmark.[8]
TLimmuno2 takes peptides of 13 to 21 residues (up to 10,000 per job) and an HLA class II allele, and returns a continuous immunogenicity score plus a Rank against about 90,000 random human peptides for the same allele. Lower Rank is stronger, and the score is not a calibrated probability. It does not scan a whole protein, does not predict class I, and does not model antigen processing. DeepImmuno covers class I for 20 HLA-A, B and C alleles.
Sequence-only linear epitope prediction (BepiPred) and binding predictors such as NetMHCpan and MHCflurry are not among the ProteinIQ tools; they are available from their authors and through the IEDB.[12]
Frequently asked questions
What is the difference between B-cell and T-cell epitope prediction?
B-cell epitope prediction locates the surface or sequence regions that antibodies bind, from an antigen sequence or structure. T-cell epitope prediction ranks short peptides by whether an MHC molecule presents them and, in the harder step, whether a T cell responds. Class I presents intracellular peptides to CD8 cells and class II presents extracellular peptides to CD4 cells.[3]
What is a linear epitope?
A linear epitope is a run of consecutive residues that an antibody recognizes, which a short peptide can mimic. About 90% of B-cell epitopes are conformational, so linear epitopes are the minority form, though they are the easier target for sequence-only tools.[3]
How accurate is linear B-cell epitope prediction?
On an external IEDB set of 3,560 antigens, BepiPred-2.0 reached an AUC of 0.523 and BepiPred-3.0 reached 0.663.[2] Earlier propensity-scale methods were only marginally better than random on 50 mapped proteins.[4]
Does a strong MHC binding prediction mean a peptide is immunogenic?
No. In a Dengue dataset, 22 of 132 peptides predicted to bind below 500 nM were real T-cell epitopes.[1] Binding predictors such as NetMHCpan model presentation, and immunogenicity models such as TLimmuno2 add a separate score for T-cell response.[9][11]
Can ProteinIQ predict B-cell epitopes?
ProteinIQ runs ScanNet, which predicts antibody-binding residues on a structure you supply, in its antibody epitope mode. It does not run a sequence-only linear epitope predictor, and its probabilities have no published cutoffs, so use them to rank surface patches for experimental testing.[13]