How to colour a protein surface by electrostatic potential
From a quick Coulomb estimate to a Poisson-Boltzmann calculation

Matic Broz, PhD12 min
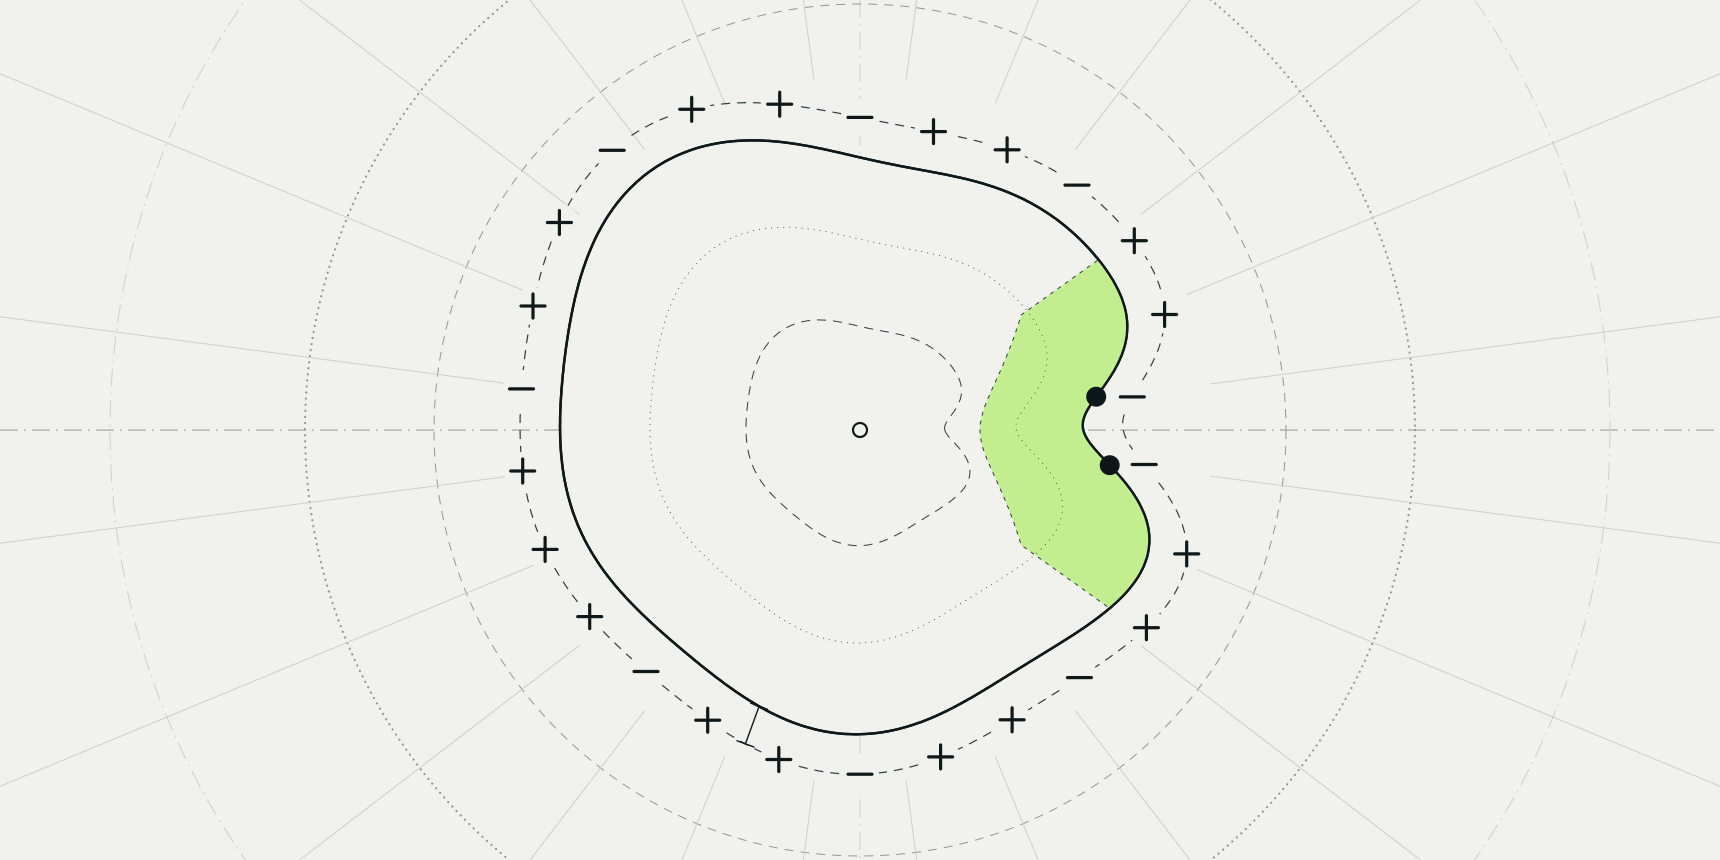
Hen egg-white lysozyme is a good test for any electrostatic surface. At pH 7 it carries a net charge of about +8 e, and on a coloured surface roughly 85% of the surface points are positive. The exception is a red notch in the substrate cleft, right where the two catalytic residues, Glu35 and Asp52, sit. A map that shows both facts at once, a basic protein and one acidic active site, is doing its job.
To colour a protein surface by electrostatic potential, assign a charge to each atom, compute the potential those charges create, and paint it onto the molecular surface from red (negative) through white to blue (positive). The PDB viewer does this in the browser with a quick Coulomb estimate. For a Poisson-Boltzmann result, PDB2PQR runs APBS, and PyMOL can display its output.

What an electrostatic surface shows
The colour at each surface point is the electrostatic potential: the energy a unit positive charge would have at that spot, divided by the charge. Blue means a positive probe would be repelled and a negative one attracted; red is the reverse. Red and blue are a convention, not physics, but it is the convention the APBS PyMOL page names, and the viewer and ChimeraX colour this way by default.[2][5]
APBS reports potential in units of , thermal energy per elementary charge, which is about 25.7 mV at 298 K (the APBS manual rounds it to 25.6 mV).[1] Colours saturate at a chosen limit. The APBS PyMOL page calls ±1, ±5 or ±10 kT/e usual choices, so ±5 is a habit, not a standard, and a figure only means something if its legend gives the range.[2]
Units differ between programs, which matters when you copy a range. ChimeraX's coulombic reports kcal/(mol·e) at 298 K and colours from -10 to +10 by default.[5] Since one is about 0.592 kcal/mol, that range is roughly ±17 kT/e, more than three times the ±5 kT/e of a typical APBS figure.
The surface does not show how strongly a ligand binds, which residue is protonated, or where a charged ligand will go. It is a snapshot of one conformation with fixed charges. APBS's own documentation warns that results are very sensitive to where the dielectric boundary is placed and to the grid used.[3] Treat a map as a hypothesis about where charge is, then test it against interactions you can count, as in protein-ligand interactions.
Coulomb estimate or Poisson-Boltzmann
Every route below does one of two calculations. A Coulomb estimate sums the pairwise effect of every charged atom in a simplified dielectric. It is fast, needs no solver and shows where the charge is. It does not model water or salt as a continuum, so potentials are larger than a real map.
Poisson-Boltzmann (PB) solves the potential on a 3D grid with a low-dielectric protein, a high-dielectric solvent and mobile ions. That is what APBS does, and it is what a published figure should show.[4] It also needs more preparation: atomic radii, charges and protonation states, which is the job of PDB2PQR.
The formula above is the Coulomb estimate used by ChimeraX, where is the distance from atom to the surface point and the distance-dependent dielectric stands in for screening by water.[5] It contains no ions and no solvent boundary, which is why the estimate and a PB map can disagree.
How to colour a surface in the PDB viewer
The viewer's Electrostatics menu gives a Coulomb estimate in your browser, with nothing to install and no credits.
- Open the PDB viewer, type
1LYZin the search box and press Enter. - Point at Electrostatics, the lightning button in the left toolbar.
- Under Estimate, click Colour surface.
- Read the legend under Colour range. The estimate starts at ±10 kT/e.
- To undo it, click Remove from 3D.
The estimate places formal charges on the ionizable groups at pH 7 and reads the potential 1.4 Å out from the surface, the same offset ChimeraX uses.[5] Because it uses formal charges, it needs no hydrogens, and a PDB file straight from the archive works. It has no solvent or salt screening, so it is an estimate and not a Poisson-Boltzmann solution; use it to see where the charged patches are, not for a publication figure.
The same thing runs from the command line as electrostatics coulombic, and electrostatics off removes it. Download .dx in the side panel saves the estimate's grid as an OpenDX file.
What lysozyme looks like
We ran the viewer's own charge assignment and potential routine on the 1LYZ file from the RCSB PDB, a 2.0 Å X-ray structure.[10] The structure has 11 Arg, 6 Lys, 7 Asp and 2 Glu; the single His is neutral at pH 7 in this scheme. That gives a net charge of +8.00 e spread over 60 charged atoms.
Then we built a solvent-accessible surface from van der Waals radii plus a 1.4 Å probe, the distance at which the estimate reads the potential, sampled 17,470 points on it and read the potential at each.
This is our own sampling of the viewer's calculation, not the mesh the viewer draws. The median is +4.1 kT/e. Of the points, 85.5% are positive, 22.1% are above +10 kT/e and only 1.2% are below -10 kT/e. The most positive residues are Lys33 (mean +19.0 kT/e) and Lys96 (+16.4).
The negative patch is in the cleft. UniProt lists the two active-site residues of hen lysozyme at positions 53 and 70 of the precursor, which are Glu35 and Asp52 once the 18-residue signal peptide is removed.[9] Asp52 has a mean surface potential of -13.8 kT/e and Glu35 -6.7. Neighbours Ser50 and Gln57 are also negative (-10.5 and -9.5), and the cleft residues as a group average -0.3 kT/e against +4.9 for the whole protein.
This is what the surface should look like: a basic protein with a local acid pocket at the catalytic site.
It also shows the limits of the estimate. It treats every Asp and Glu as fully charged, but a buried acid in an active site can sit at a shifted pKa, which a fixed pH 7 assignment cannot represent. PROPKA predicts those shifts, and PDB2PQR can use them. We did not run APBS on 1LYZ, so we make no claim here about how a PB map would differ.
How to get a Poisson-Boltzmann map with PDB2PQR and APBS
PDB2PQR adds hydrogens, assigns protonation states and writes the charges and radii that APBS needs. On ProteinIQ the same job can run APBS and return the potential as an OpenDX (.dx) map.
 PDB2PQRPrepare biomolecular structures for electrostatics calculations with charge and radius assignment.Open tool
- Open PDB2PQR and upload your structure, or fetch it by PDB ID.
- Choose the PARSE force field, which the tool's documentation recommends for electrostatics work.
- Turn on Use PROPKA for protonation if you want pKa-based states, and set the pH.
- Turn on Run APBS electrostatics and submit the job.
- Download the
.dxmap, or open it in the result's electrostatics view, which draws red and blue isosurfaces at -1 and +1 kT/e.
Structures can have up to 30,000 atoms, and APBS runs are limited to three structure and pH combinations because each one builds a 3D grid. Large missing regions are not modelled, so repair a gappy structure with PDBFixer first. The viewer's APBS option has a button, Open in PDB2PQR, that shows its 10-credit price and opens the tool with the shown structure already loaded; nothing runs until you submit the job.
Once the job returns, choose Open .dx file (or Open .dx result after a hand-off) in the viewer's Electrostatics menu, then Colour surface. Maps start at ±5 kT/e, and Colour range sets any limit from ±0.5 to ±30. Maps open from this menu only, because dropping a .dx file onto the canvas is refused, and share links leave a .dx map out.
How to colour a surface in PyMOL
PyMOL has two PB routes, both of which need the apbs and pdb2pqr programs installed. The older APBS Tools 2.1 plugin runs the calculation and then colours the surface: click Run APBS, then under Molecular Surface click Show.[7] Incentive PyMOL 2.0 added the APBS Electrostatics Plugin, described as a one-click solution for ordinary protein and DNA.[6]
Under the hood the newer plugin builds a colour ramp from the map. The PyMOL wiki gives this example for ubiquitin (1UBQ), and notes the Python interface is not part of the official cmd API and may change:[6]
pdb2pqr_cli("prepared01", "1ubq", options=["--ff", "amber"])
map_new_apbs("apbs_map01", "prepared01")
cmd.ramp_new("apbs_ramp01", "apbs_map01", [-5, 0, 5])
cmd.set("surface_ramp_above_mode", 1, "prepared01")
cmd.set("surface_color", "apbs_ramp01", "prepared01")
cmd.show("surface", "prepared01")
The list [-5, 0, 5] is the colour range in kT/e, so changing the first and last numbers changes the saturation. The APBS PyMOL page shows the same kind of ramp and surface colouring for a .dx map loaded from APBS, so a map from PDB2PQR can be coloured the same way.[2]
There is also a charge-smoothed surface in PyMOL's object menu, reached by generate then vacuum electrostatics. Its wiki page describes it as an approximation that ignores solvent screening and recommends a real Poisson-Boltzmann solver such as APBS for anything that matters.[8] It is quick for a first look and, like the viewer's estimate, not for a figure.
How to colour a surface in ChimeraX
ChimeraX's route is coulombic, which calculates a Coulomb potential on the fly with no map file. With the structure open, type:
open 1lyz
coulombic protein key true
By default it adds hydrogens and charges, uses a distance-dependent dielectric of 4, reads the potential 1.4 Å out from the surface along each vertex normal, and colours red-white-blue from -10 to +10 kcal/(mol·e).[5] key true adds a colour key, and a range option, such as range -5,5, changes the limits.
Naming protein matters: the documentation warns that ligands and solvent can otherwise be counted among the charges. For standard residues there is no choice of force field.
The ChimeraX user guide describes coulombic as its electrostatics command and does not list an APBS command. For a Poisson-Boltzmann map, make it with PDB2PQR and APBS as above, then view it in PyMOL or the PDB viewer. The viewer's estimate follows the same recipe as coulombic but uses formal charges and reports in kT/e, so its default of ±10 is not the same colour scale as ChimeraX's ±10.
| Route | Calculation | Units and default range | Needs |
|---|---|---|---|
| PDB viewer, Estimate | Coulomb sum, formal charges at pH 7, dielectric 4r, no screening | kT/e, ±10 | A browser |
| PDB viewer or PyMOL with a PDB2PQR and APBS map | Poisson-Boltzmann | kT/e, ±5 in the viewer; you set it in PyMOL | PDB2PQR run with APBS |
ChimeraX coulombic | Coulomb sum, atom charges, dielectric 4r, no screening | kcal/(mol·e), ±10 | ChimeraX |
| PyMOL vacuum electrostatics | Charge-smoothed approximation | Not given | PyMOL |
Common mistakes
| Problem | Symptom | Fix |
|---|---|---|
| Copying a range between programs | One surface looks nearly white, another fully saturated | Check the units: one kcal/(mol·e) is about 1.7 kT/e |
| No legend on the figure | Readers cannot tell what the colours mean | Show the key and write the range in the caption |
| Ligand, ions or water counted in the charges | Colours that reflect a molecule you did not mean to include | Calculate for the protein only, as coulombic protein does |
| Treating a Coulomb estimate as Poisson-Boltzmann | Patches look more intense than published maps | Use PDB2PQR with APBS for anything you publish |
| Wrong pH or protonation | A buried Asp or His coloured as if charged | Run PROPKA at your pH in PDB2PQR |
After the task
A map shows where charge sits; the next question is what binds there. Protein-ligand interactions covers counting salt bridges and hydrogen bonds around a ligand, and the Kyte-Doolittle hydropathy plot is the matching view for hydrophobic patches.
For figures, how to make a publication-quality protein figure covers lighting, ray tracing and export, and how to open a PDB file covers getting the structure in. The PDB viewer keeps the colouring when you reload the page.
FAQ
What does red and blue mean on an electrostatic surface?
Red is negative potential and blue is positive, with white near zero. Blue regions attract negatively charged groups such as phosphates and carboxylates; red regions attract positively charged ones. These are the defaults in PyMOL's APBS pages and in ChimeraX.
What is kT/e?
It is the unit APBS writes: thermal energy divided by the elementary charge, about 25.7 mV at 298 K. A potential of 5 kT/e is a value of about 130 mV at that temperature.
Is ±5 kT/e a standard range?
No. APBS documents ±1, ±5 and ±10 kT/e as common choices. Use one range for every protein you compare, and state it.
Can I get an APBS surface without installing anything?
Yes. Run PDB2PQR with Run APBS electrostatics turned on, view the isosurfaces in the result, or open the .dx map in the PDB viewer. The viewer's own Estimate button needs no calculation service but is not APBS.
Why does my surface look different in PyMOL and ChimeraX?
They solve different problems. ChimeraX coulombic is a distance-dependent Coulomb sum in kcal/(mol·e); PyMOL's APBS route is Poisson-Boltzmann in kT/e, with a range you set yourself. Compare the units and the ranges before comparing the colours.