Phylogenetic tree: what it shows and how to read one
Read relatedness, branch lengths and support values correctly

Matic Broz, PhD18 min
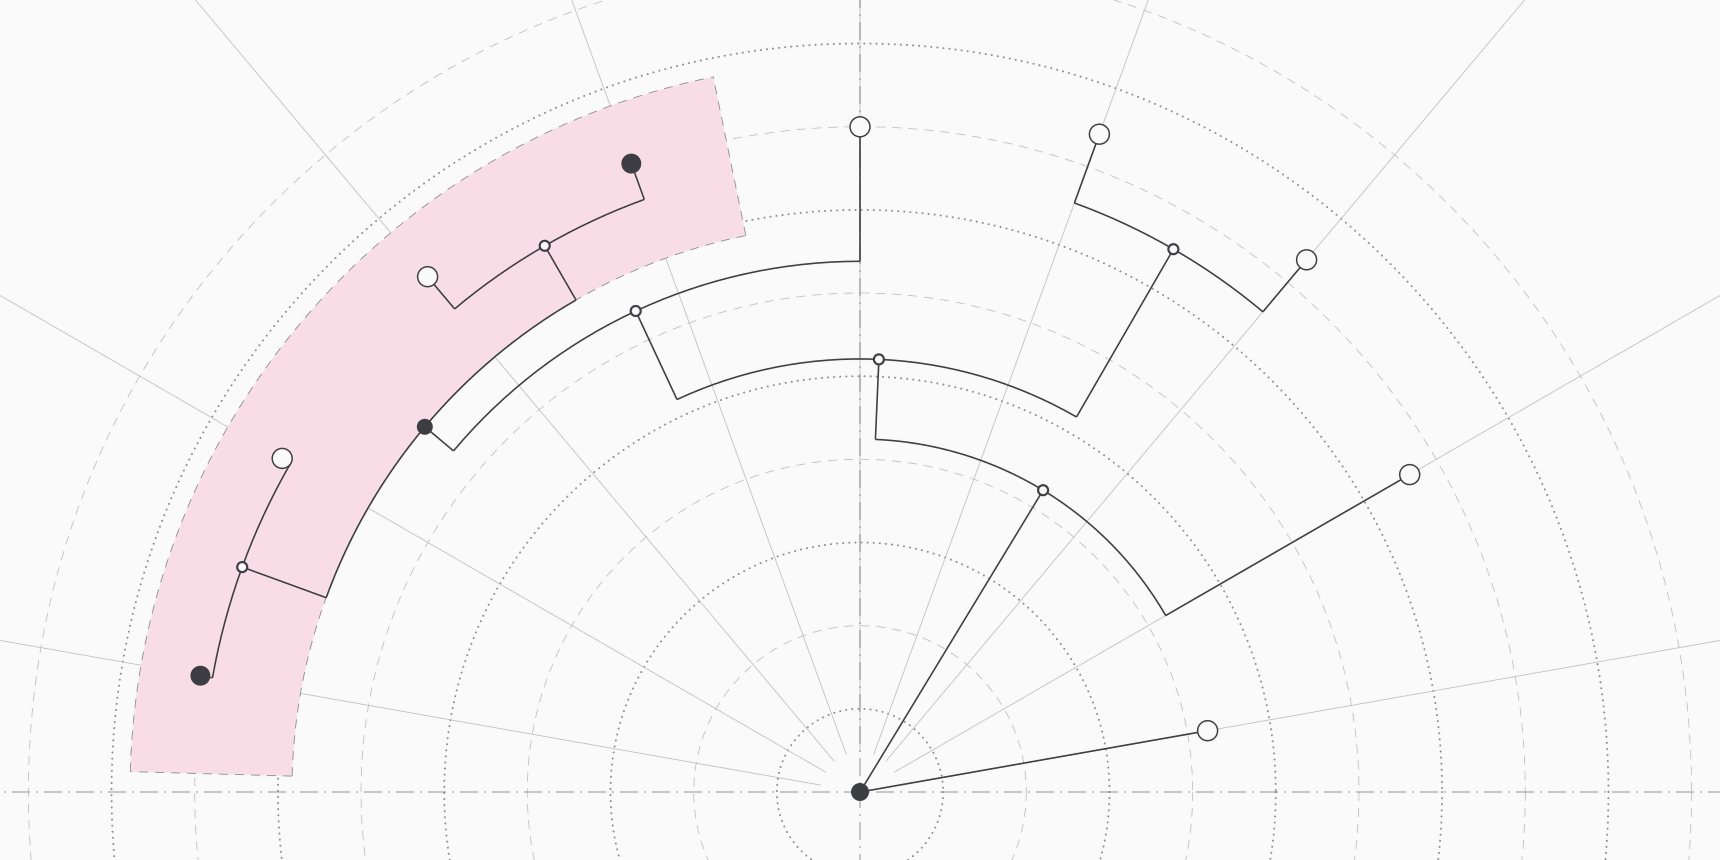
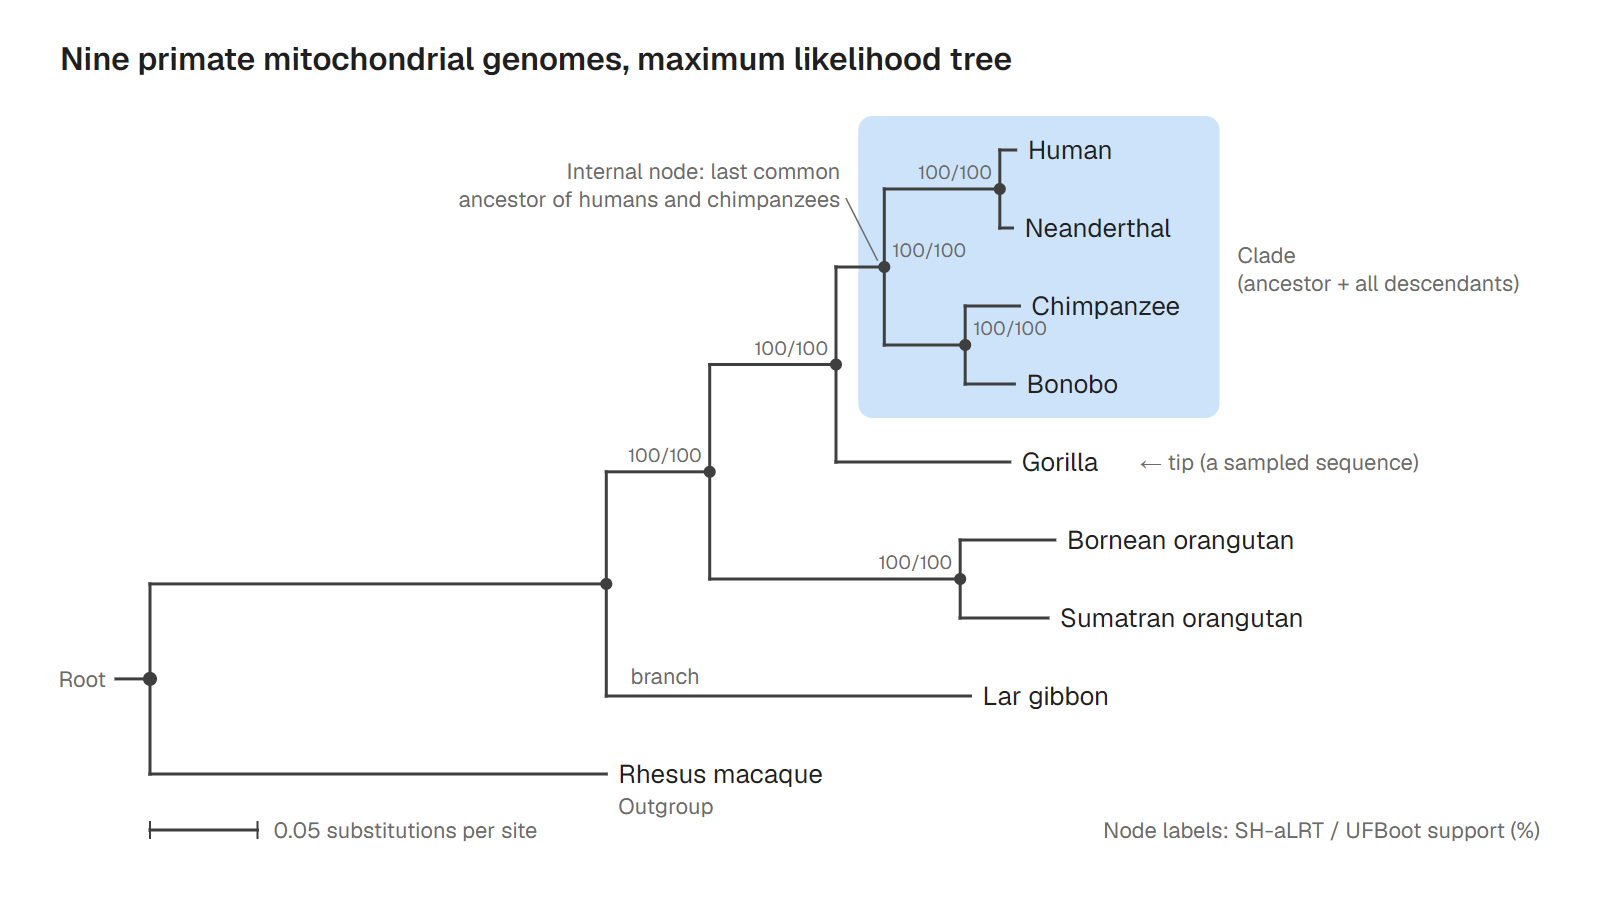
In Figure 1, the bonobo sits directly above the gorilla. Read the tips from top to bottom like a list and the two look like neighbors, perhaps close relatives. They are not. Follow the branches back from the bonobo and you reach the ancestor it shares with humans long before you reach the one it shares with gorillas. On a phylogenetic tree, closeness on the page means nothing; only the branching does.
The tree is real. We downloaded nine complete mitochondrial genomes from NCBI, from humans, a Neanderthal, chimpanzee, bonobo, gorilla, two orangutans, a gibbon and a rhesus macaque, aligned them with MAFFT and built a maximum likelihood tree with IQ-TREE, the same programs and versions that run on ProteinIQ.[1][3][4] Every number on this page about the example comes from that run, and the inputs and script are available to download.
The parts of a phylogenetic tree
A phylogenetic tree is a diagram of descent: a hypothesis about how a set of sequences, genes or species came from common ancestors. It is drawn from data, usually aligned DNA or protein sequences, and like any estimate it can be wrong in places. Five parts carry all its meaning.
| Part | What it represents | In Figure 1 |
|---|---|---|
| Tip (leaf, terminal node) | A sampled sequence, individual or species that exists in the data | Human, Gorilla, Lar gibbon |
| Internal node | An inferred common ancestor, where one lineage split into two | The dot joining the human-Neanderthal pair to the chimpanzee-bonobo pair |
| Branch (edge) | A lineage through time; in a phylogram its length is the estimated amount of change | The long branch leading to the gibbon |
| Root | The common ancestor of everything in the tree, which sets the direction of time | The left end, on the branch between macaque and the apes |
| Clade | An ancestor and all of its descendants | The shaded group of human, Neanderthal, chimpanzee and bonobo |
Nothing in the tree is an observation of an ancestor. The internal nodes are inferred from the tips: no ancestral genome was sequenced to draw the dot where humans and chimpanzees meet. The tips themselves are samples, so "Human" here means one sequence, the revised Cambridge Reference Sequence, not every human mitochondrial genome.
How to read relatedness from a tree
The rule is short. Two tips are more closely related to each other than to a third tip if they share a more recent common ancestor, meaning an internal node further from the root.
To compare the bonobo's relationship to humans and to gorillas, trace both pairs back until they meet. The bonobo and human lineages join at the shaded clade's ancestor. The bonobo and gorilla lineages join one node further left. Humans are therefore closer relatives of bonobos than gorillas are, even though the gorilla is printed next to the bonobo.
Tip order is arbitrary because every internal node can be rotated without changing the tree. Swap the two branches at the human-chimpanzee node and the chimpanzee and bonobo move to the top, with humans next to the gorilla. A rooted tree of nine tips has eight internal nodes, so the same tree can be drawn in tip orders, and all 256 say exactly the same thing. Reading a tree by its branching rather than its tip order is the skill Baum, Smith and Donovan called tree thinking.[5]
Counting nodes between two tips is just as unreliable. The path from human to gorilla in Figure 1 passes through three nodes; remove the Neanderthal and it passes through two, although nothing about humans and gorillas has changed. The count depends on which other tips happen to be sampled. Relatedness is a property of the branching order, and the amount of change is shown by branch lengths, not by how many nodes sit in between.
Tips are end points, not ancestors. A tree does not say that humans evolved from chimpanzees, or that the macaque is a primitive form that the apes passed through. Each living tip has been evolving for exactly as long as every other since their common ancestor; the macaque's lineage simply split off first. The Neanderthal sequence comes from a 38,000-year-old bone, so its lineage ends earlier, but it is still a sister lineage of modern humans, not their ancestor.[2]
Rooted and unrooted trees
Most tree-building methods cannot tell which way time runs. The time-reversible substitution models they use give the same likelihood wherever the root is placed, so the program estimates an unrooted tree: a network of relationships with no ancestor at the start. IQ-TREE says so in every report. Our run was given the macaque as an outgroup, and the report still notes that the tree is unrooted and the outgroup is only drawn at the root.[6]
An unrooted tree still contains real information. It says that humans and Neanderthals form a pair, that chimpanzees and bonobos form a pair, and that the two pairs together are separated from the gorilla by one branch. What it does not say is which node is oldest, so it cannot define clades or tell you which group branched off first.
Rooting adds that direction. The most common method is an outgroup: one or more sequences known from independent evidence to lie outside the group of interest. The root is placed on the branch that connects the outgroup to everything else. Here the macaque, an Old World monkey, is the outgroup for the apes. A good outgroup is close enough to align well but clearly outside the ingroup; a very distant one adds a long branch that can attract other long branches to the wrong place.
Midpoint rooting is the alternative when no outgroup is available. It puts the root halfway along the longest tip-to-tip path, which only makes sense if lineages have changed at roughly similar rates. In this tree the longest path runs from the Bornean orangutan to the macaque, 0.69 substitutions per site, and its midpoint falls on the same macaque branch, about a fifth of the way from the apes. Both methods agree here, but they do not have to.
Rooting is also why there are more rooted than unrooted trees for the same species. For tips the number of possible bifurcating trees is
For our nine genomes that is 135,135 unrooted and 2,027,025 rooted trees. For 20 tips it is about unrooted trees, which is why tree-building programs search heuristically rather than score every possibility.
Branch lengths: cladograms, phylograms and chronograms
Trees come in three common styles, and the difference is what the horizontal axis means.
| Type | Branch lengths mean | Typical use |
|---|---|---|
| Cladogram | Nothing; only the branching order is shown | Showing relationships or classification |
| Phylogram | Estimated amount of change, usually expected substitutions per site | The direct output of distance, likelihood and Bayesian methods |
| Chronogram | Time, so all living tips line up at the present | Divergence dates, rates of diversification |
Figure 1 is a phylogram. Its scale bar of 0.05 substitutions per site means that a branch of that length represents an estimated five substitutions for every 100 aligned positions.
The word "expected" matters. Where a site has changed twice, for example A to G and back, the sequences show no difference at all, so the model estimates how many changes were missed. Human and chimpanzee mitochondrial genomes differ at 8.6% of the positions that both have, but their model-corrected distance is 0.111 substitutions per site.
Branch lengths carry information a cladogram hides. The two orangutan species differ at 6.6% of positions, more than chimpanzees and bonobos (4.1%), so their branches in Figure 1 are longer. Human and Neanderthal mitochondrial genomes differ at 1.2%.
The human-chimpanzee figure of 8.6% is about seven times the 1.2% single-letter difference between human and chimpanzee nuclear DNA, in line with Brown, George and Wilson's estimate that primate mitochondrial DNA evolves about 10 times faster than single-copy nuclear DNA.[7] That speed is why mitochondrial genomes are a popular choice for trees of closely related species and a 37-gene genome is enough to resolve the apes.
Converting substitutions to years needs a molecular clock model and calibrations, usually fossils of known age. The result is a chronogram, in which branch lengths are in years and every living tip ends at the present. Green and colleagues dated the split between Neanderthal and modern human mitochondrial lineages this way to 660,000 ± 140,000 years ago.[2] A phylogram cannot be read as a chronogram: a long branch means a lot of change, which can come from a long time, a fast rate or both.
Monophyletic, paraphyletic and polyphyletic groups
A clade is the same thing as a monophyletic group: an ancestor and all of its descendants. You can test any proposed group on a rooted tree by finding the most recent common ancestor of its members and asking whether every tip below that node is included.
Great apes in the modern sense, humans, chimpanzees, bonobos, gorillas and orangutans, form a monophyletic group in Figure 1. The older classification that put chimpanzees, gorillas and orangutans in one family and humans in another made that ape family paraphyletic: it contains the common ancestor but leaves out one of its descendants, humans. Reptiles without birds are the textbook paraphyletic group.
A polyphyletic group is one whose members are brought together by a shared feature that evolved independently, without their common ancestor. Grouping birds and mammals as warm-blooded animals is the classic example: endothermy arose separately in the two lineages, so the group rests on a convergent trait and leaves out their last common ancestor. Modern classification aims to name only monophyletic groups, which is why paraphyletic and polyphyletic names tend to be retired as trees improve.
Support values: how much to trust each branch
Every internal branch in Figure 1 carries a label of 100/100. These are support values, and they answer a narrow question: if the data were slightly different, would the same branch appear? They do not say whether the tree is the true history of these species.
The classic measure is Felsenstein's bootstrap. The program builds a new alignment of the same length by sampling columns from the original with replacement, infers a tree from it, and repeats the process 100 to 1,000 times.
A branch's bootstrap value is the percentage of those trees that contain it.[8] Hillis and Bull found that under favorable conditions, with equal rates and modest change between nodes, a bootstrap value of 70% or more usually corresponded to at least a 95% probability that the group was real. They also showed that bootstrap values overstate accuracy when rates are very high or very unequal among taxa.[9]
IQ-TREE's ultrafast bootstrap (UFBoot) estimates the same quantity far faster. In simulations its values were close to unbiased, whereas the standard bootstrap is conservative.[10][11] The scales are therefore not interchangeable. The IQ-TREE developers advise relying on a branch only when its UFBoot support is at least 95%, and being more confident when SH-aLRT, a fast likelihood-based test, is also at least 80%.[12][13] When both are computed, as in Figure 1, the label reads SH-aLRT first and UFBoot second.
| Support value | Produced by | Scale | Usually treated as strong |
|---|---|---|---|
| Standard bootstrap | RAxML-NG, IQ-TREE, PhyML and most ML programs | 0 to 100% | 70% or more |
| Ultrafast bootstrap (UFBoot) | IQ-TREE | 0 to 100% | 95% or more |
| SH-aLRT | IQ-TREE, PhyML | 0 to 100% | 80% or more, read together with UFBoot |
| SH-like local support | FastTree | 0 to 1 | Close to 1; values such as 0.95 are fractions, not 95 bootstrap trees |
| Posterior probability | MrBayes, BEAST, RevBayes | 0 to 1 | 0.95 or more, but often higher than bootstrap for the same branch |
FastTree reports local support values from 1,000 resamples of site likelihoods without rebuilding the tree, and writes them as fractions.[14] Bayesian programs report posterior probabilities. In simulations by Alfaro and colleagues, posterior probabilities and likelihood bootstrap values were often strongly correlated but could differ substantially on short branches, and posterior probabilities reached high support with fewer characters.[15] A 0.98 posterior and a 98% bootstrap are not the same statement.
Our tree's support is perfect because 17,309 aligned positions, 3,437 of them informative, leave no room for doubt about these splits. That still describes only one locus. Mitochondrial DNA is inherited as a single unit from the mother, so this is a gene tree. Scally and colleagues found that in 30% of the genome, the gorilla is closer to humans or to chimpanzees than those two are to each other.[16]
A tree built from one of those regions could be well supported and still group humans differently. Support measures sampling error within the data you chose, not whether that locus tells the species' history.
How a phylogenetic tree is built
Every tree starts from homologous sequences, ones descended from a common ancestral sequence, collected in a FASTA file. The sequences are then aligned so that each column holds positions that share ancestry. MAFFT, Clustal Omega and MUSCLE5 are common choices, and the multiple sequence alignment page compares them. Errors at this step pass straight into the tree, so gap-rich or doubtful regions are worth inspecting before inference.
Next comes a substitution model, which describes how likely each kind of change is. IQ-TREE's ModelFinder compared several hundred candidate models on our alignment and chose TVM+F+I+G4 by the Bayesian information criterion.[17]
Read left to right, that is a rate matrix in which the two transitions share one rate while each transversion has its own, base frequencies taken from the data, a class of invariable sites (42% of positions here) and four gamma rate categories for the rest. In our alignment the shared transition rate came out about nine times the fastest transversion rate.
The tree itself can be found in four broad ways, compared in Table 4. The phylogenetic analysis workflow covers how to run them in practice, including when to choose maximum likelihood or Bayesian phylogenetics.
| Approach | What it does | Support values | Example programs |
|---|---|---|---|
| Distance | Converts the alignment to pairwise distances, then joins the closest groups step by step (neighbor joining) | Bootstrap | BIONJ, neighbor joining in most packages |
| Maximum parsimony | Finds the tree that needs the fewest changes | Bootstrap | PAUP*, TNT |
| Maximum likelihood | Finds the tree and branch lengths under which the alignment is most probable, given a model | Bootstrap, UFBoot, SH-aLRT, SH-like | IQ-TREE, RAxML-NG, FastTree, PhyML |
| Bayesian inference | Samples trees in proportion to their posterior probability under a model and priors | Posterior probability | MrBayes, BEAST, RevBayes |
Distance methods are fast and often supply the starting tree for slower searches. Maximum likelihood is the usual choice for a single best tree with support values, and FastTree trades some accuracy for speed on alignments of thousands of sequences. Bayesian methods are the natural choice when you need posterior distributions of trees, divergence times or rates.
The Newick format
Trees are saved as text in the Newick format, adopted in 1986 by an informal committee of phylogenetic software authors whose final meeting was at Newick's restaurant in Dover, New Hampshire.[20] Parentheses enclose groups, commas separate members, and a semicolon ends the tree. Our primate tree, without branch lengths, is
(((((Human,Neanderthal),(Chimpanzee,Bonobo)),Gorilla),(Bornean_orangutan,Sumatran_orangutan)),Lar_gibbon,Rhesus_macaque);Read from the inside out: humans and Neanderthals form a pair, chimpanzees and bonobos form a pair, the two pairs join, then the gorilla joins them, and so on. Spaces are not allowed in tip names, so underscores stand in for them. The outermost group has three members, which is how an unrooted tree is usually written; a rooted version would end in two.
The file IQ-TREE writes adds branch lengths after colons and support values as labels on internal nodes. This piece of it describes the human-Neanderthal pair:
(Human:0.0073860424,Neanderthal:0.0058660400)100/100:0.0537245376The human branch is 0.0074 substitutions per site long and the Neanderthal branch 0.0059. The pair's ancestor has support 100/100 and sits on a branch of 0.054. The full tree file, alignment and IQ-TREE report are available to download. Because support values are stored as node labels, some programs read them as node names or drop them, so check that they survive when you move a tree between tools.
Common misreadings
Most mistakes with trees come from reading them like other diagrams:
- Judging relatedness by which tips sit next to each other. Only shared ancestors count, and any node can be rotated.
- Reading the tips as a ladder from primitive to advanced. Every living tip has evolved for the same length of time since its split.
- Treating a tip as the ancestor of another. Neanderthals in Figure 1 are a sister lineage of modern humans, not their ancestor.
- Reading an unrooted tree as if the first sequence in the file were the oldest. Without an outgroup or other rooting evidence, no node is the oldest.
- Taking a long branch as old age. In a phylogram it means more estimated change, which can also come from a faster rate.
- Treating support values as the probability that a clade is true, or comparing UFBoot, bootstrap and posterior values on one scale.
- Treating a gene tree as the species tree. One locus can disagree with the species history and still be correct for that locus.
Phylogenetic tree tools on ProteinIQ
The example in this guide follows the usual path. MAFFT aligns the sequences; Clustal Omega and MUSCLE5 are alternatives worth comparing when the alignment is uncertain. IQ-TREE then chooses a model with ModelFinder, finds the maximum likelihood tree and computes UFBoot and SH-aLRT support, and its viewer draws the tree with support labels and branch lengths.
RAxML-NG is a second maximum likelihood program with standard bootstrapping and transfer bootstrap expectation, which is useful as an independent check of an IQ-TREE result. FastTree builds approximate maximum likelihood trees with SH-like local support for alignments too large for a full search.
Frequently asked questions
What is the difference between a phylogenetic tree and a cladogram?
A cladogram is one kind of phylogenetic tree: it shows only the branching order, and its branch lengths mean nothing. A phylogram adds branch lengths in substitutions per site, and a chronogram puts them in time. All three can show the same relationships.
How do you tell which species are most closely related on a tree?
Find the most recent common ancestor of each pair, the internal node where their lineages meet. The pair whose ancestor is furthest from the root is the most closely related. Ignore how close the tips are on the page and how many nodes lie between them. Percent identity figures, such as how much DNA humans share with other animals, measure similarity instead; when lineages change at different rates, the most similar pair is not always the most closely related.
What is an outgroup?
An outgroup is a sequence known from independent evidence to fall outside the group you are studying. Placing the root on the branch between the outgroup and the rest turns an unrooted tree into a rooted one. The rhesus macaque is the outgroup for the apes in Figure 1.
What does a bootstrap value of 70 mean?
It means 70% of trees built from resampled versions of the alignment contained that branch. For the standard bootstrap, 70% or more is usually treated as good support. For IQ-TREE's ultrafast bootstrap the comparable threshold is 95%, because the two scales differ.
Does a phylogenetic tree show that humans evolved from chimpanzees?
No. Humans and chimpanzees are both tips, living lineages that descend from a shared ancestor that was neither. The tree in Figure 1 shows that this common ancestor is more recent than the one humans share with gorillas.