How much DNA do humans share with other animals?
Compare human DNA with chimpanzees, dogs, cats, mice, pigs, fish, and other animals, with clear definitions of sequence identity and shared genes.
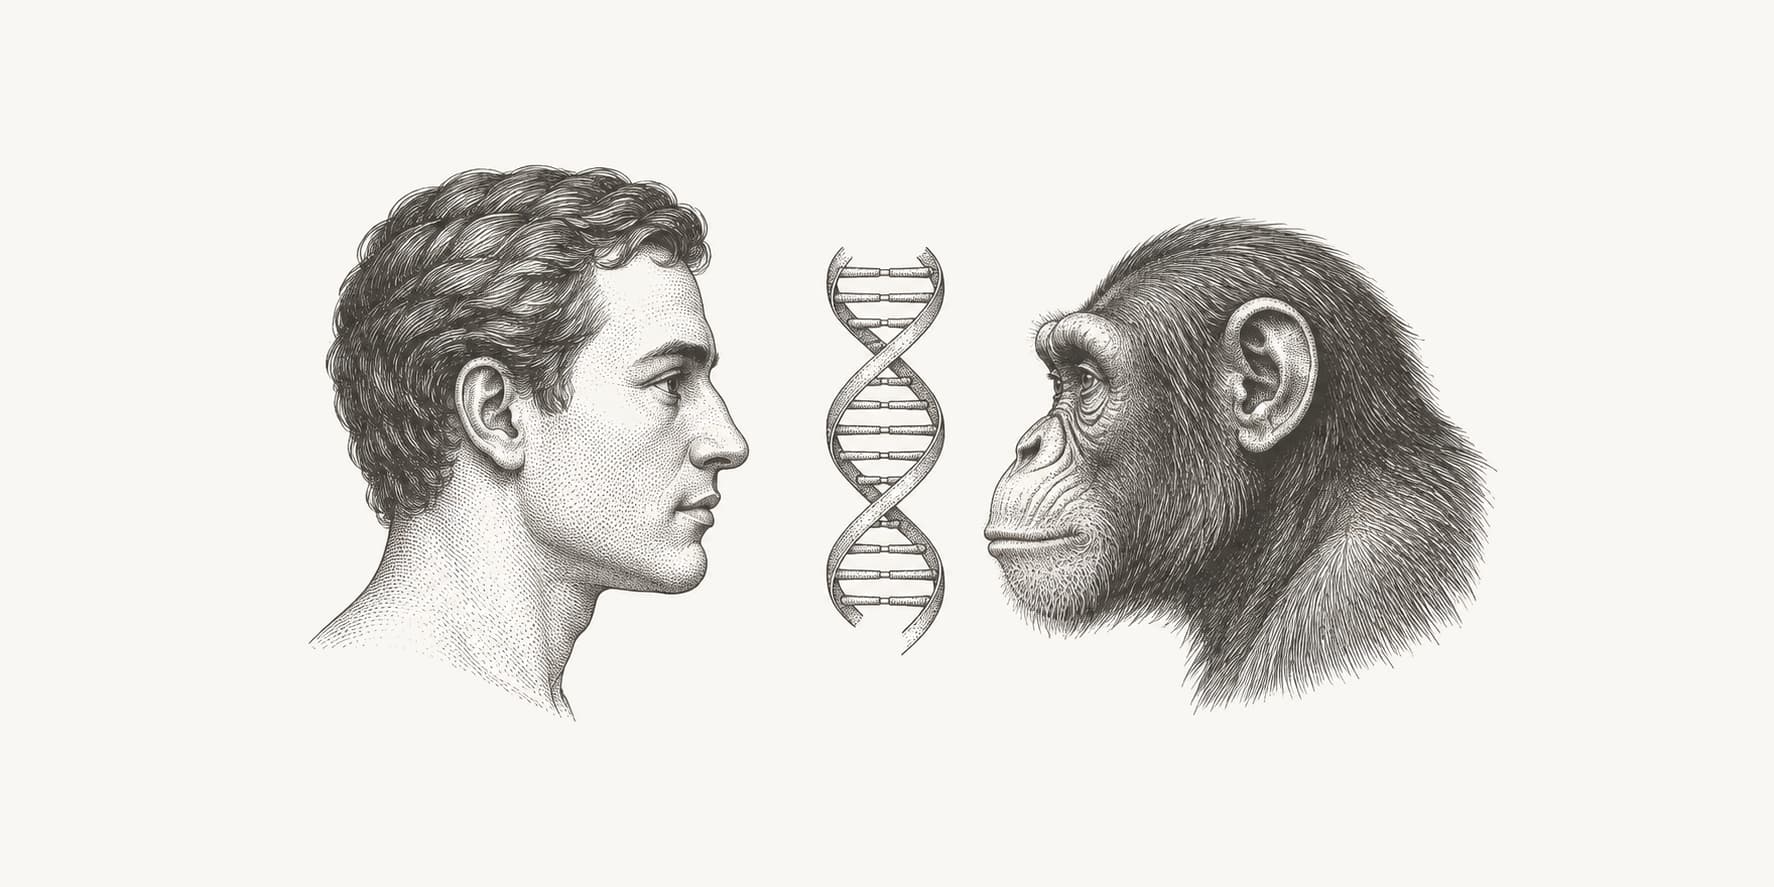
Humans and chimpanzees have about 98.8% identical DNA across directly aligned bases, and chimpanzees and bonobos are our closest living relatives. That percentage describes matching DNA letters in the regions compared. It does not mean that two complete genomes are identical except for 1.2% of their length.
Comparisons with other animals often answer a different question: how many human genes have an evolutionary counterpart in that species? Distinguishing these measurements explains why a high shared-gene percentage can coexist with much lower genome alignment coverage.
How much DNA do humans share with other animals?
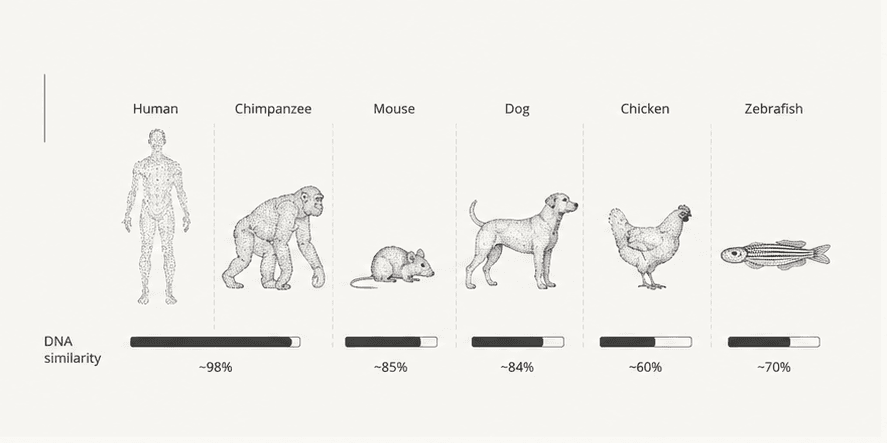
A useful comparison must specify whether it measures DNA sequence identity, alignment coverage, protein identity, or shared genes. These quantities have different denominators and cannot be combined into a single ranking of animals.
| Measurement | What is counted | Published example |
|---|---|---|
| DNA sequence identity | Matching DNA letters among the positions compared | About 98.8% in directly aligned human–chimpanzee DNA, 2005 |
| Alignment coverage | The fraction of a reference genome included in an alignment | About 40% of the human genome aligned confidently with mouse, 2002 |
| Protein sequence identity | Matching amino acids in compared proteins | 75.3% median amino-acid identity among chicken–human one-to-one orthologs, 2004 |
| Gene counterpart presence | Genes with a detected evolutionary counterpart, regardless of exact sequence identity | About 70% of human protein-coding genes had a zebrafish ortholog, 2013 |
Sources: the chimpanzee, mouse, chicken, and zebrafish reference-genome studies. Each figure retains its original study's scope; the rows are examples of different measurements, not directly comparable estimates.[1][2][3][4]
An ortholog is a gene in another species descended from the same ancestral gene through a species split. Orthologs may retain similar functions despite changes in their DNA and protein sequences. Gene duplications also mean that one human gene can correspond to several genes in another animal. Ensembl distinguishes these one-to-one, one-to-many, and many-to-many relationships when it reconstructs gene-family histories.[5][6]
The denominator matters even when both results count genes. The percentage of human genes with a zebrafish counterpart need not equal the percentage of zebrafish genes with a human counterpart. The species have different gene sets, and duplicated genes affect the two directions differently.
Which animals have the closest DNA to humans?
Chimpanzees and bonobos are humans' closest living relatives. The familiar 98.8% chimpanzee figure comes from the 2005 draft-genome comparison. The 2012 bonobo study reported 98.7% identity to humans in corresponding single-copy autosomal regions, meaning regions outside the sex chromosomes represented once in the comparison.[1][7]
Those two published percentages do not establish that chimpanzees are evolutionarily closer to humans than bonobos. The chimpanzee and bonobo lineages separated after their common ancestor had diverged from the human lineage. Differences in reference individuals, included regions, and analysis methods also affect the reported decimals.[7]
Monkeys are more distant relatives. In the 2007 rhesus macaque genome study, aligned human–macaque nucleotide sequences averaged 93.54% identity. Including small insertions and deletions reduced the reported identity to 90.76%. This pair of results shows how changing the treatment of alignment gaps changes the answer even for the same two species.[8]
More complete genome assemblies extend the comparison into regions that older drafts could not resolve. The 2025 complete ape genome study included repetitive and duplicated DNA and distinguished single-nucleotide differences from sequence that failed to align or did not fit a simple one-to-one alignment. Such regions cannot all be interpreted as ordinary mismatching DNA letters. The study broadens what can be compared; it does not turn the classic aligned-base percentage into a measurement of every base in both genomes.[9] Our human–chimpanzee DNA comparison explains these definitions in more detail.
How many human genes have counterparts in other animals?
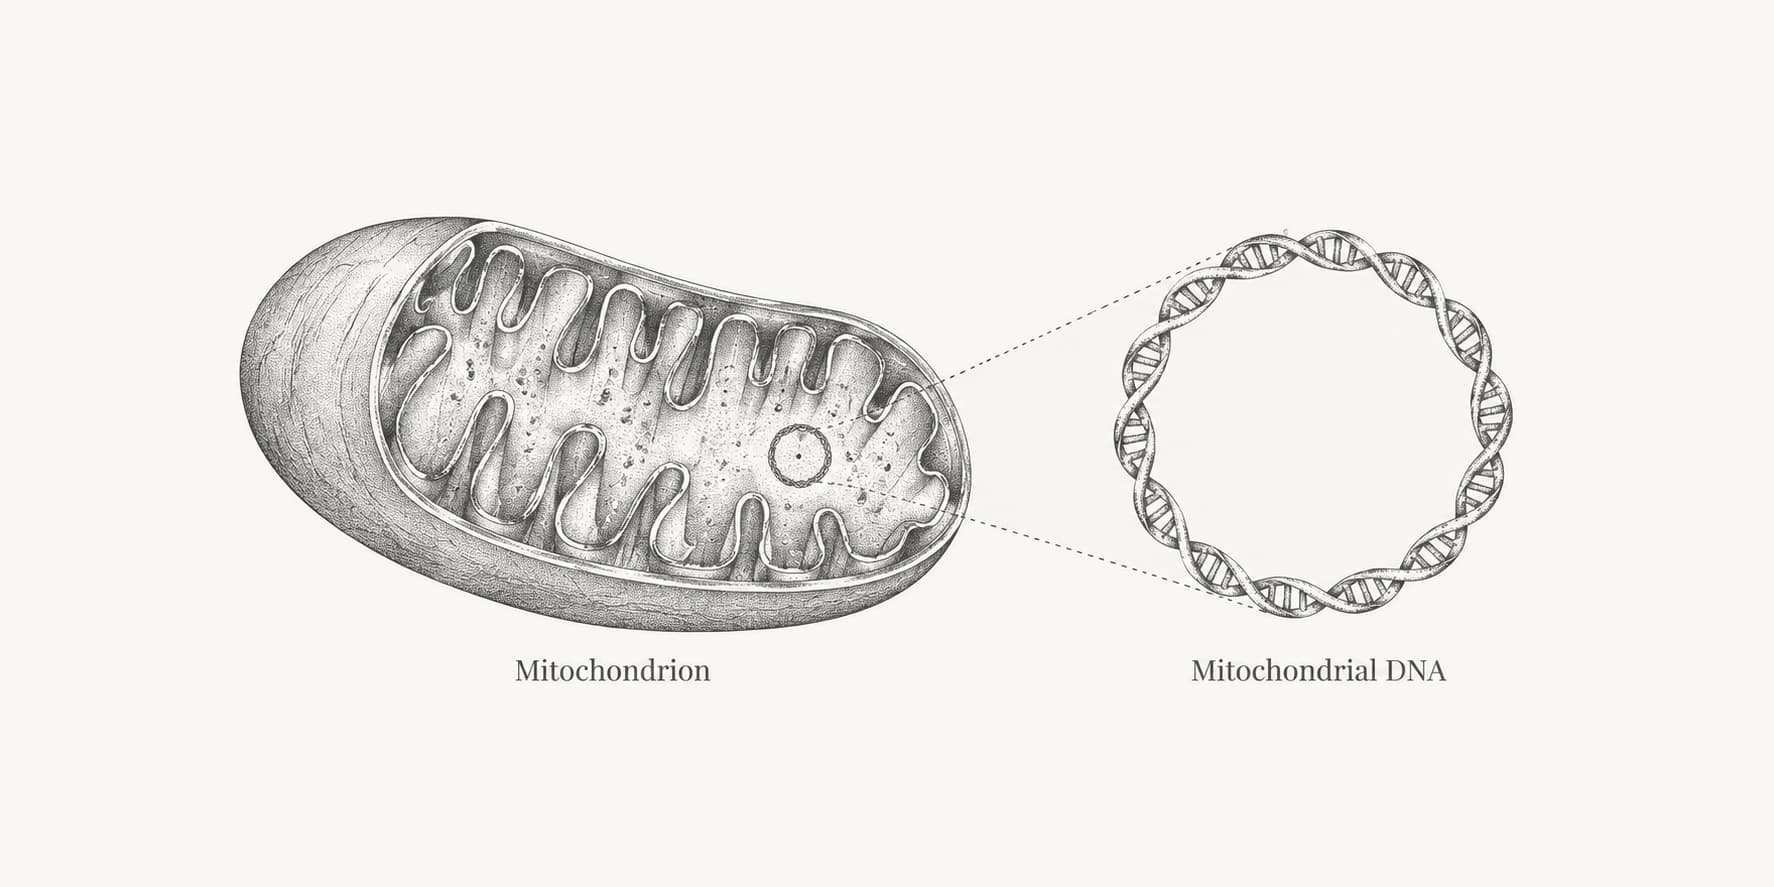
Our previously reported Ensembl release 116 comparison found a detected counterpart for 91.2% of human protein-coding genes in chimpanzees, 85.5% in dogs, and 44.6% in fruit flies. These are gene-presence percentages, not DNA sequence identities.
For that comparison, we counted unique human protein-coding genes on chromosomes 1–22, X, Y, and mitochondrial DNA with at least one Ensembl ortholog in each species. We included one-to-one, one-to-many, and many-to-many orthologs, counting each human gene once per species. The denominator was 20,107 human protein-coding genes, and the recorded retrieval date was August 17, 2026.[10][5]
| Animal | Human protein-coding genes with at least one ortholog | Share of 20,107 human genes |
|---|---|---|
| Chimpanzee | 18,329 | 91.2% |
| Orangutan | 18,050 | 89.8% |
| Mouse | 17,684 | 87.9% |
| Pig | 17,594 | 87.5% |
| Cow | 17,514 | 87.1% |
| Rhesus macaque | 17,502 | 87.0% |
| Rat | 17,382 | 86.4% |
| Dog | 17,185 | 85.5% |
| Horse | 17,119 | 85.1% |
| Elephant | 16,694 | 83.0% |
| Cat | 16,444 | 81.8% |
| Dolphin | 15,849 | 78.8% |
| Zebrafish | 14,032 | 69.8% |
| Chicken | 13,932 | 69.3% |
| Fruit fly | 8,968 | 44.6% |
Source: our earlier calculation using Ensembl BioMart release 116. We checked that the percentages reproduce the listed counts divided by 20,107, rounded to one decimal place. The original gene-level export is not available with this article, so the underlying counts have not been independently reproduced for this revision. Treat this as a dated comparison, rather than a newly verified database extract.[10]
The ordering is not an evolutionary family tree. Macaques are closer relatives of humans than mice, yet fewer human genes have a detected macaque counterpart in this table. Assembly completeness, annotation, genuine gene gains and losses, and orthology inference all influence the counts. The table alone cannot identify which factor explains a particular difference.[6]
The human denominator is also specific to the annotation and filters. It should not be replaced with a total from another release or database while retaining the same numerators. Our guide to the number of human genes explains why protein-coding gene totals change as annotations are revised.
Do humans share more DNA with cats, dogs, mice, or pigs?
The popular percentages for these mammals do not provide a consistent answer. In our earlier gene-count comparison, mouse and pig had detected counterparts for a larger share of human genes than dog and cat. That ordering does not establish a corresponding ranking of whole-genome DNA identity.
The 90% cat figure has a narrower basis than the claim that 90% of all cat DNA matches human DNA. The 2007 cat genome study identified putative cat genes that included homologs for about 90% of the annotated human genes in its comparison. A homolog is a gene related through shared ancestry; detecting one does not require every DNA letter to match. The draft assembly, annotation, and homology criteria also differed from those used in our later Ensembl comparison.[11]
For dogs, the 2005 reference-genome study compared genes, aligned sequence, and conserved chromosome organization across dog, human, and mouse. It does not support treating an unlabeled popular figure such as “84% shared DNA” as a universal whole-genome identity. The 85.5% in our table has an explicit, narrower definition: human protein-coding genes with a detected dog ortholog.[12]
For mice, the classic genome study could confidently align about 40% of the human genome at the nucleotide level. This is compatible with finding counterparts for a much larger fraction of human protein-coding genes: the latter asks whether a gene can be recognized, not whether all the surrounding non-coding DNA aligns.[2]
For pigs, the 2012 genome study examined about 9,000 one-to-one orthologs shared across six mammals: human, mouse, dog, horse, cow, and pig. That selected set supported an analysis of gene evolution. It was not evidence that pig and human genomes are 98% identical. Anatomical or physiological similarities likewise cannot establish a DNA identity percentage.[13]
What do the chicken, fish, and fruit-fly percentages mean?
The often-quoted 75% chicken figure concerns protein sequence identity, rather than 75% identity across complete human and chicken genomes. The 2004 chicken genome paper reported a median amino-acid identity of 75.3% among chicken–human one-to-one orthologs. Protein identity counts amino acids, whereas the 69.3% chicken value in our earlier table counts human genes with a detected ortholog.[3]
For zebrafish, the 2013 reference-genome paper reported that about 70% of human protein-coding genes had at least one zebrafish ortholog. In a separate disease-gene comparison, 2,601 of 3,176 human genes with morbidity descriptions in the study's OMIM dataset had a zebrafish ortholog, reported as 82%. That is a defined subset of human genes, not 82% of the human genome. Neither estimate can be generalized to every fish species.[4]
For fruit flies, the 44.6% in our earlier table counts detected counterparts among human protein-coding genes. It does not measure how similar those genes are base by base. A headline such as “60% shared DNA” cannot be substituted for that result without establishing its gene set, matching method, and denominator. Ensembl's gene-tree approach can detect complex relationships involving duplicated genes, making the distinction between any ortholog and a one-to-one ortholog particularly relevant to distant comparisons.[6]
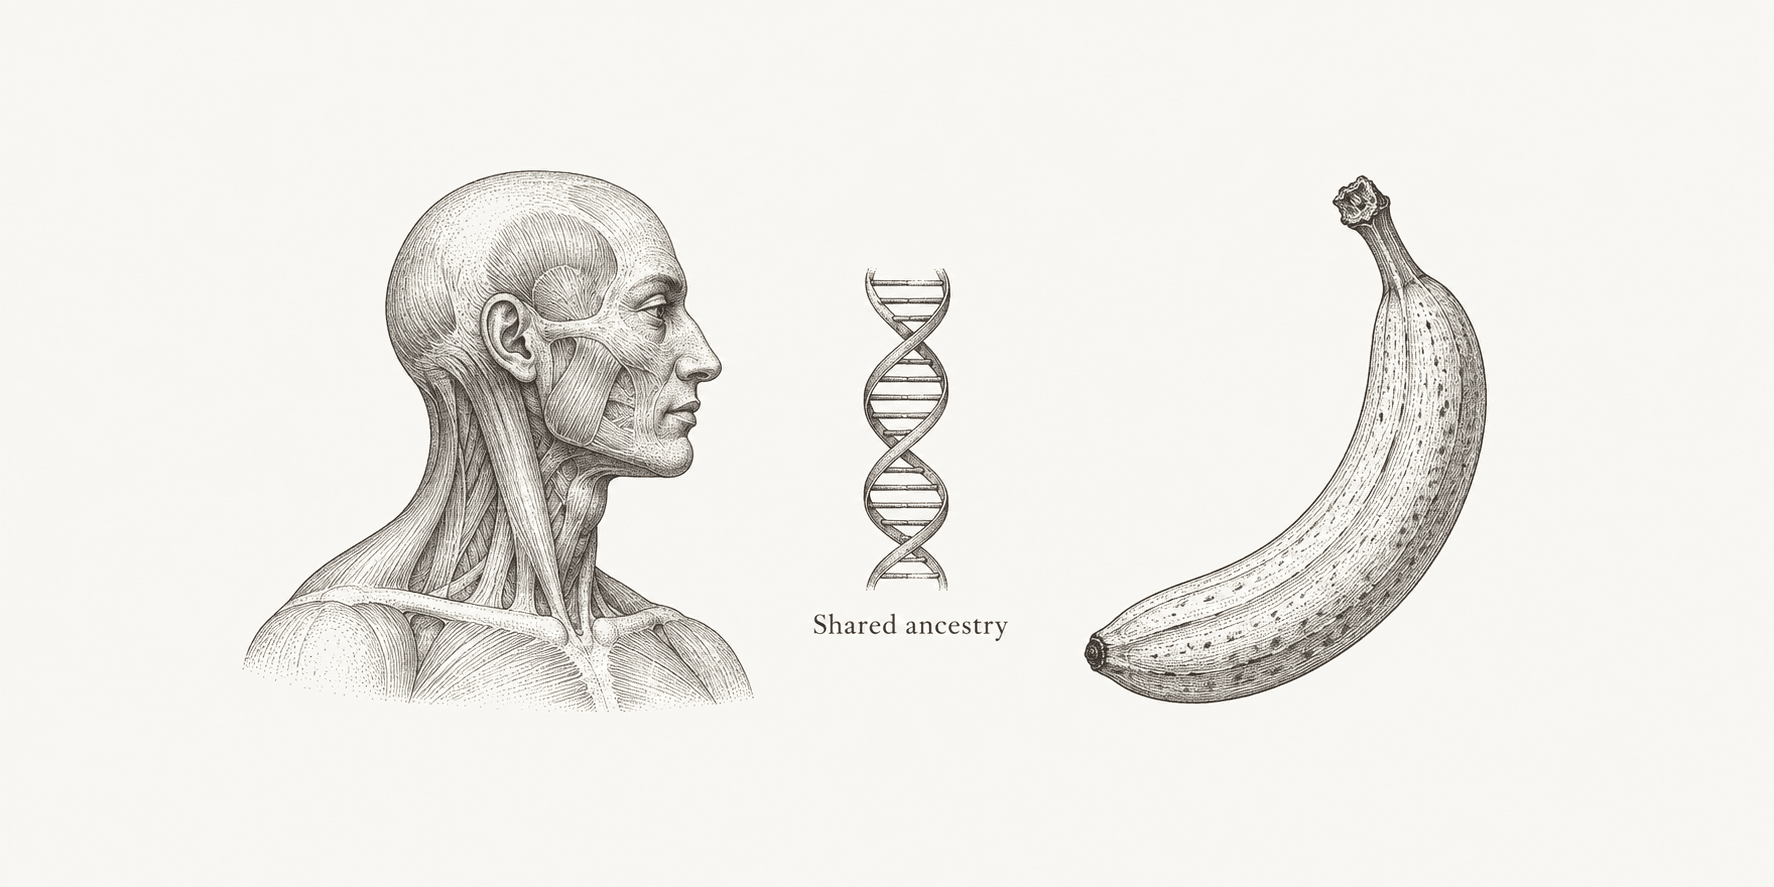
Do humans also share genes with plants and bananas?
Yes. Humans and plants retain genes inherited from distant common ancestors, including genes involved in basic cellular processes. However, a shared-gene percentage for one plant cannot describe all plants or trees.
In a 2020 analysis, Natasha Glover compared human and banana protein-coding genes using several orthology methods and summarized the detected share as approximately 17–24%. This was a separate analysis with its own datasets and methods. It is not a row from our Ensembl comparison and should not be presented as though it used the same denominator or pipeline.[14]
Our human–banana DNA comparison examines the origin of the much larger popular percentages. Across both animal and plant comparisons, a reproducible claim needs the species, reference data, unit of comparison, and treatment of unmatched sequence.
For a small set of related genes or proteins, a sequence alignment can answer a more limited question. Tools such as MAFFT or Clustal Omega align submitted homologous sequences. Any identity calculated from those alignments applies to those sequences and the stated gap-counting rules. A species-wide estimate requires a genome-wide analysis with its own coverage and identity definitions.