The best answer depends on how you define function. Protein-coding sequences make up roughly 1.2% of the genome. By the stricter standard of evolutionary constraint, about 8–15% of human DNA appears to be functional. The remaining 85–92% is non-functional by that definition. But if you define function as any detectable biochemical activity, that number flips: the ENCODE project reported that 80.4% of the genome participates in at least one biochemical event in at least one cell type. The gap between those two answers is the central debate.
How much of the genome codes for proteins?
Protein-coding exons cover roughly 1.2% of the human genome, or about 2.94% when untranslated regions are included. The ENCODE consortium reported that exons of protein-coding genes cover 2.94% of the genome, with the protein-coding portion alone occupying 1.22%.[1]
A 2019 analysis confirmed that coding DNA occupies between 1% and 2% of the genome, depending on which exon boundaries are used and how the total genome size is measured.[4]
Protein-coding genes are far larger than their coding portions suggest once introns are included. The same ENCODE analysis found that protein-coding genes span roughly 33–40% of the genome from the outermost transcription start to the polyadenylation site. Most of that span is intronic DNA, which is transcribed into precursor RNA but spliced out before translation.[1]
What makes up the non-coding majority?
Roughly 98–99% of the human genome does not code for proteins. That non-coding fraction breaks down into several broad categories.
Transposable elements and their decayed remains make up the single largest component. About 42% of the genome is recognizably derived from retrotransposons, including LINEs and SINEs, and another 3% from DNA transposons. Much of the remaining half of the genome that has no identified origin is thought to be transposable elements that are so ancient that random mutations have made them unrecognizable.[5]
Introns within protein-coding genes cover about 37% of the genome, and non-coding RNA genes - including ribosomal RNA, transfer RNA, microRNA, and long non-coding RNA genes - take up at least another 6%.[1]
Centromeric DNA accounts for roughly 6% of the genome, though the exact amount varies between individuals.[6] Other functional non-coding elements include telomeres, origins of replication, scaffold attachment regions, promoters, enhancers, and silencers. These regulatory sequences are critical but collectively occupy a small fraction of the genome because they tend to be short.
Pseudogenes, former genes that have been disabled by mutation, number roughly 15,000 and may cover about 5% of the genome when their former intronic sequences are included. Endogenous retrovirus sequences make up over 8%.
How much of the genome is functional?
The answer changes dramatically depending on the definition of function.
By biochemical activity, the 2012 ENCODE project assigned function to 80.4% of the human genome. That figure includes any DNA segment that is transcribed into RNA, bound by a transcription factor, associated with a specific chromatin structure, or marked by a histone modification in at least one of the 147 cell types studied. ENCODE also reported that 95% of the genome lies within 8 kilobases of a DNA-protein interaction and 99% is within 1.7 kilobases of at least one measured biochemical event.[1]
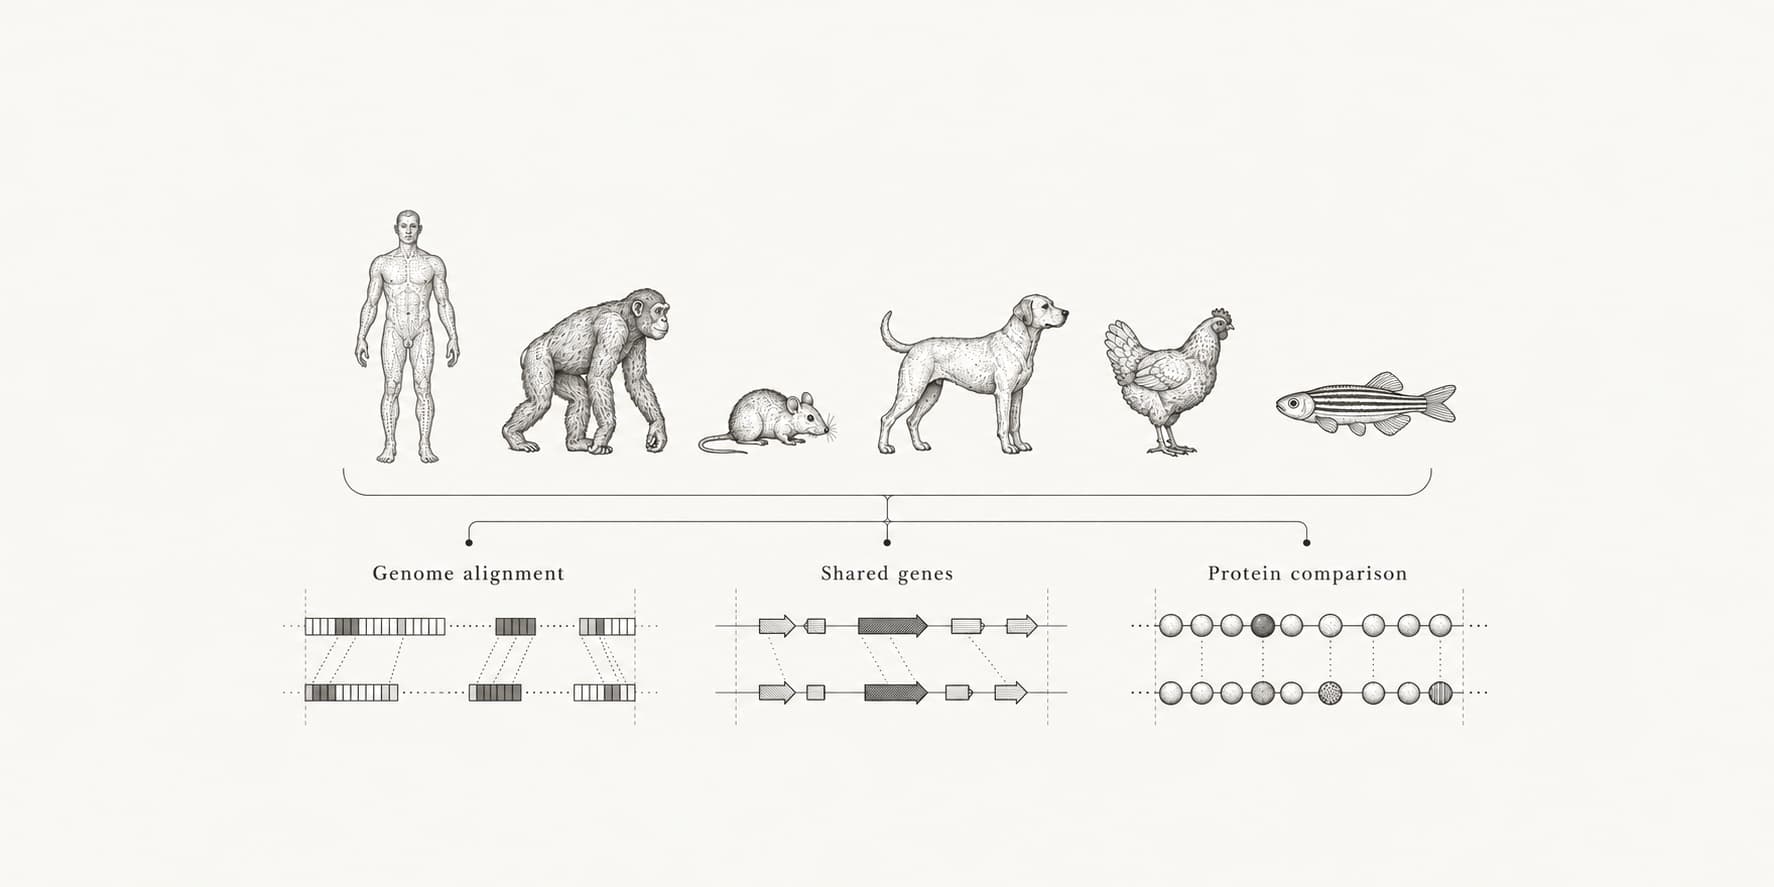
By evolutionary constraint, the fraction is much smaller. A 2014 study of 29 placental mammals estimated that 8.2% of the human genome is under purifying selection - meaning mutations in those regions are weeded out because they reduce fitness. That study found that protein-coding exons account for about 1% of the constrained fraction, with the remaining ~7% distributed across untranslated regions, promoters, enhancers, and other non-coding elements.[2]
By the mutational-load argument, the functional fraction has a hard ceiling. A 2017 paper calculated that if more than about 8–14% of the human genome were functional, the rate of deleterious mutations per generation would be unsustainable - every newborn would carry too many harmful mutations for the population to persist. That gives a theoretical upper bound of roughly 10–15% for the functional fraction.[3]
| Definition of function | Estimated functional fraction |
|---|---|
| Protein-coding exons | 1.2% |
| Evolutionary constraint (placental mammals) | 8.2% |
| Mutational-load upper bound | 8–14% |
| Biochemical activity (ENCODE, any cell type) | 80.4% |
These numbers are not contradictory. They measure different things. Biochemical activity captures transient transcription and loose protein binding that may not affect fitness. Evolutionary constraint captures only DNA where mutations measurably harm survival or reproduction. Most researchers treat the constraint-based estimates as the more meaningful answer, while acknowledging that some unconstrained DNA may still have subtle or lineage-specific functions.
Why do estimates range from 8% to 80%?
The disagreement comes down to what counts as function.
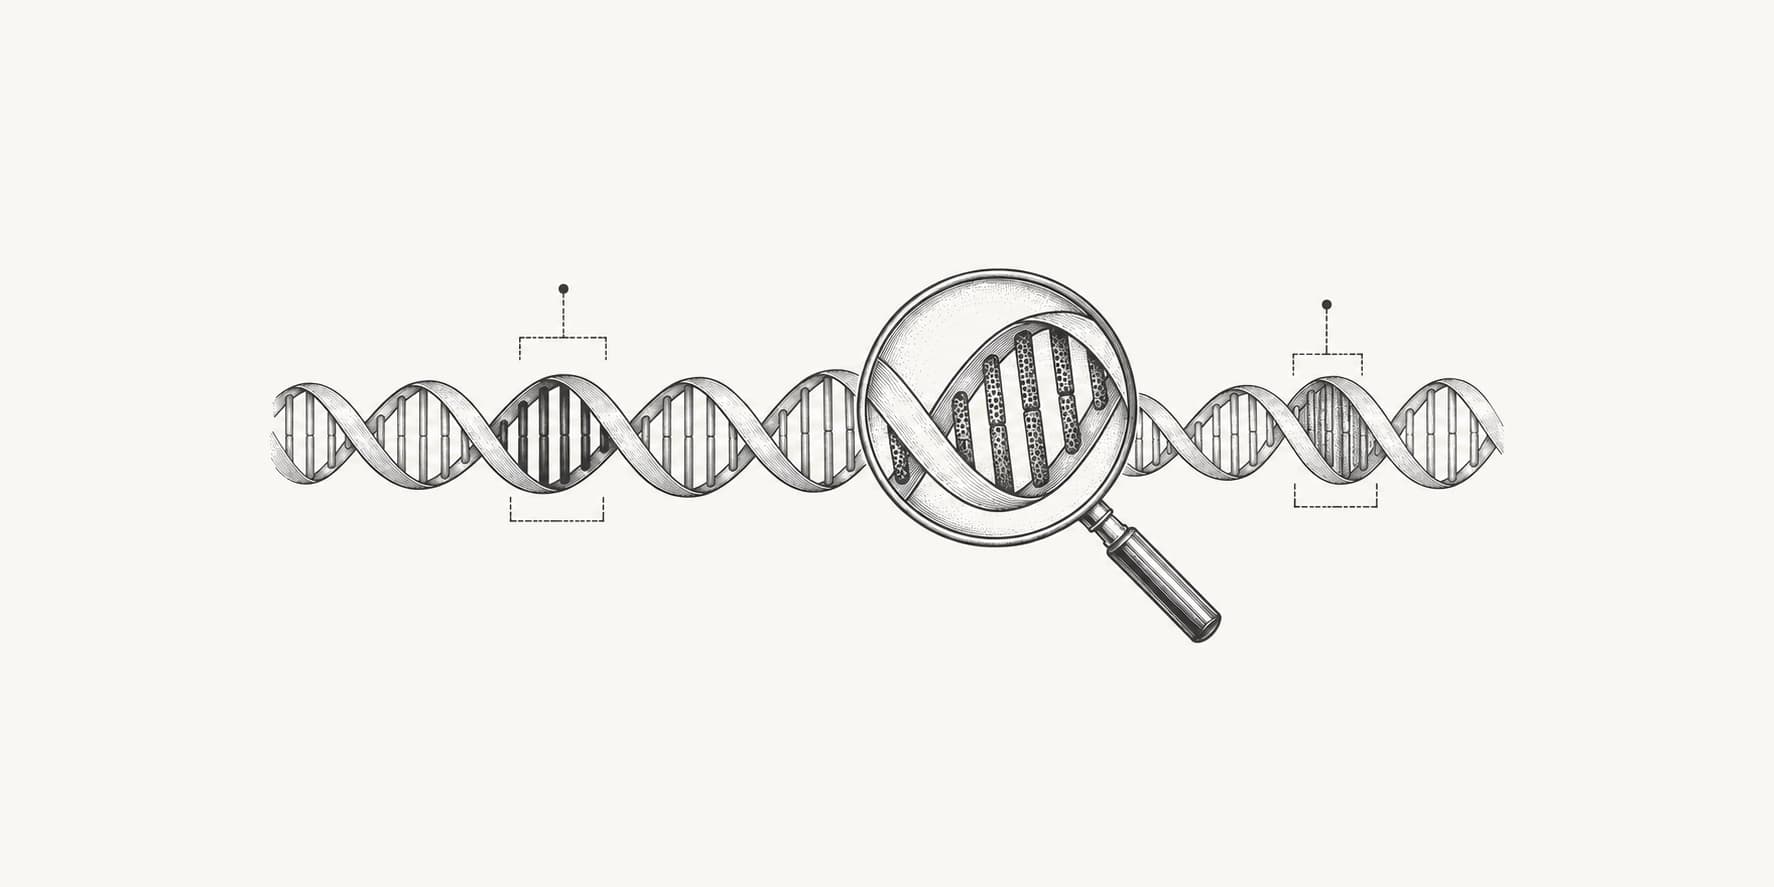
The ENCODE consortium defined a functional element as any DNA segment that "encodes a defined product or displays a reproducible biochemical signature." That definition includes every transcribed region, every bound transcription factor site, and every chromatin mark, regardless of whether disrupting that sequence has any detectable effect on the organism.[1]
Critics of that definition pointed out that biochemical activity does not equal biological importance. Much of the genome is transcribed at low levels without evidence that the resulting RNA does anything. Many transcription factor binding sites are expected to occur by chance in a genome of 3 billion base pairs, and most bound sites may be non-functional. In one widely cited critique, Dan Graur and colleagues argued that if the ENCODE definition were applied to a television set, a broken one that still draws current would be considered "functional."[3]
The evolutionary definition is stricter but also has limits. Constraint-based methods can only detect DNA that has been under selection long enough to leave a statistical signal. Lineage-specific functional elements, recently evolved regulatory sequences, and DNA whose function does not depend on precise sequence may all be missed. This means 8.2% is a floor, not a ceiling.
Most contemporary estimates converge on 10–20% as a plausible functional fraction. The remaining 80–90% of the genome likely consists of neutral or nearly neutral DNA: the accumulated debris of transposable elements, broken genes, and viral insertions that natural selection has not been strong enough to remove. Organisms such as the bladderwort plant, which shed most of its repetitive DNA and functions with a genome one-fortieth the size of the human genome, demonstrate that large genomes do not need most of their non-coding DNA.