TL;DR
- As of September 19, 2026, GENCODE v50 lists 19,442 protein-coding genes, excluding readthrough genes from that headline count.
- The same release contains 78,733 annotated gene entries across all categories; that is not a count of confirmed functional genes.
- A gene count describes distinct gene loci, not the copies inherited from each parent or the number of proteins a cell makes.
- Our comparison of GENCODE v45 and v50 finds 60 identifiers entering and 13 leaving the counted coding set, a net increase of 47. These are annotation changes, not 60 confirmed gene discoveries.
Humans have about 20,000 protein-coding genes. GENCODE Release 50 gives a more precise count of 19,442, using its definition of protein-coding genes on the main reference chromosomes. Including non-coding genes, pseudogenes, and other annotation categories brings the same catalog to 78,733 entries.
These numbers answer different questions. A protein-coding gene contains instructions for a protein, while a non-coding RNA gene produces RNA that is not translated into a protein. A genome annotation also records uncertain and gene-like sequences. The total number of annotated entries therefore exceeds the number of established functional genes, and neither count describes how many physical gene copies a person inherits.
What does the human gene count include?
GENCODE v50 lists 19,442 protein-coding genes and 78,733 gene entries overall. Released in June 2026, it uses the GRCh38.p14 reference assembly.[1][2] An assembly is the reference DNA sequence; an annotation identifies genes and other features along that sequence.
The statistics cover chromosomes 1–22, X, Y, and MT. They exclude alternate loci and patches, which provide additional representations or corrections of genomic regions. This is a reference catalog, rather than a count of the gene copies in one person's cells.[3] Table 1 accounts for all entries by annotation category; Figure 1 compares the four largest summary categories with the overall total.
| Annotation category | GENCODE v50 entries | Scope |
|---|---|---|
| Protein-coding genes | 19,442 | Headline count, excluding readthrough genes |
| Long non-coding RNA summary | 35,885 | Includes entries awaiting experimental confirmation |
| Small non-coding RNA summary | 7,608 | Includes mitochondrial RNA genes and rRNA pseudogenes |
| Pseudogene summary | 14,702 | Includes immune-receptor pseudogenes |
| Readthrough genes | 665 | Coding annotations spanning neighboring genes |
| Coding immune-receptor segments | 412 | Immunoglobulin and T-cell receptor segments |
| Artifact entries | 19 | Annotations classified as artifacts |
| All annotated entries | 78,733 | Total across the categories above |
Readthrough annotations describe transcripts that extend across neighboring gene loci. GENCODE separates these from its headline coding count: 20,107 entries with the protein_coding classification minus 665 readthrough entries gives 19,442.[1][3] Keeping that exclusion explicit prevents a difference in counting rules from being mistaken for a scientific disagreement.
We summed the published counts for the two broad non-coding RNA groups to obtain 43,493 entries combined. This is our calculation from published summary counts, not a separate experimental census. The long-RNA group includes 34,866 lncRNA entries and 1,019 TEC entries, meaning “to be experimentally confirmed”; the small-RNA group includes 497 rRNA_pseudogene entries.[1][6] The labels therefore do not establish a biological function for every entry. GENCODE's pseudogene summary includes immunoglobulin and T-cell receptor pseudogenes, while rRNA pseudogenes are grouped with small RNAs.[3]
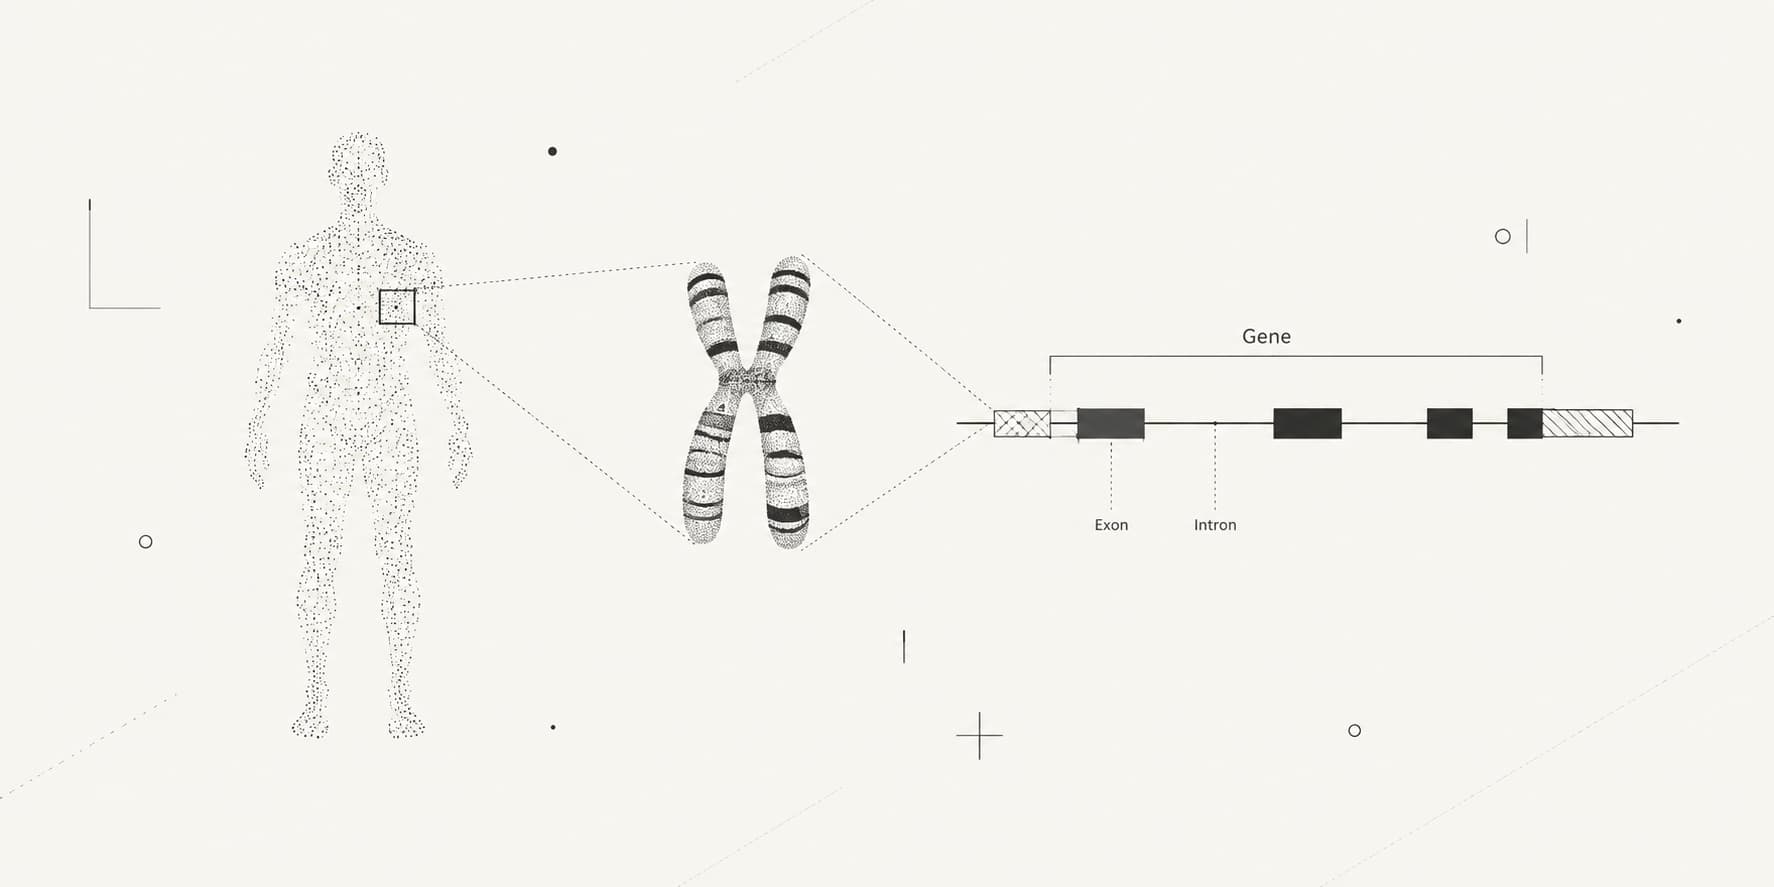
Nor does a count of non-coding RNA genes describe all non-coding DNA. That broader term includes introns within protein-coding genes and sequences between genes. Gene classification and the fraction of the genome that encodes proteins are different measurements.
Why do GENCODE, RefSeq, and HGNC report different counts?
Human protein-coding gene counts differ because databases use different evidence, inclusion rules, and reference sequences. GENCODE and NCBI RefSeq annotate genomes, while the HUGO Gene Nomenclature Committee (HGNC) maintains approved gene names and symbols. Table 2 compares their reported counts alongside the intersection and union from a published three-catalog study.
| Source and snapshot | Protein-coding count | What is counted |
|---|---|---|
| GENCODE v50, June 2026 | 19,442 | Main reference chromosomes; readthrough genes excluded |
| NCBI RefSeq RS202508 | 19,890 | GRCh38.p14 primary assembly |
| HGNC, September 3, 2025 | 19,294 | Genes with approved protein-coding symbols |
| Maquedano and colleagues, 2025: intersection | 19,268 | Genes classified as coding in all three catalogs studied |
| Maquedano and colleagues, 2025: union | 21,871 | Genes classified as coding in at least one catalog studied |
Download the cross-database human gene count data (CSV)
Assembly scope alone can change a total within one database. RefSeq's August 2025 annotation reports 19,890 coding genes on the GRCh38 primary assembly, 20,076 across its full reported GRCh38 scope, and 20,070 on T2T-CHM13v2.0. The larger GRCh38 figure includes genes represented on alternate loci or patches; it is not obtained by simply adding the counts for each assembly unit, because some genes occur on multiple units.[7]
The three-catalog study addresses a different question: whether curators agree that a locus encodes a protein. Maquedano and colleagues found 2,603 genes whose coding classification differed among the catalogs. Their analysis used GENCODE v45, so its consensus count is not an updated estimate for v50. The authors also showed that removing readthrough genes and immunoglobulin fragments reduced disagreement.[9]
A precise gene count consequently needs four details: the database, release, reference assembly, and inclusion rule. Without them, a difference of several hundred genes may reflect catalog scope as much as biological evidence.
Why do some sources say 20,000–25,000 genes?
The familiar 20,000–25,000 range is a historical estimate of human protein-coding genes from the Human Genome Project's finished-sequence analysis in 2004. It does not include every class of non-coding gene.[10] Table 3 places this estimate between earlier expectations and the release-specific GENCODE count.
| Period or annotation | Protein-coding estimate or count | Basis |
|---|---|---|
| Before the draft genome | About 100,000 | Widely held expectation recalled in the 2004 NHGRI announcement |
| 2001 draft genome | 30,000–35,000 | Initial sequence analysis |
| 2004 finished-sequence analysis | 20,000–25,000 | Revised estimate using a more complete sequence |
| GENCODE v50, June 2026 | 19,442 | Release-specific annotation count |
The 2004 analysis reported 19,599 confirmed protein-coding genes and another 2,188 predicted coding segments. Better sequence coverage helped resolve errors in earlier gene models, while comparisons with other organisms and improved computational methods strengthened annotation.[10] Subsequent curation has continued to reconsider whether individual loci encode proteins.[9]
A declining estimate does not mean that humans lost thousands of genes over these decades. The change reflects what researchers could identify and support with evidence. Nor is every future release required to contain fewer genes: curators can recognize previously missed loci as well as revise existing classifications.
For general explanations, “about 20,000 protein-coding genes” remains appropriate. MedlinePlus uses about 19,900 while also explaining the Human Genome Project's older range.[4] Exact values are useful when tied to the annotation that produced them.
How much has the human gene catalog changed since 2024?
We compared GENCODE v45 with v50 and found a net increase of 47 protein-coding entries, from 19,395 to 19,442. By matching gene identifiers, we found more movement than this difference alone suggests: 60 identifiers entered the counted coding set and 13 left it, while 19,382 remained coding at both endpoints. These are results of our comparison of published annotations, not new experimental measurements or a count of newly discovered biological genes.[20][21]
Table 4 follows the six releases from January 2024 to June 2026. All use GRCh38.p14, and all counts use the comprehensive annotation of the main reference chromosomes. The coding count excludes genes tagged as readthroughs in each release.[2][3][22]
| Release | Date | All entries | Coding | Entering | Leaving |
|---|---|---|---|---|---|
| v45 | January 2024 | 63,187 | 19,395 | Not compared | Not compared |
| v46 | May 2024 | 63,086 | 19,411 | 17 | 1 |
| v47 | October 2024 | 78,724 | 19,433 | 26 | 4 |
| v48 | May 2025 | 78,686 | 19,435 | 11 | 9 |
| v49 | September 2025 | 78,691 | 19,433 | 1 | 3 |
| v50 | June 2026 | 78,733 | 19,442 | 9 | 0 |
The coding total stayed close to 19,400 even as the broader catalog expanded. The largest step in Table 4 occurs between v46 and v47: all entries increase by 15,638, while coding entries increase by 22. Over the same interval, entries classified specifically as lncRNA rise from 19,258 to 34,914. Changes in an all-gene total can therefore be dominated by RNA annotation rather than protein-coding genes.
For Figure 2, we compiled both counts back to 2014, using the latest published GRCh38 release in each calendar year. The full catalog grows from 60,155 entries in v21 to 78,733 in v50, with a dip in 2016 and a pronounced increase in 2024. The published protein-coding count stays near 20,000, from 19,881 in v21 to 19,442 in v50. The larger total includes non-coding RNA genes, pseudogenes, and other categories.[2][24][21]
We began the timeline in 2014 to keep our comparison within the GRCh38 assembly series. Assembly patch versions change, but every selected statistics page counts only the main reference chromosomes. We used the published summary count for the coding series without retrospectively harmonizing definitions: the selected v42–v50 releases exclude readthrough genes, while v21–v39 do not separately subtract them. The change between the 2021 and 2022 snapshots therefore includes a counting-rule change, not simply a loss of coding genes.[25][26] Annotation rules and evidence also evolve, so these lines describe catalog counts rather than a fixed set of equally validated functional genes. Release months vary, and intermediate releases are omitted. The downloadable chart data records both counts, the coding readthrough policy, release, month, assembly version, source URL, and source-page checksum.
In Figure 3, we grouped identifiers by the annotation changes we observed when they entered or left the coding set between v45 and v50. Of the 60 entering identifiers, 30 were already present under another biotype: 16 as lncRNA and 14 as pseudogenes. One remained classified as protein-coding but lost its readthrough flag, and 29 were absent from the v45 gene records. In the opposite direction, four identifiers changed biotype, three acquired a readthrough flag, and six were absent from v50.
Identifier changes require particular care. We found that 24 of the 29 entering identifiers absent from v45 overlap a same-strand gene span already annotated in v45. All six disappearing identifiers overlap another gene span in v50. Overlap alone does not prove that two records represent the same gene, but it shows why “absent identifier” cannot be equated with “previously unknown gene.”
PAXX provides a concrete example: v47 records ENSG00000148362, while v48 records ENSG00000310560 with the same gene name, strand, and genomic span. Identifier matching records an exit and an entry despite this continuity. CAST shows a related complication: its older identifier changes to lncRNA in v47 while another coding identifier with the same name appears at an overlapping location. That change does not establish that CAST ceased to encode a protein.
We counted only GTF gene rows and matched identifiers after removing their numeric version suffix. We preserved any chromosome-Y pseudoautosomal suffix and did not match by gene name.[23] An identifier coding at both endpoints counts as retained even if its transcripts or coordinates changed. We flagged missing identifiers for same-strand span overlap, including introns, without automatically assigning them to splits, mergers, or replacements. We have not adjudicated the underlying cause of every annotation change.
The gene-level comparison, full methods, analysis script, source manifest, and run provenance provide the records, inclusion rules, download URLs, and checksums needed to reproduce the results. Filter the gene-level file to releases 45 and 50 for the endpoint comparison shown in Figure 3.
Does a human cell have 20,000 genes or 40,000?
About 20,000 describes distinct protein-coding gene loci, meaning positions in the genome, rather than all their inherited copies. For most nuclear genes, a person inherits one copy from each parent. Different sequence versions of the same gene are called alleles.[4]
Most human body cells are diploid, with 46 chromosomes arranged in 23 pairs. Sperm and egg cells carry a single chromosome set. Two chromosome sets provide two copies of most genes without doubling the number of distinct gene identities.[5] A gene count is therefore different from a chromosome count: each chromosome contains many genes.
The reference annotation also includes both X and Y and the mitochondrial chromosome, MT. It should not be multiplied by two to obtain an exact gene-copy count for every cell. The guides to genes per chromosome and mitochondrial genes explain these distinct parts of the genome.[3]
Do humans have more genes than other animals?
Humans do not have an exceptionally large protein-coding gene set. Several animal reference annotations contain more coding genes, while others contain fewer. Table 5 retains the Ensembl release snapshots used for this guide rather than treating gene counts as permanent properties of each species.
| Organism | Coding genes | Reference annotation |
|---|---|---|
| Human | 19,442 | GENCODE v50, GRCh38.p14 |
| Mouse | 22,081 | Ensembl 116, GRCm39 |
| Dog | 20,567 | Ensembl 116, ROSCfam1.0 |
| Domestic cat | 19,209 | Ensembl 116, F.catusFca126mat1.0 |
| Cattle | 20,848 | Ensembl 116, ARS-UCD2.0 |
| Zebrafish | 25,592 | Ensembl 116, GRCz11 |
| Fruit fly | 13,986 | Ensembl 116, BDGP6.46 |
| Arabidopsis thaliana | 27,655 | Ensembl Plants 63, TAIR10/Araport11 |
| Baker's yeast | 6,600 | Ensembl 116, R64-1-1 |
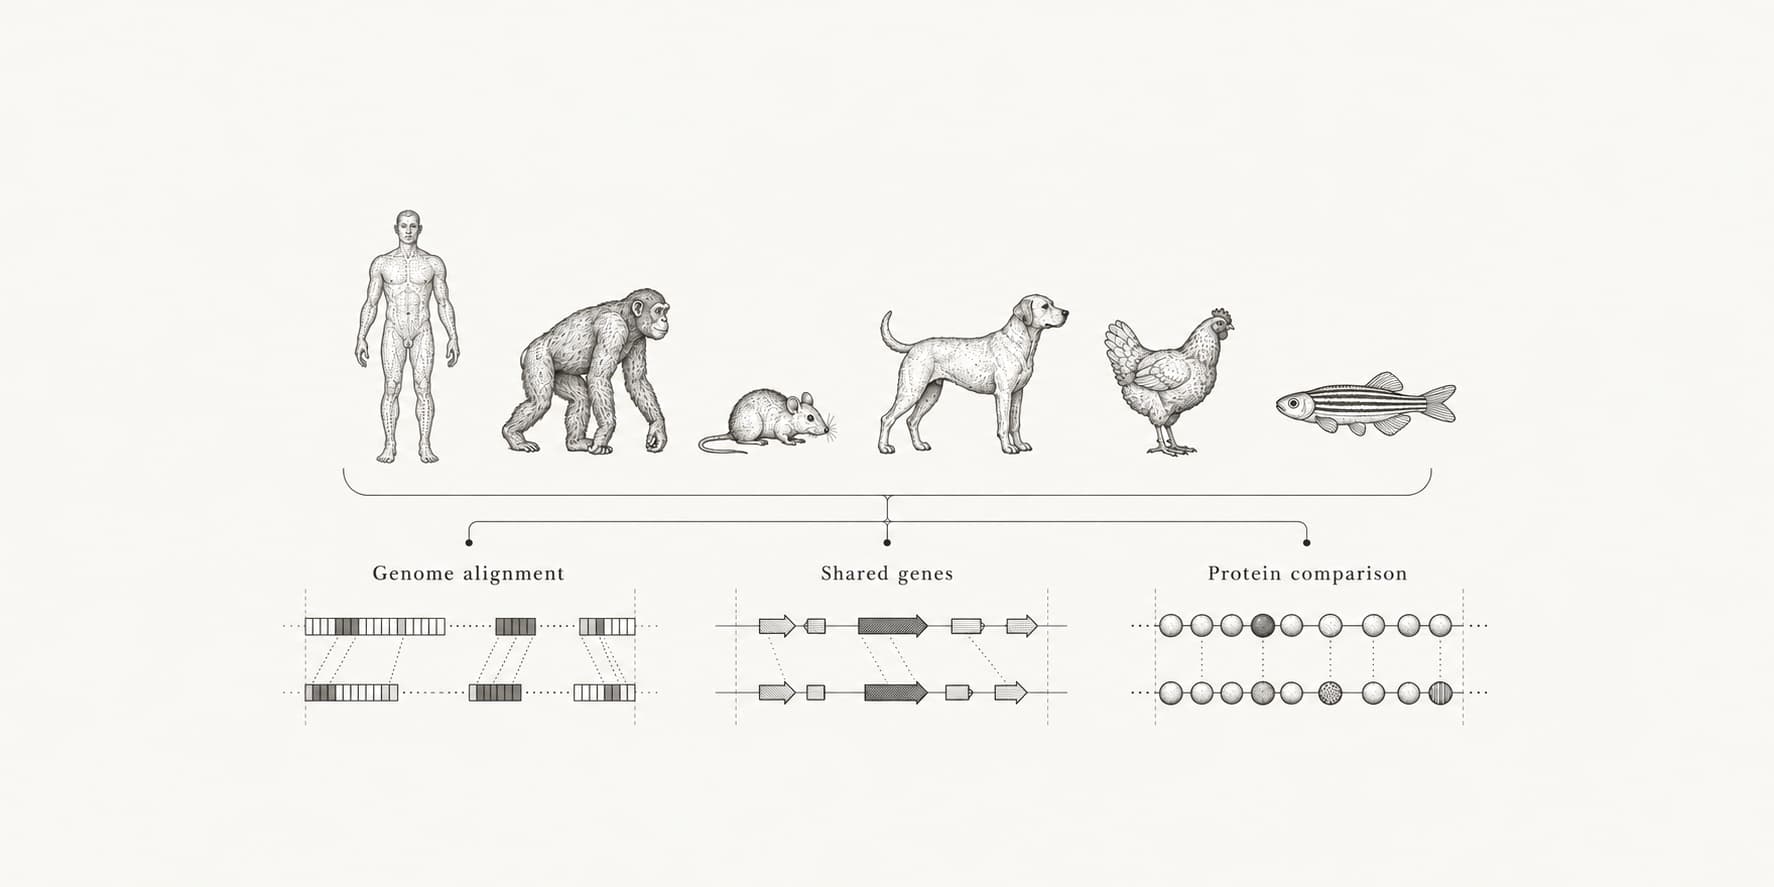
Annotation methods and evidence differ among species, so the counts in Table 5 compare the scale of cataloged gene sets rather than provide a standardized measure of biological complexity.
Gene number also differs from the number of gene products. A gene can give rise to several RNA transcripts, and coding transcripts can specify different protein sequences. GENCODE v50 reports 278,455 protein-coding transcripts and 172,117 distinct translations.[1] The translation statistic counts distinct sequences within each gene and sums across genes; it is not a measurement of the proteins present in a particular cell.[3]
The human transcriptome and protein-count guides develop these distinctions. Counting genes describes one level of genome organization; understanding their products also requires knowing which transcripts are expressed, where they are expressed, and how their proteins are processed.