IC50 vs EC50 vs ED50: what each number measures
Three midpoints that look alike and answer different questions

Matic Broz, PhD12 min
What is the difference between IC50 and EC50?
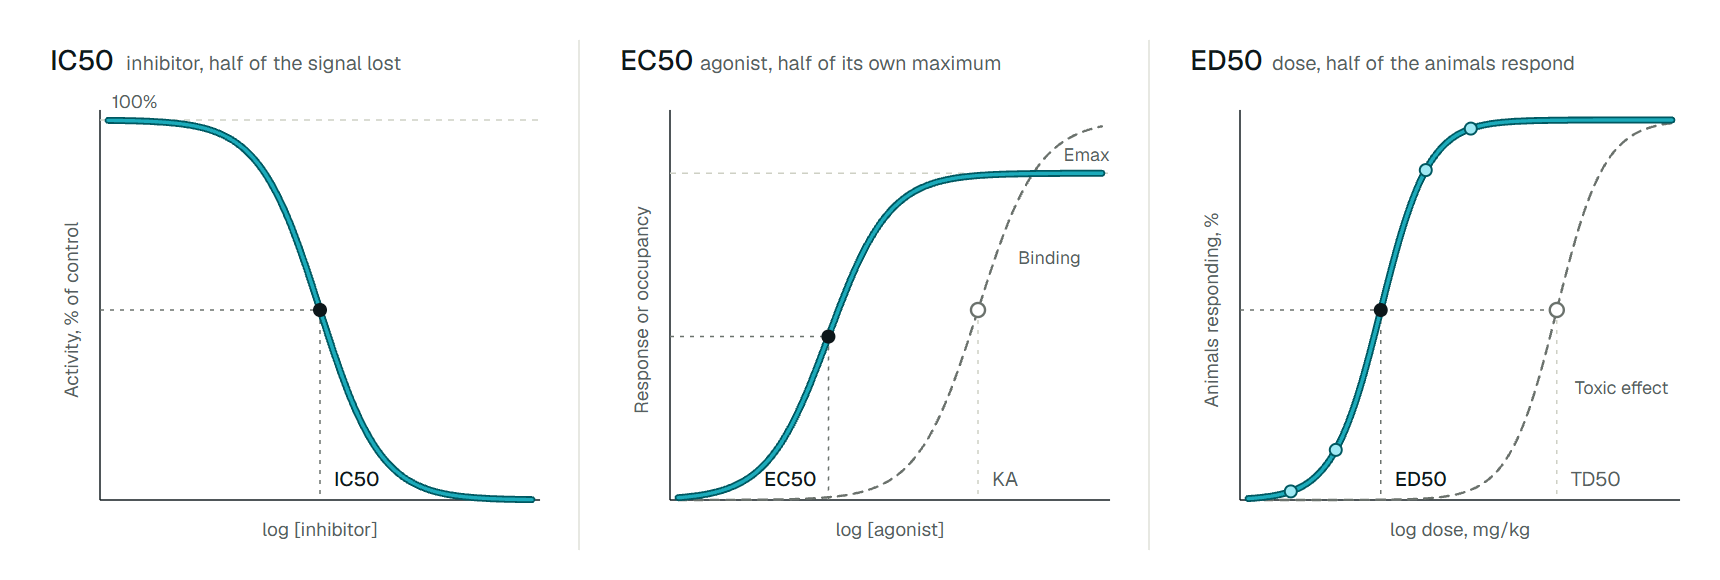
IC50 is the concentration of an inhibitor that reduces a measured response by half. EC50 is the concentration of an agonist that produces half of its own maximal effect. Both are midpoints of a concentration-response curve, both are molar concentrations, and for both lower means more potent. ED50 is a dose rather than a concentration: the amount, usually in mg/kg, that works in half of the animals or patients given it.
The numbers look like properties of a molecule, but they measure a molecule in a system. Jillian Baker found that isoprenaline binds the human β2-adrenoceptor in CHO cells with a KD of 229 nM, yet its EC50 for cAMP in the same cells is 6.0 nM, 38 times lower.[1] Both values are right. The cell amplifies the signal, so a small share of occupied receptors gives half the response.
That is what separates the terms. An IC50 says how much compound halves a signal in one assay. An EC50 adds the agonist's efficacy and the system's amplification to its affinity. An ED50 adds absorption, distribution and the chosen endpoint on top of that.
 IC50 to Ki calculatorConvert an IC50 to pIC50, or to a Ki with the Cheng-Prusoff equation for your assay's substrate concentration.Open tool
One curve gives both numbers
IC50 and EC50 come from the same experiment and the same fit: a response measured across a dilution series, plotted against log concentration and fitted with the four-parameter logistic equation (bottom, top, Hill slope and midpoint). When the curve falls, the midpoint is an IC50; when it rises, an EC50. Some curve-fitting programs call every midpoint an EC50 for that reason.
What differs is what the midpoint is half of. An IC50 is normally half of the uninhibited signal. An EC50 is half of the agonist's own maximum, which may be well below what the system can do: a partial agonist that reaches 30% of the full response has its EC50 at 15%. Two agonists with the same EC50 can therefore differ tenfold in how much response they produce, which is the difference between potency and efficacy.
A Hill slope near 1 fits one compound binding one site. A much steeper or shallower slope points to cooperativity, several sites, aggregation or an assay artefact, and is a reason to distrust the midpoint before comparing it with anything.
Why EC50 is not an affinity
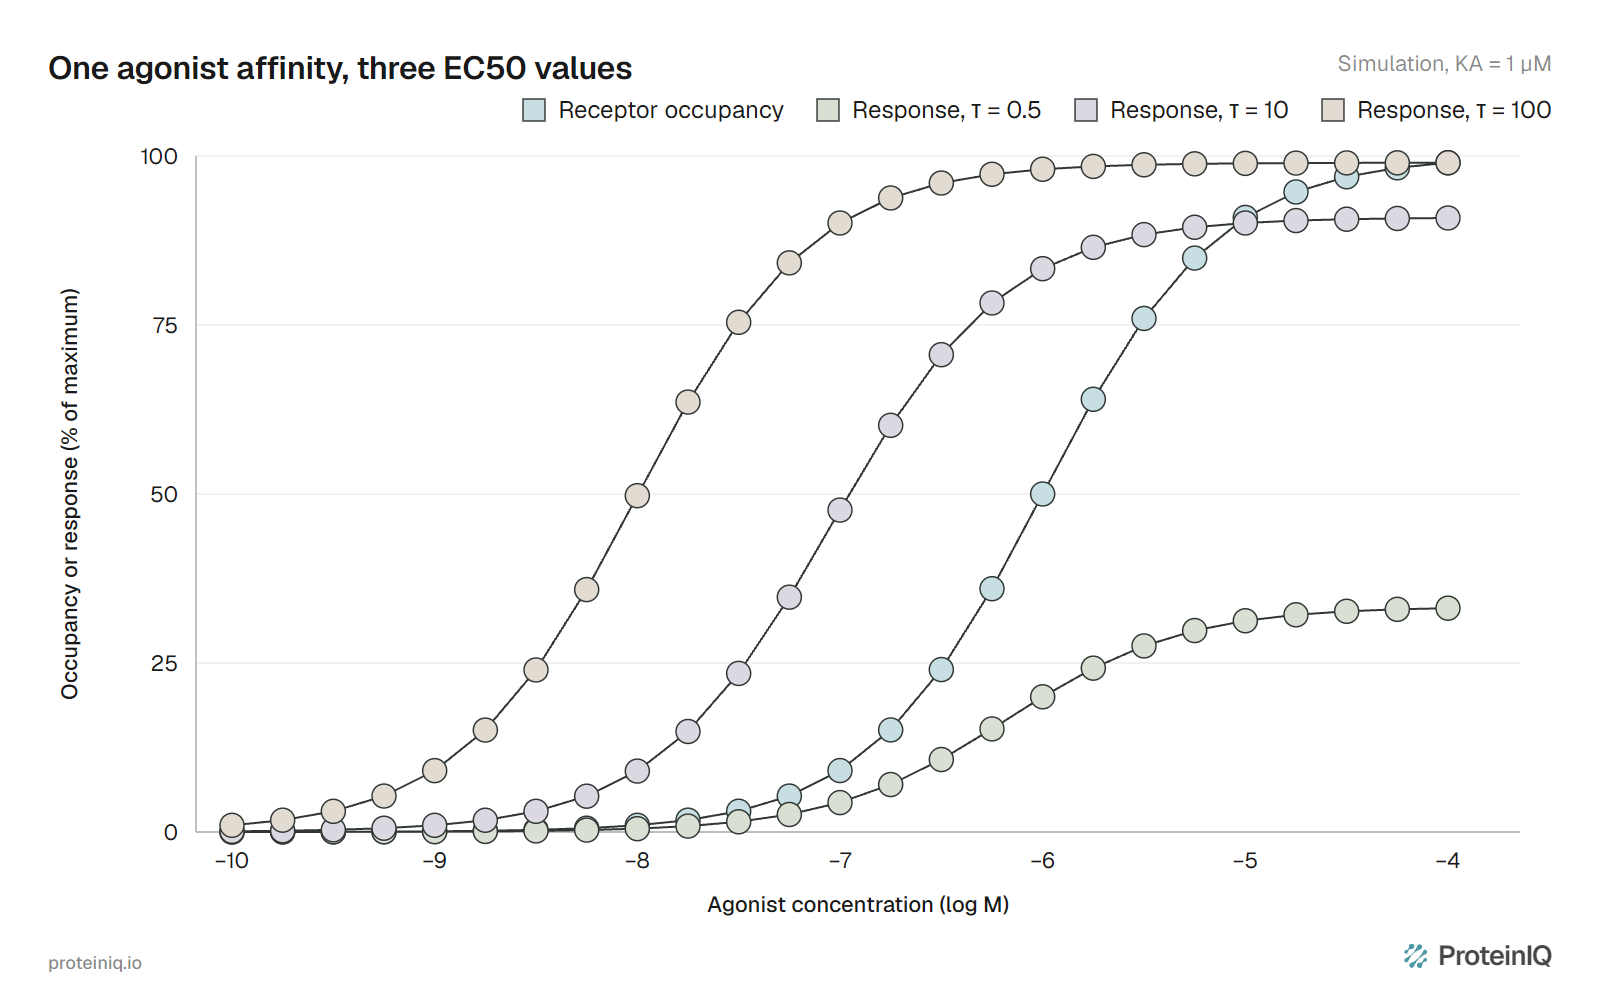
James Black and Paul Leff described agonism with two parameters: KA, the agonist's dissociation constant for the receptor, and τ (tau), the transducer ratio, which grows with receptor number and with how efficiently each occupied receptor drives the response.[3] For a Hill slope of 1 the model gives two short relations:[4]
The first says that an agonist in a system that amplifies its signal has an EC50 below its KA. The second says that once τ is large, the maximum barely moves while the EC50 keeps falling, as Figure 2 shows.
In this model, isoprenaline's 38-fold gap corresponds to τ of about 37 in those CHO cells. The gap varies between agonists: formoterol's EC50 sits 28 times below its KD, salbutamol's 51 times and salmeterol's only 4 times, though all four reach close to the full isoprenaline response.[1]
The spare capacity behind the gap is called receptor reserve. In isolated guinea pig hearts, John Shryock and colleagues inactivated A2A adenosine receptors with an irreversible antagonist and calculated that CGS21680 raised coronary conductance half-maximally with only 1.3% of receptors occupied: an EC50 of 1.5 nM against a KA of 105 nM.[5] In canine trachea, acetylcholine needed 4% of its receptors for a maximal contraction; histamine needed 88%.[6]
The catch is that the reserve belongs to the tissue and the readout, not the compound. In a cell line with fewer receptors, or a readout closer to the receptor, the same agonist's EC50 moves toward its KD, and with a slope other than 1 a weak agonist can even have an EC50 above its KA.[4] An EC50 ranks agonists within one assay; it does not say how tightly any of them bind.
Relative and absolute IC50
An IC50 has its own version of "half of what". Most fits report the relative IC50, the concentration halfway between the fitted top and bottom plateaus. The absolute IC50 is the concentration that brings the response to 50% of control, midway between the 0% and 100% assay controls.[7][8] For an inhibitor that silences the assay completely, the two are the same.
They split when inhibition is partial. We calculated a case: a relative IC50 of 100 nM, a Hill slope of 1 and a floor at 40% activity. The absolute IC50 is 500 nM, five times higher, because the curve must fall most of the way to its floor before it crosses 50%. With a floor at 55%, there is no absolute IC50 at all.
The relative IC50 says how potently the compound does what it can do; the absolute IC50 says how much compound halves the signal. Sebaugh asks for at least two concentrations beyond each bend of the curve before reporting a relative value, and two responses on each side of 50% for an absolute one.[7] A bare "IC50" from a curve that never reaches its floor leaves the reader guessing which was meant.
What an IC50 carries from its assay
An enzyme or binding IC50 carries the substrate or tracer concentration, the enzyme concentration and the incubation time of its assay, which is why the same competitive inhibitor can show an IC50 a hundred times its Ki. In a functional assay, an antagonist's IC50 also depends on which agonist was used, at what multiple of its EC50, so a functional IC50 inherits everything that moves the agonist's curve.
Worked example with salbutamol at the β2 receptor
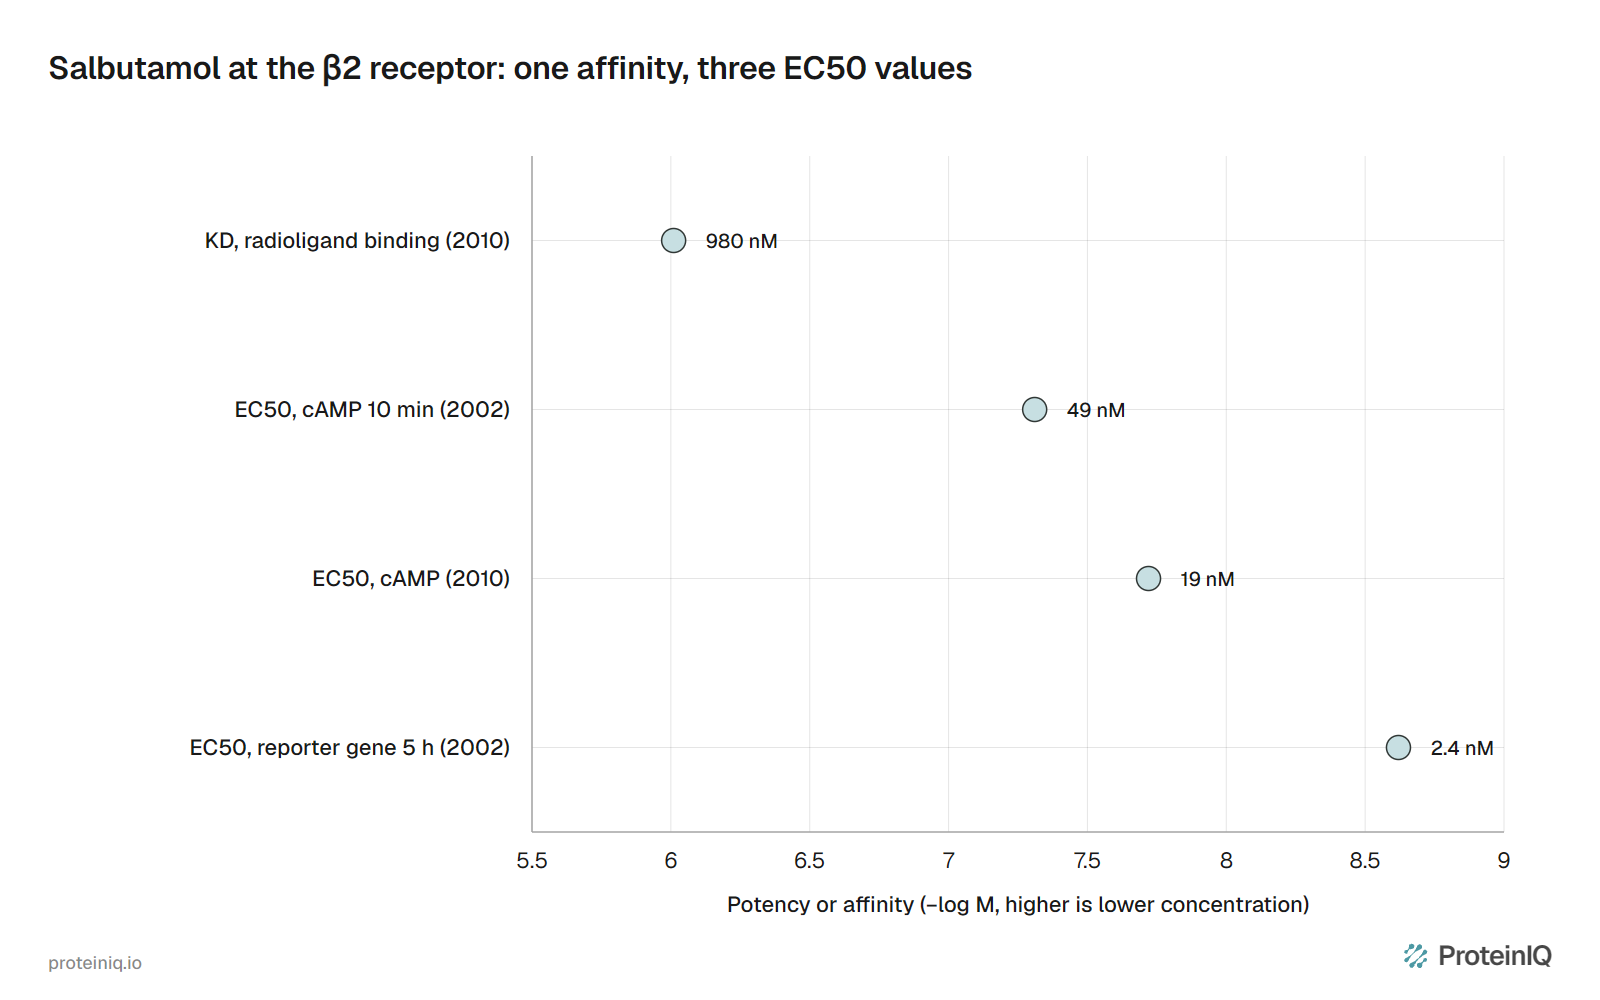
Salbutamol, the bronchodilator in many asthma inhalers, was measured in two studies from one group using the same CHO cell line, which expresses the human β2-adrenoceptor at 466 fmol/mg protein. Figure 3 puts its binding constant and three EC50 values from those cells on one axis.
Within each study the gap is large. In the 2010 study, salbutamol's cAMP EC50 of 19 nM sits 51 times below its KD of 980 nM.[1] In the 2002 study, moving the readout from cAMP at 10 minutes to a reporter gene at 5 hours lowered its EC50 20-fold, from 49 nM to 2.4 nM, and raised its maximum from 87% to 102% of the isoprenaline response.[2] A readout further down the cascade, given longer to accumulate, collected more amplification, and salbutamol looked both more potent and more efficacious.
Isoprenaline went the other way in the same comparison: its reporter EC50 was about four times higher than its cAMP EC50, which the authors read as receptor desensitization during the long incubation.[2] A longer assay does not always give a lower EC50; it gives a number that also records what the cell did with the signal.
So keep each EC50 with its readout. Salbutamol's affinity for the receptor is about 1 µM, and its potency is anywhere from about 50 nM to 2 nM depending on what you measure. Comparing it with a compound measured in another readout tells you about the assays as much as about the molecules.
EC50 vs ED50
An ED50 is measured in a whole organism and given as a dose, usually in mg/kg, with the species, route and time of measurement. It inherits everything an EC50 depends on and adds pharmacokinetics: absorption, distribution, clearance and how much drug reaches the receptor unbound. Without those data there is no conversion from an EC50 in nM to an ED50 in mg/kg.
The term comes from quantal experiments, where each animal either responds or does not. J. W. Trevan introduced the median lethal dose, the LD50, in 1927 because the dose that kills half of a group can be estimated far more reproducibly than a "minimal lethal dose".[9] Litchfield and Wilcoxon's 1949 method for fitting such data, with confidence limits on the median dose, became the standard way to estimate ED50 values.[10]
ED50 is now also used for graded responses, the dose giving half of the maximal effect, so the methods should say which is meant. Like an EC50, it belongs to its endpoint. In a mouse model of chemotherapy-induced nerve pain, graded dose-response curves gave intraperitoneal morphine an ED50 of 6.7 mg/kg against sensitivity to touch and 12.5 mg/kg against sensitivity to cold, and nine days of repeated morphine raised its tail-flick ED50 about 18-fold as the mice became tolerant.[11]
Dividing the median dose for a toxic effect (TD50) or for death (LD50) by the ED50 gives the therapeutic index. The ratio assumes the two curves have similar slopes. If the toxicity curve is shallower, its lower tail can harm a few animals at doses where most are not yet treated.
Which number should you report?
The right number depends on the question it will answer. Table 1 pairs common questions with the number to report and the check to run before comparing it.
| Question | Report | Check before comparing |
|---|---|---|
| How potent is this inhibitor in my assay? | IC50 or pIC50 | Substrate or tracer concentration, enzyme concentration, incubation time, whether the curve reaches its floor |
| How tightly does it bind the target? | Ki or KD | Mechanism and Km for a Cheng-Prusoff conversion, or a direct binding method |
| How potent is this agonist? | EC50 or pEC50 with Emax | Same cell line, receptor level, readout and time point as the comparator |
| Is this a full or partial agonist? | Emax relative to a reference full agonist | A system with little receptor reserve, where partial agonism is not hidden |
| Does it work in the animal, and at what dose? | ED50 with species, route, time and endpoint | Exposure measurements, and a TD50 or LD50 from the same species and route |
Whatever the number, average and compare it on the log scale. A pEC50 or pIC50 is the negative base-10 logarithm of the molar value, so isoprenaline's EC50 of 6.0 nM is a pEC50 of 8.22, and averaging log values gives the geometric mean that matches how assay errors behave.
IC50 and potency tools on ProteinIQ
Measured IC50 values go into the converter first. To estimate potency before anything is measured, the Boltz models predict it from a protein-ligand complex.
- IC50 to Ki calculator: convert IC50 to pIC50 and back, and apply Cheng-Prusoff for competitive, noncompetitive, uncompetitive or radioligand displacement assays
- Boltz-2: predict a protein-ligand complex with an affinity value reported as log10 of an IC50 in µM
- LMI4Boltz: run the same affinity prediction on complexes too large for standard Boltz-2
Frequently asked questions
Can you convert an IC50 into an EC50?
No. They come from different experiments: an IC50 from an inhibitor lowering a signal, an EC50 from an agonist raising one. An inhibitor's IC50 can be converted to a Ki through the Cheng-Prusoff equation, and an agonist's EC50 relates to its KA only through a model such as EC50 = KA/(1 + τ), which needs the efficacy τ.[4]
What is the therapeutic index?
It is the ratio of the median toxic dose (TD50) or median lethal dose (LD50) to the median effective dose (ED50), measured in the same species by the same route. A larger ratio means a wider margin, but only if the two dose-response curves have similar slopes.
Is a lower EC50 better?
A lower EC50 means a more potent agonist in that assay. It says nothing about how large the maximal effect is: in a system with large receptor reserve, a partial agonist can have a low EC50 and still produce less response than a full agonist.
Can an EC50 be lower than the Kd?
Yes, and for an agonist in a system that amplifies its signal it usually is. The operational model gives EC50 = KA/(1 + τ), so the gap grows with receptor number and coupling efficiency, and in tissues with large receptor reserve it can reach about 70-fold.[4][5]