TPM vs FPKM vs RPKM
Three expression units that differ by one order of operations

Matic Broz, PhD10 min
What is the difference between TPM, FPKM and RPKM?
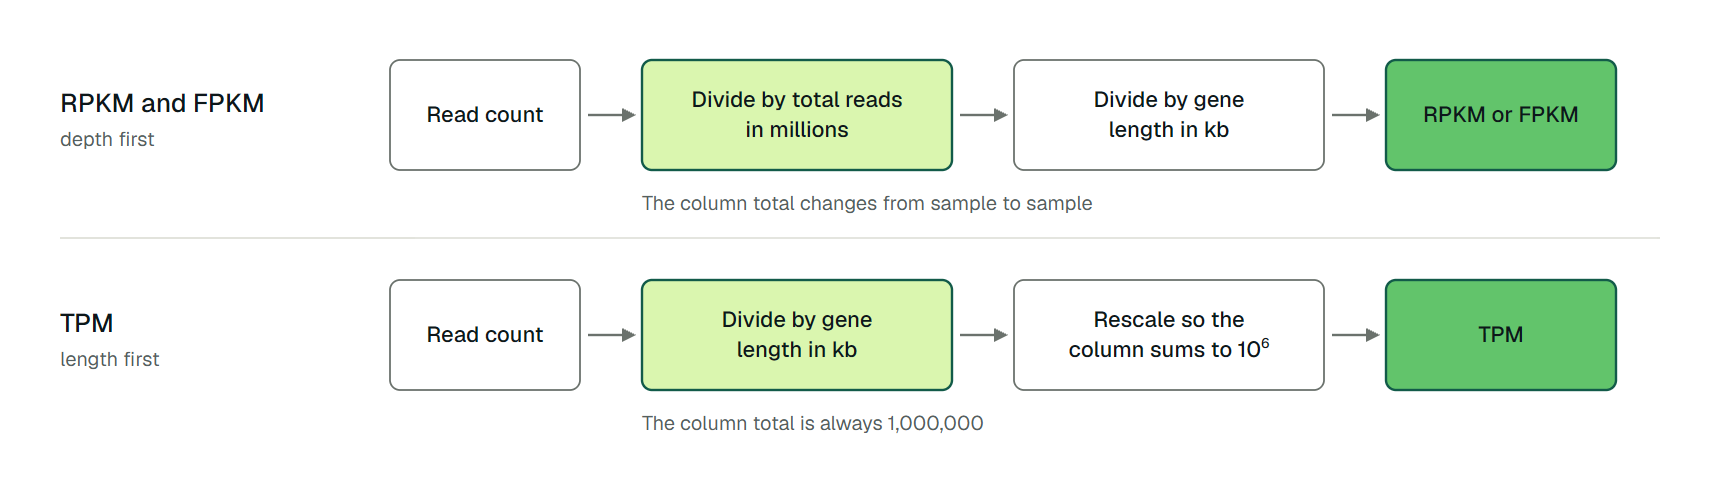
All three turn the reads that land on a gene into an expression level from the same ingredients: the read count, the gene's length and the sequencing depth (the total reads in the sample). RPKM and FPKM divide by depth first, so every sample's column adds up to a different total. TPM divides by length first, so every column adds up to exactly one million.
That fixed total makes TPM look comparable between samples, and often it is not. In a GTEx whole-blood sample examined by Zhao and colleagues, three globin genes made up 81.8% of the sequenced transcripts. Removing globin RNA before sequencing would raise the TPM of every other gene about fivefold, without a single molecule of those genes being gained.[6]
So the choice turns on two things: what a value is a share of, which the order of operations decides, and what question it has to answer. A gene at 10 TPM is 10 of every million transcripts in its own sample; a gene at 10 FPKM carries no such guarantee. Neither is what a differential expression test wants, because those tests start from raw counts.

How RPKM, FPKM and TPM are calculated
RPKM, reads per kilobase of transcript per million mapped reads, was introduced by Mortazavi and colleagues in 2008.[1] It divides each gene's read count by the total number of mapped reads, in millions, and then by the gene's length in kilobases:
Here is the read count for gene , is its length in bases and is the total number of mapped reads in the sample. The factor combines the "per million" and "per kilobase" scalings.
FPKM, fragments per kilobase of transcript per million mapped fragments, applies the same formula to fragments. Paired-end sequencing reads both ends of each cDNA fragment, so counting reads would count one molecule twice. Trapnell and colleagues defined FPKM for Cufflinks so that a pair of reads counts as one fragment.[2] For single-end data, FPKM and RPKM are the same number, and the names are often used interchangeably.
TPM, transcripts per million, appears in the RSEM paper by Li and Dewey and was argued for by Wagner and colleagues.[3][4] It first divides each count by gene length, then rescales so the length-corrected values sum to one million:
The sum runs over every gene in the sample. Pachter showed that RPKM and FPKM are each a scalar multiple of the estimated relative abundance of a transcript, which is the quantity TPM reports per million.[5] Both families are rescalings of the same length-corrected rates, and the conversion follows directly from the two definitions:
Converting FPKM to TPM is therefore a one-line operation on a table of FPKM values from a single sample. The reverse needs the original read totals, which a TPM table does not carry.
Why TPM sums to one million and FPKM does not
Look at what is left after each recipe. TPM divides by length first and then rescales by the sum of those length-corrected counts, so the output has to add up to by construction. RPKM divides by the total read count , which is a property of the sequencing run and not of the transcripts, so nothing forces the output to add up to a fixed number.
Wagner and colleagues made this the center of their critique. RPKM is meant to estimate an RNA's relative molar concentration, they argue, and such a quantity should have the same average over genes in every sample. RPKM does not, so one RPKM value means a different share of the transcripts in two samples.[4] In TPM the average is fixed at one million divided by the number of annotated transcripts.[6]
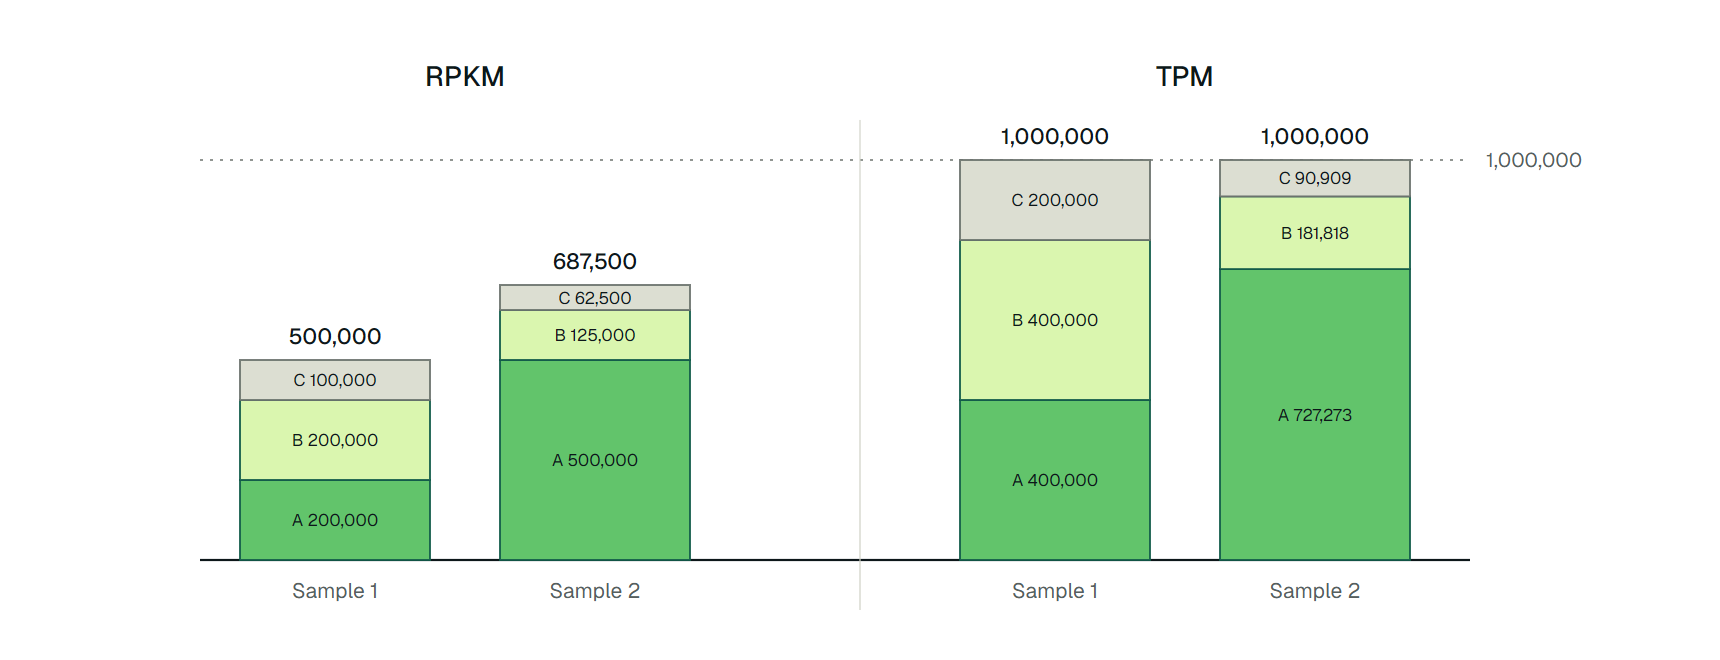
A small example shows the effect. Take three genes of 1, 2 and 4 kb in two samples, each with exactly 1,000,000 mapped reads, so the "per million" scaling is the same in both. The only difference is where the reads land: sample 1 sends 20% of reads to the 1 kb gene, sample 2 sends 50%. We calculated every value in Table 1 by hand and checked it with a short script; Figure 2 draws the same numbers as stacked bars.
| Gene | Length | Sample 1 reads | Sample 1 RPKM | Sample 1 TPM | Sample 2 reads | Sample 2 RPKM | Sample 2 TPM |
|---|---|---|---|---|---|---|---|
| A | 1 kb | 200,000 | 200,000 | 400,000 | 500,000 | 500,000 | 727,273 |
| B | 2 kb | 400,000 | 200,000 | 400,000 | 250,000 | 125,000 | 181,818 |
| C | 4 kb | 400,000 | 100,000 | 200,000 | 250,000 | 62,500 | 90,909 |
| Sum | 1,000,000 | 500,000 | 1,000,000 | 1,000,000 | 687,500 | 1,000,000 |
Gene A reads 200,000 RPKM in one sample and 500,000 in the other, but the columns sum to 500,000 and 687,500, so its share of the transcripts is hidden until you add them up. In TPM, A is plainly 40% of the transcripts in sample 1 and 72.7% in sample 2. The RPKM total moves because a read from a short gene stands for more transcripts than a read from a long one, and sample 2 sends more reads to the short gene.
What TPM, FPKM and RPKM do not correct
TPM fixes the sum, not the sample. It is still a relative measure: each value is a share of whatever RNA was sequenced. Zhao and colleagues show that this makes cross-sample comparison fragile when the RNA populations differ, for example between poly(A) selection and rRNA depletion, two ways of enriching messenger RNA before sequencing.[6]
The blood sample at the top of this page is the extreme case. With three globin genes taking 81.8% of the transcripts, every other gene shares less than a fifth of the million, so its TPM moves with how much globin the protocol removed, not only with its own expression.[6]
Robinson and Oshlack describe the same composition problem for counts: a few very abundant genes in one sample change the apparent expression of all the others, so an estimate of sequencing depth based on total reads is biased.[7] Scaling by total mapped reads, as RPKM, FPKM and TPM all effectively do, inherits that bias.
Estimation is a separate issue. A read that maps to several isoforms or genes can be assigned to only one of them in a simple count, which is why counting reads per gene and dividing is a crude version of what quantifiers do. RSEM and Salmon assign such reads probabilistically and report expected counts together with TPM, so a TPM recomputed from simple per-gene counts has already lost that step.[3][8]
Which unit should you use?
Within one sample, TPM is the safer way to say how a gene compares with other genes, because its value is a fraction of the sequenced transcripts. Ranking genes in a library, plotting a gene set and reading off the dominant isoforms are all such questions; TPM and FPKM rank genes identically there, and TPM is easier to read. Salmon's documentation recommends TPM as the relative abundance measure for downstream analysis.[9]
Across samples, Zhao and colleagues accept TPM for qualitative work such as clustering and principal component analysis (PCA) when the libraries were prepared alike, but not for quantitative comparisons when the total RNA content or its composition differs.[6]
Differential expression needs raw counts. The DESeq2 documentation states that its input matrix should contain un-normalized counts, because only counts let the model judge how precise each measurement is, and the model corrects for library size itself.[10][11] edgeR works the same way, scaling counts with the TMM factors of Robinson and Oshlack.[7]
When counts come from a transcript quantifier, Soneson and colleagues showed that transcript-level estimates can be summarized to gene level and passed to count-based tools, either as a count matrix or with length offsets, and that this improves gene-level inference compared with simple counting.[12] Table 2 sorts the common questions by the unit to start from.
| Question | Start with | Check |
|---|---|---|
| Which genes are highest in one sample? | TPM | Whether globin, rRNA or mitochondrial reads dominate |
| What share of transcripts is one gene? | TPM | Annotation used, since the denominator is every annotated transcript |
| Cluster or PCA across samples | TPM, log-transformed, same protocol | Library prep and RNA selection are the same |
| Is a gene differentially expressed? | Raw or estimated counts in DESeq2 or edgeR | Replicates, and a count matrix rather than TPM |
| Compare against an older paper reporting FPKM | Convert FPKM to TPM within each sample | Same annotation and same library type |
One habit avoids most of the trouble: store counts, and compute TPM from them as a convenience column, never the other way round. A TPM table cannot be turned back into counts, because it no longer carries the library size.
RNA-seq quantification on ProteinIQ
Quantification comes first, since it produces both the counts and the TPM column. Because a quantifier divides the million among the transcripts in its reference, a FASTA missing part of the human transcriptome changes every TPM value in the sample.
- Salmon: quantify transcripts from a transcript FASTA and reads, with the length, effective length, TPM and estimated number of reads per transcript[9]
Frequently asked questions
Are FPKM and RPKM the same?
For single-end data, yes: both divide the count by gene length and total counts in millions. FPKM counts fragments, so it avoids counting the two reads of a paired-end fragment twice.[2]
Is TPM better than FPKM?
For describing one sample, yes. TPM sums to one million in every sample, whereas the average RPKM varies from sample to sample, which makes its values hard to read as shares of the transcripts.[4] Neither is a substitute for counts in a differential expression test.
Can I compare TPM across samples?
Only with care. TPM is relative, so a different RNA composition between samples, from the protocol or the tissue, changes every value.[6] It is reasonable for clustering when samples are prepared alike.
How do I convert FPKM to TPM?
Divide each gene's FPKM by the sum of FPKM in the same sample and multiply by one million. The conversion is done sample by sample, and it works because FPKM and TPM are both rescalings of the same relative abundance.[5]
What should I use for differential expression?
Raw or estimated counts with DESeq2 or edgeR, which model library size themselves.[10][11] Salmon's estimated counts work too once they are summarized to genes, either with a length offset or as a length-scaled count matrix.[12]