Peptide mass fingerprinting and peptide mapping explained
Naming a protein from masses, or confirming one you already know

Matic Broz, PhD16 min
What is peptide mass fingerprinting?
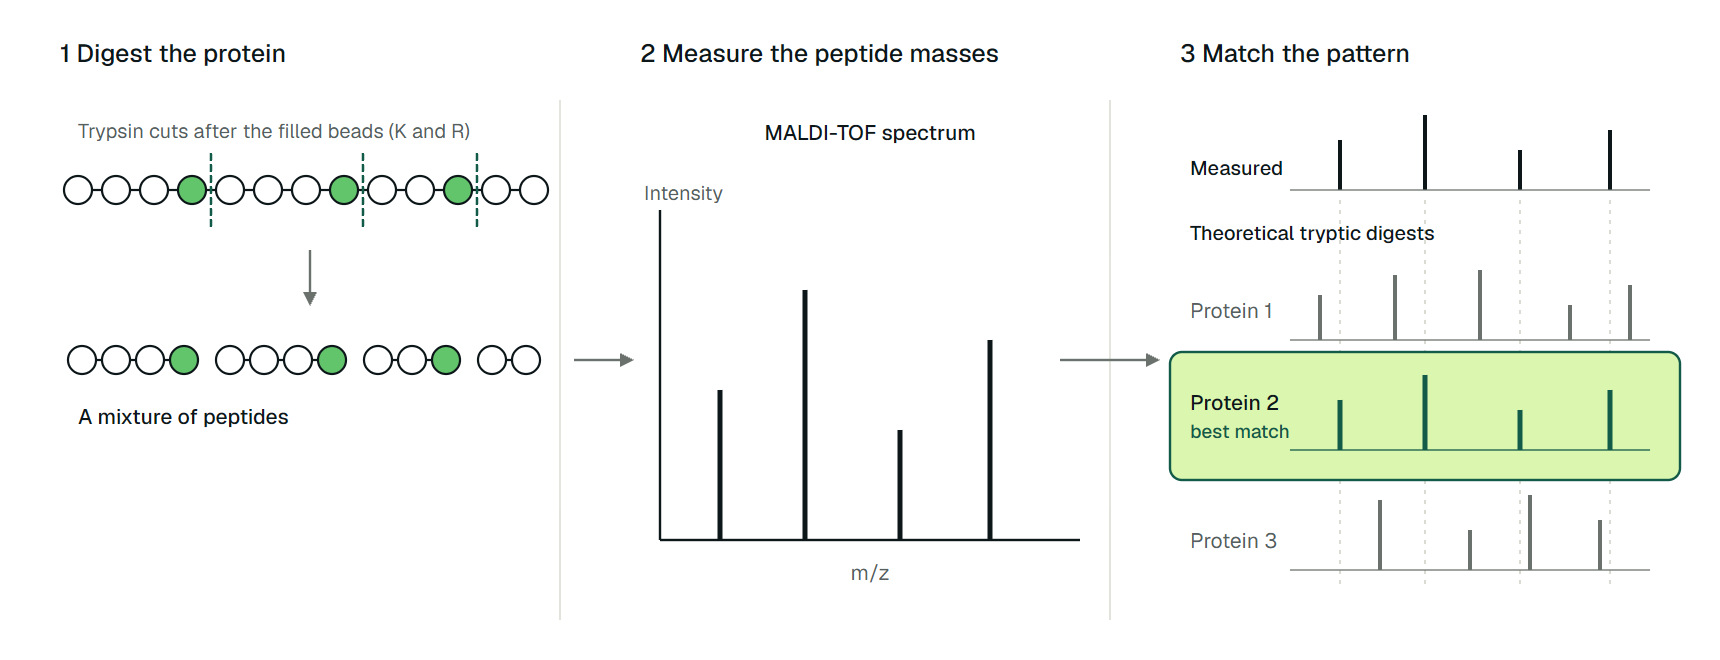
Peptide mass fingerprinting (PMF) identifies a protein without reading its sequence. The protein is cut with a protease that has a known cleavage rule, usually trypsin, the masses of the resulting peptides are measured, and a search program looks for the database protein whose theoretical digest best explains that list of masses.
Three numbers can be enough. Henzel and colleagues digested ten spots cut from a two-dimensional gel of an E. coli extract and measured the unfractionated digests by MALDI mass spectrometry. With as few as three peptide masses, each protein was uniquely identified among more than 91,000 sequences, and Edman sequencing of the same spots confirmed every identification.[1]
Yet a mass is not a sequence. Many different peptides weigh the same to within the error of the instrument, so a match is circumstantial evidence. Its strength rests on how tightly the masses are measured and how many of them fit, and a window wide enough to forgive a poor calibration also forgives a mass entered in the wrong convention.
The method also has a close relative with the opposite goal. In biopharma, peptide mapping digests a protein whose sequence is already known and checks that the observed peptides reproduce it. The chemistry is the same; the question is not.
 Match peptide masses to a protein sequencePaste a sequence and your measured neutral masses to see which tryptic peptides they match.Open tool
How the method began in 1993
PMF appeared in 1993 from five laboratories at once. Henzel and colleagues searched a database with peptide masses from gel spots.[1] Pappin, Højrup and Bleasby gave the approach its name, "peptide-mass fingerprinting", in their title.[2] James and colleagues called the list of masses a "mass profile" that acts as a fingerprint.[4]
Mann, Højrup and Roepstorff concluded that four to six proteolytic peptides measured with a mass accuracy between 0.1% and 0.01% allow a useful search of a database like the Protein Identification Resource.[3] Yates and colleagues identified proteins from observed masses covering less than half of the predicted tryptic peptides, using a tolerance of 1 atomic mass unit.[5]
The enabling instrument was MALDI-TOF. Karas and Hillenkamp showed in 1988 that laser desorption ionization could produce ions of proteins above 10,000 Da, and the same soft ionization handles a peptide digest in a single spectrum.[6] Yates's group generated their masses by microcapillary liquid chromatography with electrospray ionization instead.[5]
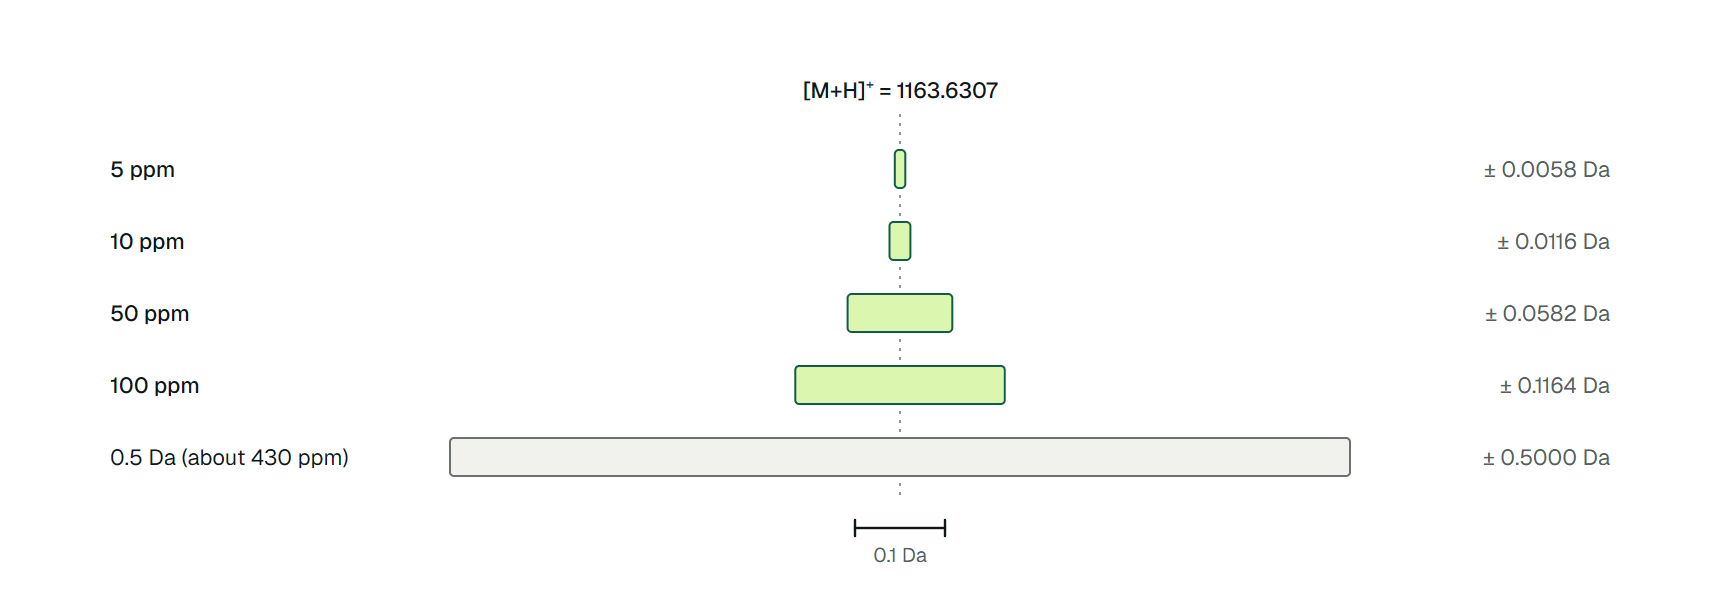
Two of those numbers are worth converting. Mann's 0.1% is 1000 ppm, and Yates's 1 u window is about 860 ppm for a peptide of mass 1163.6. Both windows are roughly a hundred times wider than the 10 ppm window in Figure 3 below, and a window that wide can hide a mistake as well as admit a coincidence.
From a sequence to a peptide mass
To search a database, the program has to turn every protein sequence into the peaks you would expect to see. That takes three steps: cut the sequence, add up the residue masses, and convert the neutral mass into the ion that the spectrometer detects.
The digest rule
Trypsin cleaves after lysine (K) and arginine (R), except when the next residue is proline. Olsen, Ong and Mann tested this with the sub-ppm mass accuracy of an ion trap Fourier transform instrument and found that trypsin cleaves solely at the C-terminal side of K and R. Non-tryptic peptides turned up only at the C-terminus of proteins and as breakup products of tryptic peptides with an internal proline.[7]
A program that applies the rule, such as Peptide Cutter, therefore produces the expected peptide boundaries for a clean digest. Real digests are less tidy. A site can be skipped, giving a peptide that spans one or more uncleaved K or R (a missed cleavage). Search programs allow a small number of them, and the Mascot documentation advises setting the number empirically by running a standard and seeing which value scores best.[8]
Adding up the mass
The monoisotopic mass of a peptide is the sum of its residue masses plus one water, which stands for the N-terminal hydrogen and the C-terminal hydroxyl:
A MALDI spectrum shows singly protonated ions, so the peak sits at , where the proton mass is 1.007276 Da.[9] Mascot's own advice is that PMF data from MALDI normally arrive as values.[8]
We worked this out for LVNELTEFAK, a tryptic peptide at residues 66 to 75 of the precursor sequence of bovine serum albumin (BSA, UniProt P02769), the standard digest Mascot suggests for setting search parameters.[8] Each residue mass below is the sum of its elemental composition, using the monoisotopic masses of H, C, N, O and S tabulated by Unimod.[10] We checked the sums with a short script.
| Term | Count | Mass each (Da) | Subtotal (Da) |
|---|---|---|---|
| Leucine (L) | 2 | 113.0841 | 226.1681 |
| Valine (V) | 1 | 99.0684 | 99.0684 |
| Asparagine (N) | 1 | 114.0429 | 114.0429 |
| Glutamic acid (E) | 2 | 129.0426 | 258.0852 |
| Threonine (T) | 1 | 101.0477 | 101.0477 |
| Phenylalanine (F) | 1 | 147.0684 | 147.0684 |
| Alanine (A) | 1 | 71.0371 | 71.0371 |
| Lysine (K) | 1 | 128.0950 | 128.0950 |
| Sum of residues | 10 | 1144.6128 | |
| Add water (H2O) | 1 | 18.0106 | 1162.6234 |
| Add proton, giving | 1 | 1.0073 | 1163.6307 |
The peak to look for is therefore at m/z 1163.6307. Peptide mass does this calculation for every peptide in a digest, including fixed carbamidomethyl cysteine and optional methionine oxidation, and reports either neutral masses or m/z values.
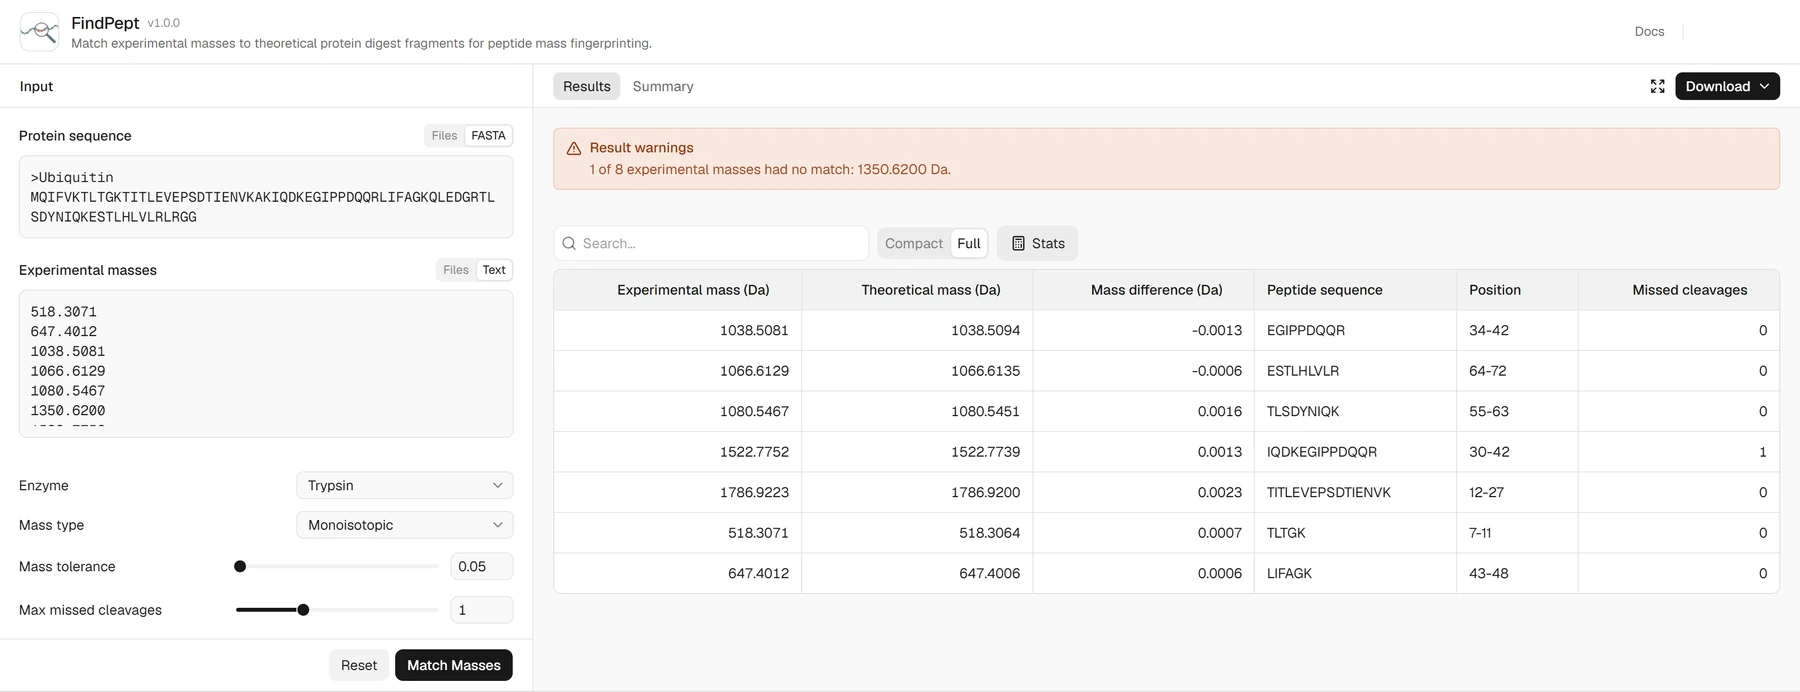
For a protein you already suspect, FindPept runs the comparison the other way: you paste the sequence and your measured masses, and it lists which peptides, at which positions, match. FindPept takes neutral masses, so subtract the proton mass from each peak first.
To try it, open FindPept and load its ubiquitin example, which fills the sequence box with the 76-residue protein and the masses box with eight neutral masses. Leave the enzyme on trypsin and the mass type on monoisotopic, set the tolerance in daltons (the example uses 0.05) and the missed cleavages to 1, then click Match Masses.
In the Results table, each row pairs a measured mass with the peptide it matches, its position in the sequence, the difference in daltons and the number of missed cleavages; a mass that matches nothing is listed in the warning above the table.
Mass tolerance decides what counts as a match
A match is a difference between an observed and a theoretical mass that is smaller than the tolerance you allow. Instrument accuracy is quoted in parts per million, and converting it to daltons shows how much room a search is leaving. For the peptide above, 10 ppm is a window of ±0.0116 Da, and FindPept's default of 0.5 Da, the only unit it takes, is about 430 ppm (Figure 3).
A 0.5 Da window suits a single known protein, where there are few candidates to confuse, and it is far too loose for a search over a whole database. A looser window lets more unrelated peptides fall inside it by chance, and a tighter one only helps if the instrument is calibrated well enough that the true peptides stay inside it.
Mascot's advice is practical rather than theoretical. Run a standard such as a BSA digest, read the mass errors for the correct protein, ignore outliers because those are chance matches, add a safety margin, and use that as the tolerance.[8]
Mascot also says that more peptides count for more than precision: 20 mass values at modest accuracy give a better score than 5 at very high accuracy, and the long peptides of 1000 to 3500 Da contribute the most because they are unlikely to occur in several proteins.[8]
A modification moves a peptide far outside every window above. Oxidation of methionine adds one oxygen, 15.9949 Da, so an oxidized peptide is invisible to a search that does not allow for it. Mascot's guidance is to allow no more than two variable modifications and notes that the usual one is methionine oxidation.[8]
How a score is made
Scoring turns the matches into a probability. Perkins and colleagues described the probability-based approach behind Mascot, in which a simple rule judges whether a result is significant and so guards against false positives.[11]
Mascot reports the score as , where is the probability that the observed match is random, and corrects it for the number of database entries searched into an expect value. A hit counts as significant when its expect value is below 0.05, which is a 5% chance of being a false match.[12][8]
Other engines weigh evidence differently. ProFound uses a Bayesian algorithm and reports that it identifies the correct protein even when data quality is low or the sample is a simple mixture of proteins.[13] MS-Fit in UCSF Protein Prospector is another long-standing search form.[14] Whichever engine you use, the score is only as good as the tolerance and the mass convention fed into it.
One peak, four tolerances
A single peak shows how the window changes the answer. Take the LVNELTEFAK peak at m/z 1163.6307 from Table 1 and paste it into FindPept as measured, forgetting that FindPept wants neutral masses. The entered value sits 1.0073 Da, about 866 ppm, above the true neutral mass of 1162.6234 (our calculation from Table 1).
What the search says next depends only on the tolerance. At 10 ppm (±0.0116 Da) and at the 0.05 Da of the ubiquitin example, LVNELTEFAK fails to match, and so does every other peak entered the same way. At FindPept's 0.5 Da default it still fails, because a proton is twice the window. At Yates's 1 u window it misses by 0.0073 Da.
At the looser end of Mann's range, 0.1% or ±1.16 Da, it matches. The search then reports the right peptide from a number that is wrong by a whole proton, and the error is invisible in the result.
The catch is that a wide window does not only admit chance matches; it also hides systematic errors. A tight window turns the same mistake into a run of misses all offset by about +1.007 Da, which is the cue to check whether the masses are neutral or before blaming the sample.
Why shotgun proteomics replaced it for most work
For a purified protein, PMF is quick. For anything else, a list of peptide masses stops being enough. It cannot identify post-translational modifications: Mascot's help states that this requires MS/MS, because each variable modification multiplies the number of candidate peptides to test.[8]
In a mixture every protein contributes peaks to the same list. ProFound was designed to cope with simple mixtures,[13] but a tandem mass spectrum belongs to one peptide, which avoids the problem. A larger database also dilutes significance. Mascot notes that Swiss-Prot is small because it is non-redundant, which makes a significant match easier to get, and that organisms poorly represented there force a search of much larger databases.[8]
Tandem mass spectrometry answered all three. Eng, McCormack and Yates matched an uninterpreted fragmentation spectrum of a single peptide to sequences in a database, which gives the search sequence-level evidence instead of one number per peptide.[15] Coupling multidimensional liquid chromatography to tandem MS (MudPIT) then separated a complex digest and acquired tandem mass spectra for thousands of peptides.[16]
Aebersold and Mann's 2003 review describes the result, mass spectrometry-based proteomics, as indispensable for proteome-wide identification and quantification from complex samples.[17] For a mixture, the question became which peptides each fragmentation spectrum supports, not which protein a mass list fits best.
Peptide mapping asks the opposite question
Peptide mapping in biopharma starts from the answer. The sequence of the product is known from the gene, and the experiment tests whether the protein you made matches it and which sites carry modifications.
The ICH Q6B guideline describes the peptide map as selective fragmentation of the product into discrete peptides, analyzed by HPLC or another appropriate procedure and identified by amino acid composition, N-terminal sequencing or mass spectrometry. It adds that peptide mapping with a validated procedure is frequently used to confirm the desired structure for lot release.[18]
The measured output is therefore sequence coverage and site-specific information, not a database rank. Mouchahoir and Schiel describe peptide mapping as a tool for identity confirmation and for monitoring degradation such as oxidation or deamidation. The catch, they point out, is that the conditions that give efficient reduction, alkylation and digestion are often the ones that induce artificial modifications.
Their paper optimizes a tryptic digest for the NISTmAb, a reference monoclonal antibody, to balance the two.[19] Table 2 sets peptide mapping beside fingerprinting and shotgun proteomics, with the check to run before trusting each.
| Approach | Starting point | Result | Check before trusting it |
|---|---|---|---|
| Peptide mass fingerprinting | Unknown protein, ideally purified | A ranked database hit from a list of peptide masses | Expect value below 0.05; contaminants included in the search; tolerance set from a standard |
| Peptide mapping (biopharma) | Known sequence from the gene | Sequence coverage and modification sites against that sequence | Validated procedure; digestion conditions that do not add artifacts[18][19] |
| LC-MS/MS shotgun proteomics | Complex mixture | Many proteins, each from fragmentation spectra of its peptides | A false discovery rate set by a decoy search[12] |
Where PMF still fits
The conditions that favor PMF are the ones Mascot lists: a purified protein, a well-characterized organism in a small database, and a standard run to set parameters.[8] That describes a spot cut from a gel and a quick identity check, which is how the method started.[1] Always include a database of common contaminants, since otherwise you might report that a sample is human serum albumin when it is really BSA.[8]
MALDI-TOF is also used to identify microbes, but this is a related idea rather than the same one. Singhal and colleagues describe identifying microbes from intact cells or cell extracts by MALDI-TOF.[20] The sample is the intact cells or an extract of them, not one purified protein that has been digested into peptides.
Peptide mass fingerprinting tools on ProteinIQ
The tools are used in this order: cut the protein in silico, calculate the masses, then compare them with your list. None of them searches a protein database or scores a hit; FindPept compares masses against the one sequence you provide.
- Peptide Cutter: find where a protease would cut a sequence
- Peptide mass: calculate peptide masses and m/z values for a digest, with cysteine alkylation and methionine oxidation
- FindPept: match measured neutral masses to the peptides of one protein, with sequence positions and coverage
- Molecular weight: calculate the molecular weight of an intact protein or peptide
 Calculate the masses of a tryptic digestNeutral masses or [M+H]+ m/z values for every peptide, with optional methionine oxidation.Open tool
Frequently asked questions
What is peptide mass fingerprinting?
It is a way to identify a protein from the masses of the peptides produced when a protease digests it. A search program compares the measured masses with the theoretical digest of every protein in a database. In the first demonstration, as few as three peptide masses were enough to identify each of ten E. coli gel spots among more than 91,000 sequences.[1]
How many peptides do you need for a reliable match?
There is no fixed number, because significance depends on mass accuracy, the size of the database and the peptides themselves. In 1993 Mann and colleagues estimated that four to six peptides measured at 0.1% to 0.01% accuracy were enough for a useful search.[3] Modern engines express reliability as an expect value, with a hit counting as significant below 0.05.[12]
What is the difference between peptide mass fingerprinting and peptide mapping?
Fingerprinting uses peptide masses to find out which protein you have. Peptide mapping starts from a known sequence and checks that the product matches it and where it is modified. ICH Q6B describes peptide mapping as frequently used to confirm the desired product structure for lot release.[18]
Why is peptide mass fingerprinting not used for complex mixtures?
Every protein in the sample adds peaks, a mass list cannot identify post-translational modifications, and large databases make a significant match harder. Mascot's help states that PTMs cannot be identified by PMF and that this requires MS/MS.[8]
Does trypsin always cleave after K and R?
Trypsin cleaves C-terminal to lysine and arginine, and Olsen and colleagues found that it does so solely at those residues. Non-tryptic peptides appeared only at protein C-termini and as breakup products of tryptic peptides with an internal proline.[7] A real digest can still leave sites uncleaved, which is why searches allow missed cleavages.[8]