mBER and ColabDesign metrics explained
What each column in a VHH binder result means

Matic Broz, PhD11 min
A finished mBER job against PD-L1 returns one accepted VHH and nine other evaluated candidates, each with a row of numbers. The accepted row reads iPTM 0.759, pLDDT 0.928, pTM 0.834, PAE 0.153, Interface PAE 0.145, Seq Entropy 2.713, ESM Score -27.839 and Relaxed Energy -6249.4. In the result files the same columns are called i_ptm, plddt, ptm, pae, i_pae, seq_ent, esm_score and relaxed_energy.
Those numbers do not share a scale or a direction. Two are fractions of 31 Å, one is a sum of log-probabilities that is always negative, one is a force-field energy, and one is identical in every row. Only i_ptm and plddt decide whether a design is accepted; the rest help you rank candidates and spot odd ones.[2] This guide covers each column, how it is computed in the pinned mBER and ColabDesign code, and the cutoffs people apply.
Every column at a glance
mBER writes accepted.csv with the sequence plus i_ptm, plddt and ptm. The other columns come from the per-trajectory evaluation record, which is why they appear in the ProteinIQ Data tab and in the downloaded files but not in the CSV.[2]
| Column | Shown as | Scale | Better | What it measures |
|---|---|---|---|---|
i_ptm | iPTM | 0 to 1 | Higher | Whether the binder sits correctly on the target, from the AlphaFold-Multimer interface TM-score. Acceptance filter |
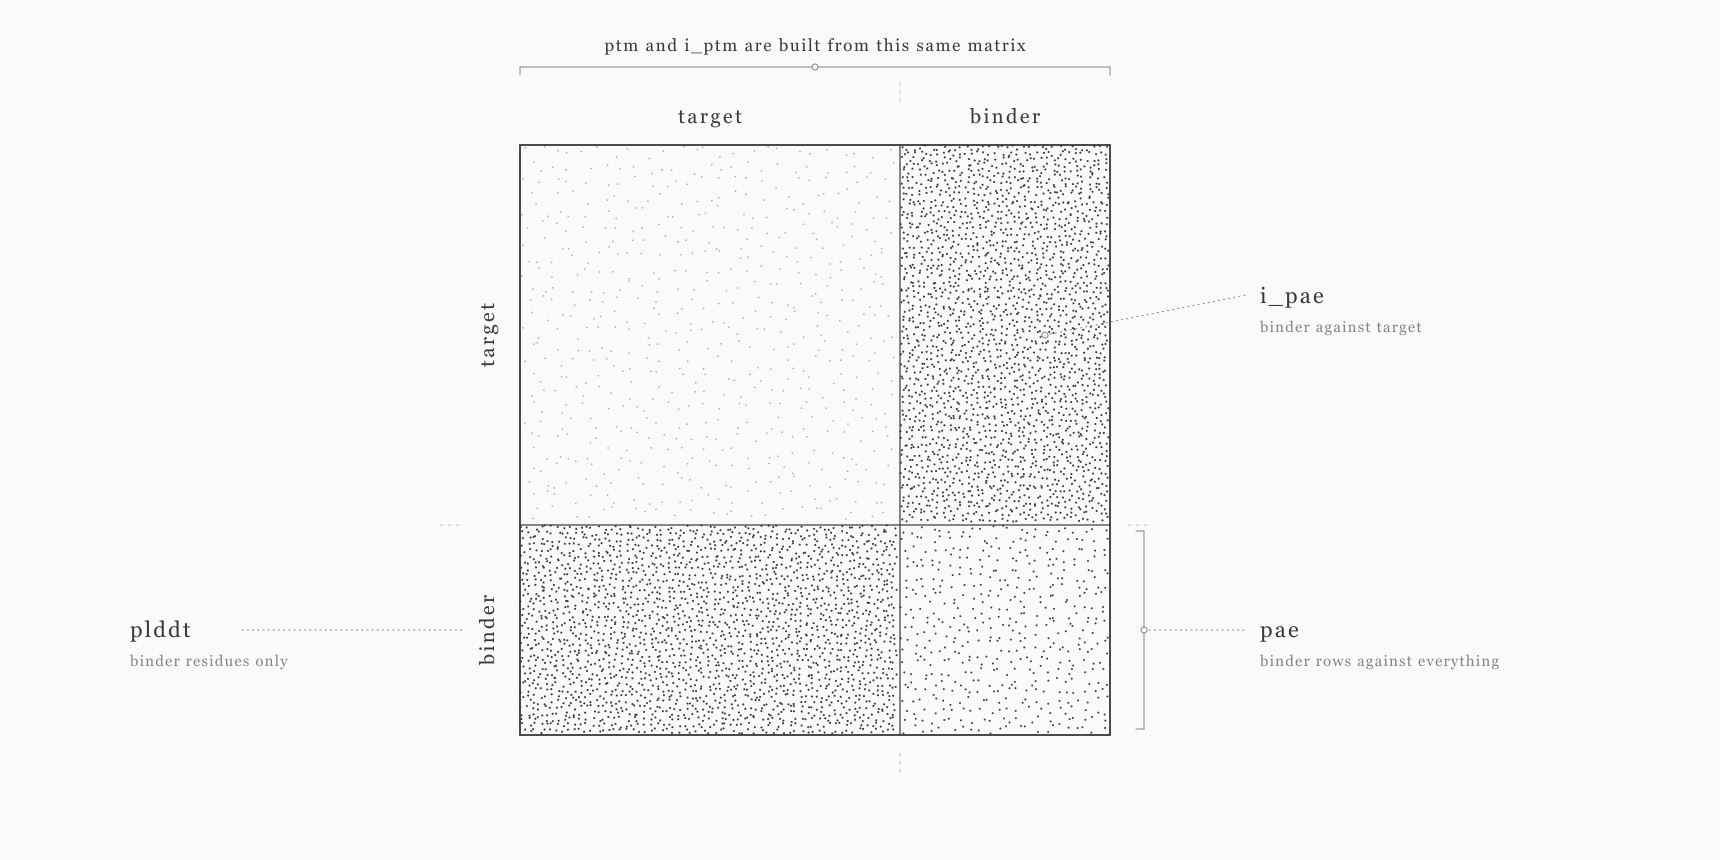
plddt | pLDDT | 0 to 1 | Higher | Mean per-residue confidence over the binder residues only. Acceptance filter |
ptm | pTM | 0 to 1 | Higher | Predicted TM-score of the whole complex, dominated by the target |
pae | PAE | 0 to 1, times 31 for Å | Lower | Mean predicted error for pairs that involve a binder residue |
i_pae | Interface PAE | 0 to 1, times 31 for Å | Lower | Mean predicted error between binder and hotspot residues on the target |
seq_ent | Seq Entropy | nats | None | Entropy of the sequence the model was given; constant at evaluation |
esm_score | ESM Score | at most 0 | Closer to 0 | Summed ESM-2 log-likelihood of the binder sequence |
relaxed_energy | Relaxed Energy | kcal/mol | Lower, within one run | AMBER potential energy of the relaxed complex |
The evaluation record also keeps unrelaxed_energy and relax_rmsd, the energy before relaxation and how far relaxation moved the atoms. They are not shown as columns.[2]
Where the numbers come from
mBER builds on ColabDesign. Each trajectory optimizes a VHH sequence by backpropagating through AlphaFold-Multimer parameter sets 1 to 4, then the final sequence is predicted again with set 0 and three recycles.[1][2]
That single re-prediction is the source of i_ptm, plddt, ptm, pae, i_pae and seq_ent. The complex is then relaxed with AMBER, the binder is folded alone with ESMFold for the monomer PDB, and ESM-2 scores the sequence.[2]
Reporting scores from a parameter set that was not used during optimization means the optimizer never pushed on that model directly. It does not remove the blind spots the AlphaFold models share, which is why an independent check matters (see the last section).
ColabDesign's own log carries plddt, ptm, i_ptm, pae, i_pae and seq_ent with the definitions below. It has no esm_score; mBER adds that one.[2][3]
ipTM and pTM
i_ptm is the AlphaFold-Multimer interface score. It is the predicted TM-score computed only over residue pairs in different chains, so it asks whether the binder is placed correctly against the target and ignores how well each chain is folded.[4] ptm is the same calculation over every pair, which makes it a statement about the whole complex.
A large target dominates ptm, so a mediocre interface can still leave it high. The ipTM vs pTM guide explains the calculation and the usual 0.8 and 0.6 reading bands.
In the example job the two move together: ptm ranges from 0.834 to 0.860 while i_ptm ranges from 0.759 to 0.799. Treat i_ptm as the interface score and ptm as a sanity check that the target was not distorted.
pLDDT
plddt is the mean of AlphaFold's per-residue confidence, taken over the binder residues only. ColabDesign stores it as a loss (one minus the confidence), and the log flips it back, so the value you see is a 0 to 1 confidence where higher is better.[3] Multiply by 100 to compare it with the familiar 0 to 100 scale of the pLDDT guide.
Because the average excludes the target, a binder can score 0.93 and still sit in the wrong place. pLDDT says the VHH fold is confident; i_ptm and i_pae say whether it is docked correctly.
PAE and interface PAE
Predicted aligned error is the model's expected position error, in ångströms, for one residue when the structure is aligned on another. ColabDesign divides it by 31 Å, the top of the PAE range, so mBER reports a fraction.[3][5] The interface PAE of 0.145 in the example is about 4.5 Å, and the best candidate's 0.121 is about 3.8 Å.
The two columns average different parts of the matrix. pae covers every pair that involves a binder residue, so it includes the binder against itself and against the target.
i_pae covers binder residues against the hotspot residues only, which are either the ones you supplied or the ones mBER picks automatically from the target surface.[2][3] A narrow hotspot therefore changes what i_pae means, and values from runs with different hotspots are not comparable.
The PAE guide shows how to read the full matrix; mBER keeps only these two averages, not the matrix.
ESM score
esm_score is the sum, over every residue of the binder, of the log-probability that ESM-2 (650M parameters) assigns to the residue that is actually there. The sequence goes in unmasked, so the model sees every residue it is scoring.[2][6] Each term is at most zero, so the total is negative: closer to zero means the language model finds the sequence more natural, and a very negative score marks an unusual sequence.
Two properties follow from the code. It is a sum, not an average, so longer sequences score lower and comparisons only make sense among binders of similar length, which holds across VHH designs built on one framework.
And because the input is unmasked, differences are small: the ten example candidates span only -28.1 to -26.3. mBER does not filter on it. The authors use ESM-2 as a sequence prior during design, and the preprint gives no ESM cutoff.[1] Use it to flag a candidate that is much worse than its siblings, not to rank near-ties.
Sequence entropy
During design, seq_ent is a regularizer that rewards a sequence for committing to one amino acid per position, and a lower value means a sharper commitment.[3] At evaluation the sequence is fixed, so the entropy is computed from the same encoding for every binder. The example job reports 2.713 in all ten rows, and nothing in the column separates candidates.
Relaxed energy
relaxed_energy is the AMBER potential energy, in kcal/mol, of the whole predicted complex after relaxation.[2] The target contributes almost all of it, which is why the example values sit near -6300 whatever the binder does. Compare it only among candidates against the same target prepared in the same run, and treat a candidate far above its siblings as a strained or clashing pose. It is not a binding energy.
Cutoffs used in practice
Cutoffs come from different models, so they are not interchangeable. The mBER defaults are the ones to start with for VHH design; the others show where neighbouring methods put the line.
| Source | Metric and cutoff | Note |
|---|---|---|
| mBER default, CLI and ProteinIQ | i_ptm at least 0.75, plddt at least 0.70 | Sliders allow 0.50 to 0.95 for each[2] |
| mBER preprint | ipTM above 0.66 for the second library; analyses at above 0.7 and above 0.8 | Binder pLDDT performed comparably to or worse than ipTM at predicting hits[1] |
| BindCraft default filters | pLDDT at least 0.8, pTM at least 0.55, i_pTM at least 0.5, i_pAE at most 0.35 | Averaged over several AF2 models, for miniprotein binders[8] |
| Bennett et al. 2023 | pAE_interaction below 10 Å | Roughly 0.32 on the 0 to 1 scale; AF2 initial-guess filter[9] |
| Overath et al. 2025 | AF3 ipSAE_min above 0.61 | Cutoff that maximized F1; AF2 initial-guess interface PAE was the weakest interface metric[10] |
BindCraft inherits ColabDesign's scaling, so its i_pAE cutoff of 0.35 corresponds to roughly 11 Å. The Bennett cutoff of 10 Å is slightly stricter, so the two agree more than the raw numbers suggest.[8][9]
Each of these is a filter on model confidence, not a probability of binding. In the mBER screen, the authors report binding to specific epitopes for as many as 38% of a filtered set of designs, and design success against 45% of the 145 screened targets, so most designs that pass the filters still do not bind.[1] Even the best metric in the meta-analysis performed very differently from one target to the next.[10]
How the metrics relate
All of i_ptm, ptm, pae and i_pae come from the same predicted-error head, so they rise and fall together by construction. plddt comes from a separate per-residue head, and esm_score, seq_ent and the energies come from entirely different calculations. The ten candidates from the example job show the pattern.
| Binder | iPTM | Interface PAE | pLDDT | ESM score | Relaxed energy |
|---|---|---|---|---|---|
| 0 | 0.759 | 0.145 | 0.928 | -27.839 | -6249.4 |
| 1 | 0.782 | 0.131 | 0.939 | -28.055 | -6297.1 |
| 2 | 0.788 | 0.131 | 0.932 | -27.553 | -6353.1 |
| 3 | 0.795 | 0.128 | 0.934 | -27.561 | -6310.1 |
| 4 | 0.780 | 0.135 | 0.932 | -27.042 | -6368.7 |
| 5 | 0.762 | 0.143 | 0.928 | -27.549 | -6265.7 |
| 6 | 0.793 | 0.125 | 0.936 | -26.521 | -6372.9 |
| 7 | 0.761 | 0.142 | 0.933 | -28.094 | -6325.6 |
| 8 | 0.796 | 0.128 | 0.934 | -27.868 | -6372.3 |
| 9 | 0.799 | 0.121 | 0.941 | -26.316 | -6352.3 |
iPTM and interface PAE order the candidates almost identically (Spearman correlation -0.95), and pTM follows iPTM closely (0.96). pLDDT tracks them more loosely (0.73). ESM score (0.39) and relaxed energy (-0.56) move only loosely with them, so they add a separate check. Ten rows from one trajectory only illustrate the pattern; they do not establish how strongly the columns correlate across targets.
Candidates that are good on one family and poor on another deserve a closer look. High i_ptm with a very negative esm_score can mean a docked but unusual sequence, and high plddt with high i_pae means a well-folded VHH with an uncertain pose.
Reading a result in practice
Sort by i_ptm and i_pae together, then confirm that plddt is comfortably above the filter and that ptm has not dropped. Drop any candidate whose esm_score or relaxed_energy is an outlier among its siblings. Then open the structure: the VHH should contact the hotspot you intended, with CDR loops, not framework, making the contacts.
The scores come from one AlphaFold-Multimer parameter set, and the design loop was built around the same model family, so the most useful next step is an independent prediction.
Predict the designed complex with Boltz-2 or AlphaFold2 and score the interface with ipSAE, which the meta-analysis found to be the strongest single predictor of binding, then compare the pose.[10] The ipSAE guide and the guide to judging a predicted structure cover the reading in more detail. Nothing here replaces expression and binding assays.
These metrics on ProteinIQ
| Tool | What it reports |
|---|---|
| mBER | i_ptm, plddt, ptm, pae, i_pae, seq_ent, esm_score and relaxed energy for each VHH candidate, with accepted and below-threshold rows |
| BindCraft | The same ColabDesign confidence metrics for miniprotein binders, with its own filters |
| ipSAE | Rescores an AlphaFold or Boltz prediction of the designed complex |
| AlphaFold2, Boltz-2 | Independent re-prediction of a designed binder-target complex |