TL;DR
- TAP2 takes paired VH and kappa or lambda VL sequences, builds an ABodyBuilder2 model, and calculates five structure-informed descriptors.
- It reports total IMGT CDR length, PSH, PPC, PNC, and SFvCSP.
- Flags compare values with 664 clinical-stage therapeutics from the fixed 2023 reference set; they are not pass-or-fail predictions.
- ProteinIQ independently reconstructed TAP2 and exactly reproduced all 3,320 released structure-conditioned reference values.
TAP2 profiles an antibody variable fragment against five properties observed across clinical-stage therapeutics. To use it online, enter one complete heavy-chain variable domain (VH) and one complete kappa or lambda light-chain variable domain (VL). ProteinIQ builds an ABodyBuilder2 model, calculates the five TAP2 metrics, and returns the structure, flags, residue-level evidence, and downloadable reports.[1]
For a first run:
Open TAP2 online
Open TAP2.
Add the paired variable domains
Enter one complete VH sequence and one complete kappa or lambda VL sequence. Remove signal peptides, constant regions, gaps, stops, and ambiguous residues.
Submit the sequences
TAP2 has no scientific settings, so the paired sequences determine the run.
Review all five properties
Read the values and flags together, inspect the modeled CDRs, and repeat scores that sit near a reference boundary.
Validate each alert
Confirm flagged risks with orthogonal assays before making a development decision.
The flags are not pass-or-fail criteria. They show whether the modeled property is central or unusual relative to the fixed 664-antibody reference set published with TAP2. A red flag identifies a reason to investigate; it does not demonstrate aggregation, poor expression, high viscosity, or clinical failure.[2][8]
What is TAP2?
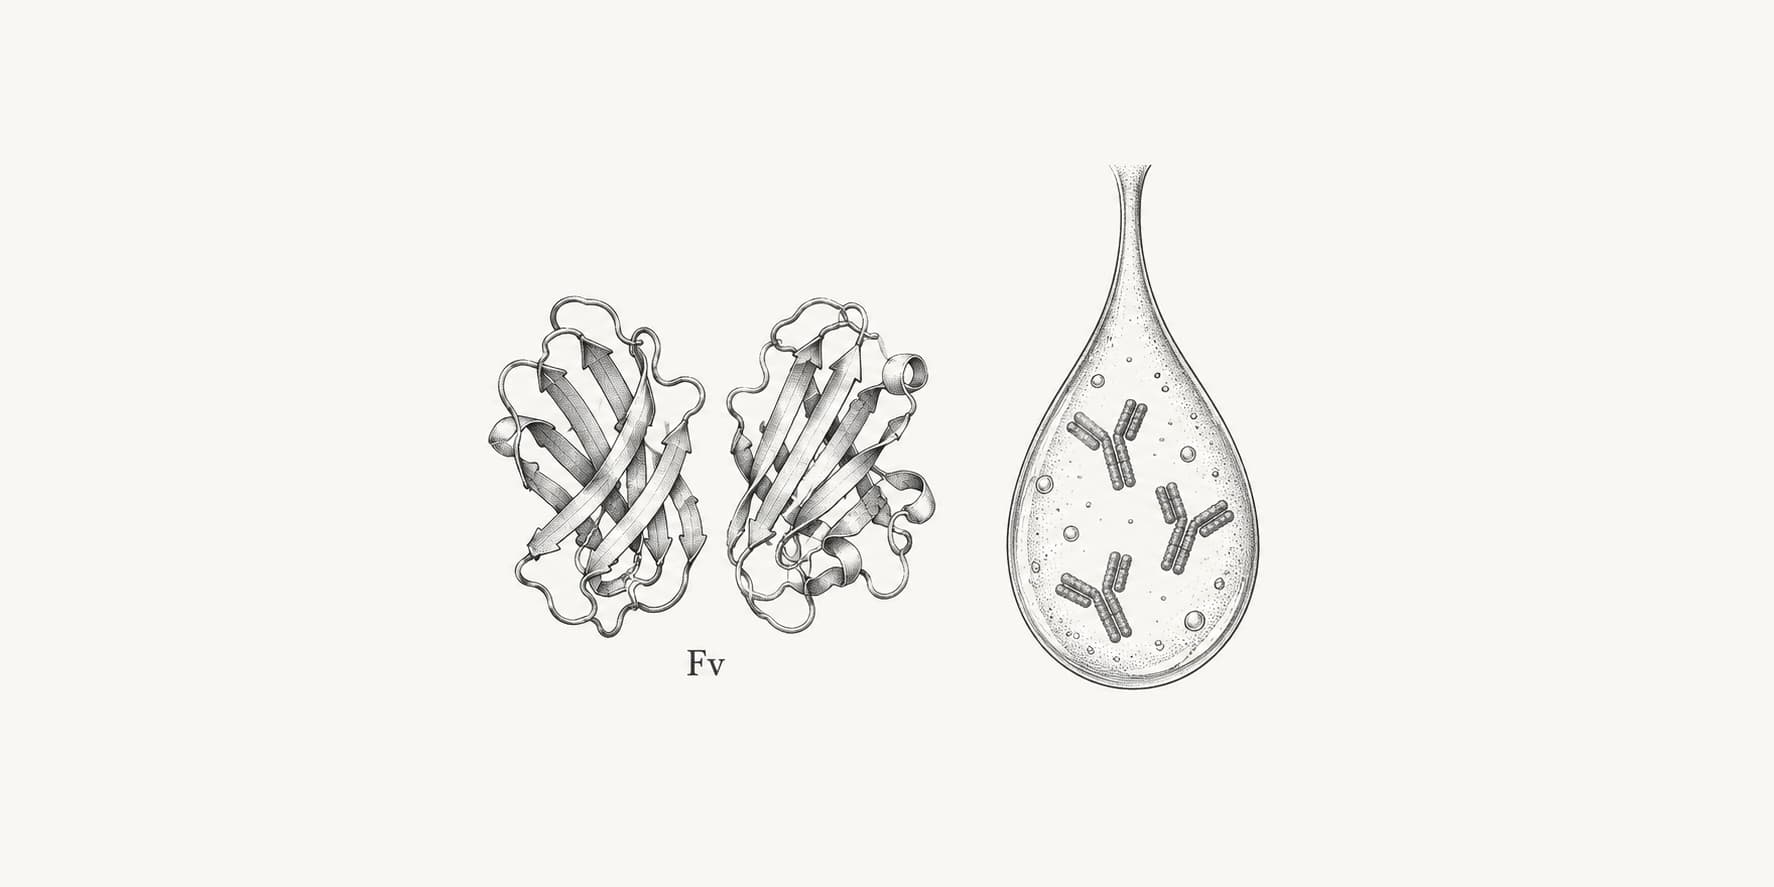
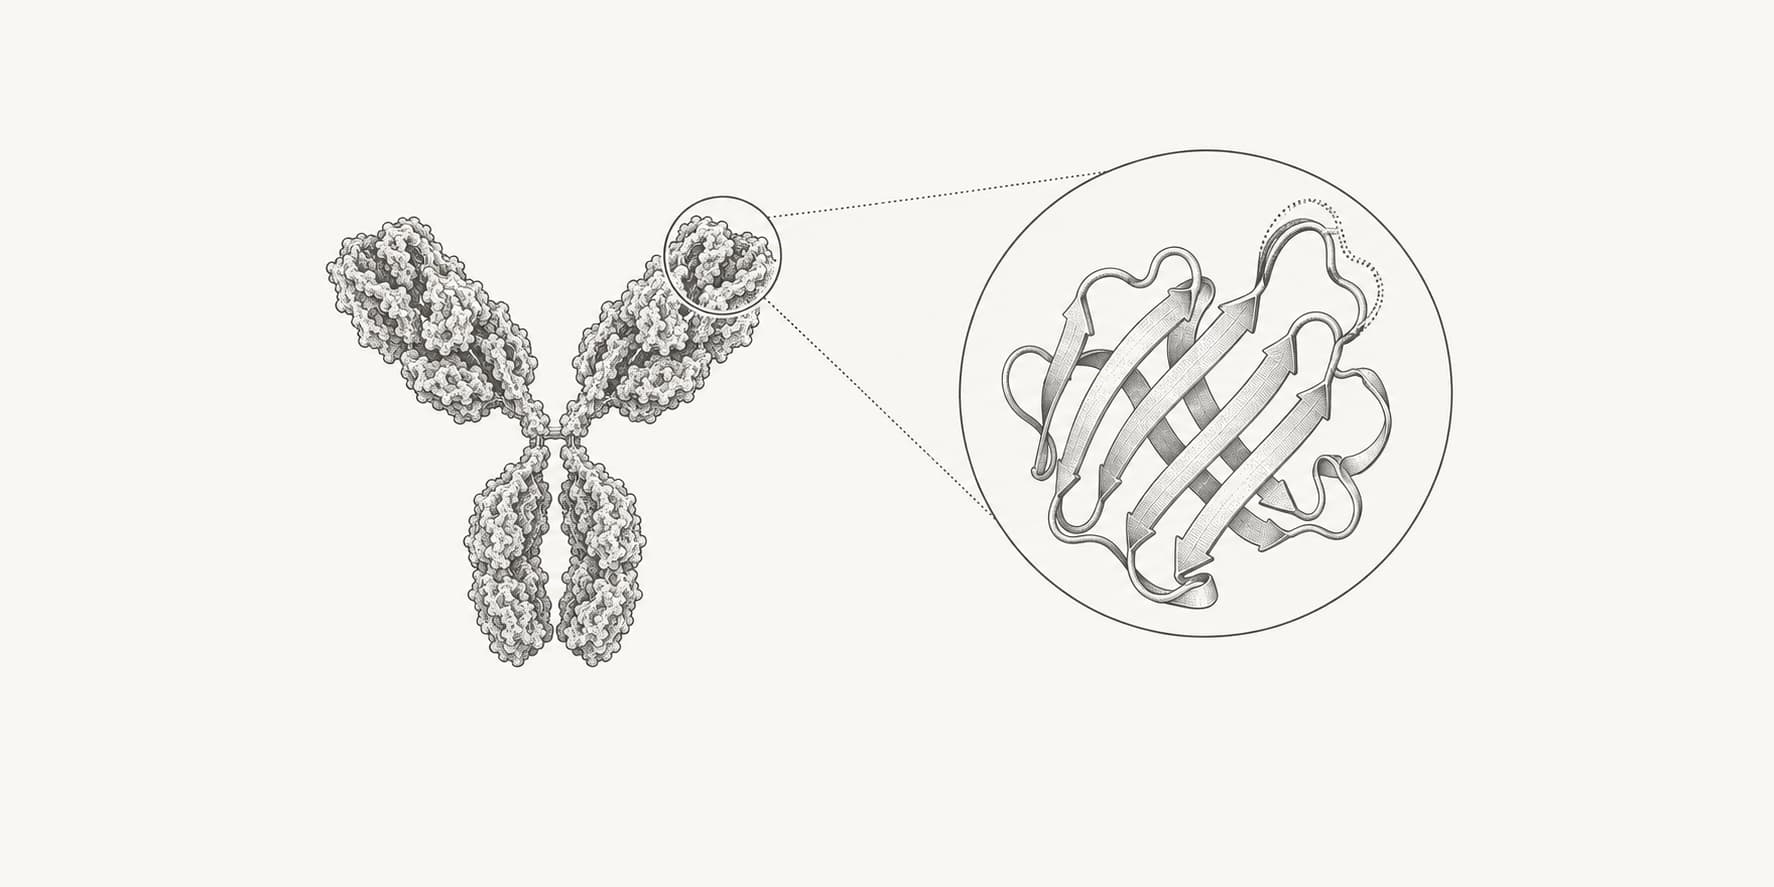
TAP2, or Therapeutic Antibody Profiler 2, is a structure-informed framework for contextualizing antibody developability risk. It compares a candidate with nonredundant therapeutic Fv regions that had progressed beyond phase I. The 2024 study expanded the original TAP analysis to 664 clinical-stage therapeutics collected by January 25, 2023, included both kappa and lambda light chains, and replaced ABodyBuilder with ABodyBuilder2.[2]
TAP2 reports five descriptors:
| Metric | Full name or scope | What it captures |
|---|---|---|
| Total CDR length | Combined length of all six IMGT CDRs | Whether the candidate has unusually short or long antigen-binding loops |
| PSH | Patches of surface hydrophobicity | The size and connectivity of hydrophobic patches around the modeled CDR surface |
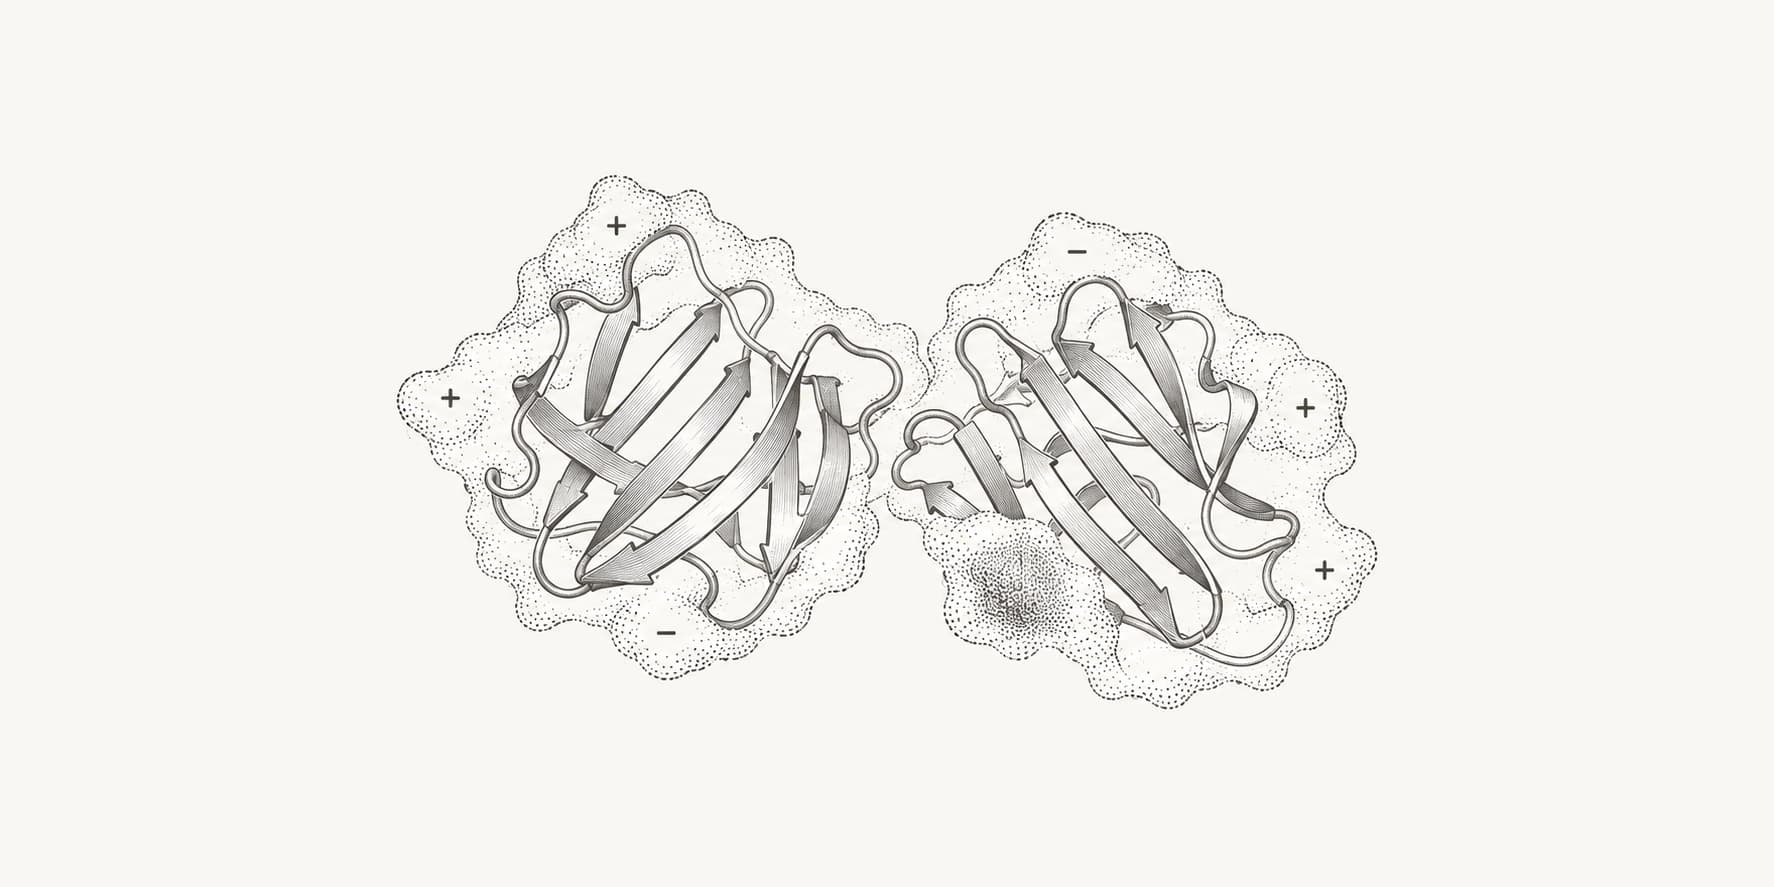
| PPC | Patches of positive charge | Spatial clustering of exposed positive charge around the CDRs |
| PNC | Patches of negative charge | Spatial clustering of exposed negative charge around the CDRs |
| SFvCSP | Structural Fv charge symmetry parameter | The product of the net exposed VH and VL charges |
The original 2019 TAP framework selected these properties because they separated approved or clinical-stage antibodies from less typical regions of antibody property space. TAP2 recalculated the reference distributions with the newer structure predictor and a larger, light-chain-diverse set.[4][2]
TAP2 is best treated as an early triage panel. It can point to a hydrophobic patch, charge imbalance, or unusual loop length that deserves closer inspection. It cannot recreate concentration-dependent formulation behavior or replace measurements of expression, monomer content, thermal stability, self-interaction, polyspecificity, viscosity, and aggregation.[8]
Why did ProteinIQ reimplement TAP2?
Oxford provides a public TAP service and publishes the scientific method, but it does not provide a public source repository for the TAP2 implementation. That prevents another service from running the original implementation directly.[6]
ProteinIQ took an independent, evidence-led reconstruction approach. The implementation combines the published TAP2 and original TAP methods, the released 664-antibody model-and-score corpus, ABodyBuilder2, the public PSA-based scoring implementation distributed with the Therapeutic Nanobody Profiler, and Oxford's public TAP example.[2][3][4][5][7][9]
This distinction matters: ProteinIQ does not claim to contain Oxford's private code. It claims conformance to the reproducible scientific contract that can be established from public evidence.
The reconstruction followed an evidence hierarchy
| Evidence | How it was used |
|---|---|
| TAP2 paper | Defined the model family, five metrics, reference population, and published flag bands |
| Original TAP paper | Clarified the original surface-patch definitions and geometric protocol |
| Released TAP2 corpus | Supplied 664 structures and their published five-metric results for numeric differential testing |
| ABodyBuilder2 publication and software | Supplied the variable-fragment structure model used by TAP2 |
| Public PSA/TNP implementation | Supplied executable evidence for accessibility, charge, hydrophobicity, and patch calculations |
| Oxford public example | Provided an additional end-to-end behavior check |
The released corpus was the decisive test. ProteinIQ scored every published structure and compared each result with the corresponding reference value. The implementation reproduced 3,320 of 3,320 values exactly: five metrics for each of 664 structures.[1][3]
That is a strong but deliberately bounded result. It establishes exact parity for the five TAP2 calculations when conditioned on the published PDB structures. It does not prove that independently generated ABodyBuilder2 coordinates are bitwise identical to a model produced by Oxford's private service.
Public evidence resolved method ambiguities
Reimplementing a scientific method is not always a matter of translating one equation. Prose, data, and executable behavior can disagree. Two details required explicit resolution:
| Ambiguity | ProteinIQ behavior | Reason |
|---|---|---|
| CDR-vicinity distance | <4.0 Å | One TAP2 sentence says 4.5 Å, but the released 664-model scores, original TAP method, public Oxford example, and executable scoring behavior agree at 4.0 Å |
| Salt-bridge treatment | Salt-bridged residues use glycine hydrophobicity for PSH; their charge values remain available to PPC, PNC, and SFvCSP | This is the behavior required to reproduce the released corpus and the public scoring implementation |
ProteinIQ therefore follows the executable reference evidence rather than silently choosing the isolated prose value. The report records method and runtime versions so a result remains auditable.[3][4][7][9]
What is reproduced, and what is not?
| TAP2 component | ProteinIQ status |
|---|---|
| Five published metrics | Reproduced exactly across the released 664-structure corpus |
| Published 2023 flag bands | Reproduced and versioned as tap2-cst-2023 |
| IMGT-numbered ABodyBuilder2 model | Implemented with ImmuneBuilder 1.2 |
| Structure, metric, residue, PSA, and audit outputs | Returned as downloadable files |
| Oxford website source and interface | Not available and not claimed |
| Unpublished canonical-form or sequence-liability annotations | Excluded because no reproducible public specification is available |
| Bitwise identity for newly predicted structures | Not claimed; ABodyBuilder2 modeling has run-to-run variation |
This boundary keeps the implementation testable. The complete published five-metric profiling contract is present, while features that cannot be reconstructed from public evidence are named rather than approximated.
How does TAP2 work?
TAP2 turns two amino-acid sequences into a structure-conditioned profile:
- ABodyBuilder2 predicts and refines an IMGT-numbered VH–VL structure.
- PSA calculates side-chain solvent accessibility.
- TAP2 selects exposed CDR-vicinity residues.
- It sums pairwise hydrophobic and charge contributions.
- It assigns fixed 2023 reference flags.
ABodyBuilder2 uses four independently trained structure models, selects a consensus-like prediction, and refines it with OpenMM. It also supplies per-residue error estimates, which ProteinIQ stores in the PDB B-factor column for structural inspection.[5]
The ProteinIQ protocol is fixed
TAP2 has no adjustable scientific settings because changing a cutoff or hydrophobicity scale would make the result incomparable with the published reference distributions.
| Method element | Fixed value |
|---|---|
| Structure model | ABodyBuilder2 from ImmuneBuilder 1.2 |
| Residue numbering | IMGT |
| Surface exposure | PSA side-chain relative accessibility of at least 7.5% |
| Hydrophobicity | Kyte–Doolittle values normalized to a 1–2 range |
| CDR vicinity | Exposed CDR residues and anchors, plus exposed residues with a heavy atom <4.0 Å from an exposed anchor |
| Patch neighbors | Ordered residue pairs with a minimum heavy-atom distance of 7.5 Å or less |
| Charge model | Asp/Glu -1, Lys/Arg +1, and His +0.1 at pH 7.4 |
| Reference bands | Fixed 2023 TAP2 clinical-stage therapeutic set |
The CDR-length metric counts IMGT positions 27–38, 56–65, and 105–117 on both chains. The surface calculation uses a slightly wider anchored vicinity—positions 25–40, 54–67, and 103–119—to include residues immediately beside the formal CDR boundaries.[2]
For PSH, PPC, and PNC, the method sums ordered residue-pair contributions within the distance cutoff:
Here, is normalized hydrophobicity for PSH, positive charge for PPC, or the magnitude of negative charge for PNC. “Ordered” means that both and contribute. SFvCSP is calculated separately by multiplying the net exposed heavy-chain charge by the net exposed light-chain charge.[2][4]
How should you prepare TAP2 inputs?
TAP2 requires exactly two protein sequences: one VH and one VL. If you are unsure where a variable domain begins or ends, first review antibody variable regions or number the sequence with ANARCII.
| Input | Accepted format | Requirements |
|---|---|---|
| Heavy Chain (VH) | Raw amino-acid sequence or one FASTA record | One complete heavy-chain variable domain, 70–180 standard amino acids |
| Light Chain (VL) | Raw amino-acid sequence or one FASTA record | One complete kappa or lambda light-chain variable domain, 70–180 standard amino acids |
Use variable domains, not full antibody chains
Remove the signal peptide and constant-region sequence. A full immunoglobulin heavy chain contains domains that ABodyBuilder2 is not meant to model in this workflow. Including them can prevent domain recognition or produce a misleading submission.
Keep the chains separate
Put VH in the heavy-chain slot and VL in the light-chain slot. Each slot accepts one sequence. Do not put a paired two-record FASTA into either field; ProteinIQ rejects it because the chain identity would be ambiguous.
Use standard amino-acid letters only
Remove gaps, stop symbols, numbering, spaces embedded in a sequence, and nonstandard or ambiguous codes such as X. ProteinIQ validates both chains before starting the structure calculation.
TAP2 is not a nanobody profiler
A VHH or other single-domain antibody has no paired VL, so SFvCSP and the paired-Fv reference distributions are not applicable. Use the Therapeutic Nanobody Profiler for a VHH candidate instead.
How do you use TAP2 online?
1. Open TAP2
Go to the ProteinIQ TAP2 webserver. The input panel has separate VH and VL slots and an optional job name.
2. Enter the heavy-chain variable domain
Paste the amino-acid sequence directly or upload a .fasta, .fa, or .txt file containing one record. Check that this is the variable domain rather than the complete therapeutic heavy chain.
3. Enter the light-chain variable domain
Paste or upload one kappa or lambda VL sequence. TAP2 was specifically updated to place both light-chain classes in a more representative clinical reference context.[2]
4. Check the submission
Confirm that the slots have not been swapped, each contains one sequence, and neither includes a constant region. There are no score cutoffs, modeling presets, or random-seed fields to choose.
5. Submit the job
ProteinIQ validates the sequences, predicts the paired structure, runs the fixed TAP2 scoring protocol, and stores the results with the job. Structure prediction is the longest part of the calculation.
6. Read the metrics before focusing on the colors
Start with the numeric values. A flag compresses a continuous distribution into a category, so two candidates immediately on opposite sides of a boundary can be more similar than their colors imply.
7. Inspect the profiled structure and evidence files
Use the structure viewer to locate CDRs with elevated model error, then inspect tap2_residues.csv to see which exposed residues entered the vicinity and patch calculations. Download the report and model before comparing candidates outside ProteinIQ.
How do you interpret TAP2 results?
ProteinIQ pins the reference bands published for the 2023 664-therapeutic set. Green marks the central reference region, amber a tail region, and red the most unusual region defined in the paper.[2]
| Metric | Green | Amber | Red |
|---|---|---|---|
| Total CDR length | 42 < value < 55 | 37–42 or 55–63 | <37 or >63 |
| PSH | 110.11 < value < 168.06 | 95.58–110.11 or 168.06–201.59 | <95.58 or >201.59 |
| PPC | <1.32 | 1.32–4.22 | >4.22 |
| PNC | <2.00 | 2.00–4.42 | >4.42 |
| SFvCSP | >-6 | -30.60 to -6 | <-30.60 |
Values exactly on a displayed boundary remain in the amber interval. TAP2 does not calculate a combined score or rank candidates from best to worst.
Total CDR length
This is the sum of the six IMGT CDR lengths. Very short or long loops occupy less common regions of the clinical-stage reference distribution and may also be harder to model. Interpret a length alert alongside per-residue error in the corresponding loop.
PSH: patches of surface hydrophobicity
PSH measures hydrophobic patching around the modeled antigen-binding surface. A high value means hydrophobic exposed residues form a larger or more connected patch in the predicted geometry. That can motivate aggregation, self-association, and nonspecific-binding experiments.
PSH is two-tailed in TAP2: unusually low and unusually high values can both receive flags because the tool describes distance from a reference distribution. A low red PSH is therefore “unusual,” not automatically “worse” than an amber value.
PSH is also the most conformation-sensitive of the five measurements. In the TAP2 study, repeated ABodyBuilder2 runs had a lower PSH correlation than the charge-based metrics, and roughly 5.1% of antibodies changed PSH flag between two model runs. Repeat a result near a PSH boundary before treating the color as stable.[2]
PPC and PNC: charge patches
PPC and PNC measure spatial clustering of same-sign surface charge near the CDRs. They are not the total charge of the sequence. Two antibodies with similar net charge can have different patch scores if their charged side chains occupy different positions on the surface.
High PPC or PNC can motivate solubility, self-interaction, and nonspecific-interaction assays. The TAP2 repeat analysis found the charge-patch flags much more stable than PSH, but a candidate close to a boundary still deserves structural inspection.[2]
SFvCSP: structural Fv charge symmetry
SFvCSP multiplies the net exposed VH charge by the net exposed VL charge. A strongly negative value means the two variable domains have exposed net charges with opposing signs. This is a chain-level balance metric, unlike PPC and PNC, which describe local patches.
Read combinations, not isolated alerts
An unusual PSH value is more informative when you can identify the contributing residues, assess model confidence, and compare it with charge patches and CDR length. Several alerts can strengthen the case for follow-up, but TAP2 intentionally does not turn them into a probability of failure.
What files does TAP2 return?
The result page presents the model, a compact metric table, and all supporting files.[1]
| File | Contents | When to use it |
|---|---|---|
tap2_model.pdb | Refined ABodyBuilder2 structure with per-residue model error in the B-factor column | Inspect CDR geometry, map alerts, or continue structural analysis |
tap2_metrics.csv | One-row metric, flag, charge, residue-count, and reference-version summary | Compare candidates in a spreadsheet or script |
tap2_residues.csv | IMGT position, exposure, CDR/vicinity status, charge, hydrophobicity, salt bridges, and model error | Identify residues contributing to a patch or audit the calculation |
tap2_report.json | Definitions, thresholds, sequence hashes, runtime versions, salt bridges, and limitations | Preserve a machine-readable, reproducible record |
tap2_input.fasta | Normalized VH and VL sequences used for modeling | Confirm the exact analyzed input |
psa.out | Native PSA 2.0 accessibility output | Audit solvent-accessibility values |
run.log | Human-readable method, runtime, result, and warning summary | Troubleshoot or document the run |
Do not detach the metric CSV from its reference version. The value tap2-cst-2023 identifies the flag bands used for the analysis.
What should you do after a TAP2 flag?
Use the color to decide what to inspect next, not whether to keep or discard the molecule.
| Result pattern | Sensible next step |
|---|---|
| All values green and CDR confidence is reasonable | Continue the broader developability panel; absence of TAP2 alerts does not establish low risk |
| Amber value far from neither boundary | Inspect the contributing residues and compare related candidates |
| Value close to any threshold | Repeat the model and compare the numeric values rather than one color |
| High PSH with confident local geometry | Test aggregation, self-association, and nonspecific binding; consider whether a non-contact hydrophobic residue can be changed |
| High PPC or PNC | Map the patch and test solubility, self-interaction, and polyspecificity under relevant conditions |
| Strongly negative SFvCSP | Inspect VH/VL charge balance and plan complementary interaction assays |
| Alert in a high-error CDR | Treat the geometric explanation cautiously; consider another model or an experimental structure |
Any sequence change can affect affinity, specificity, expression, immunogenicity, and structure. Reprofile proposed variants, but do not optimize one TAP2 metric in isolation.
Why might your TAP2 result differ from another website?
ProteinIQ deliberately fixes the reference version to the paper's 2023 set. Oxford's public TAP page states that its reference set was updated on February 24, 2025 to 851 post-phase-I Fv regions. A rolling service can therefore display different bands or flags for the same score.[6]
This is not necessarily a scoring disagreement. Check three things before comparing results:
- Were the sequences and domain boundaries identical?
- Were the metrics calculated from the same coordinates?
- Did both services use the same reference version and thresholds?
ProteinIQ keeps tap2-cst-2023 fixed so a saved result remains interpretable and does not change when an external website updates its population. If you compare with Oxford's current service, compare the numeric metric first and the color second.
What are the limitations of TAP2?
The scores depend on a predicted structure
TAP2 calculates its metrics exactly from the returned PDB, but that PDB is a model. ABodyBuilder2 does not offer a user-controlled random seed, and repeated runs can vary in side-chain placement or local geometry. PSH is particularly sensitive to this variation.[2][5]
The reference set is context, not a failure dataset
The 664 molecules had progressed beyond phase I; they are not a balanced collection of development successes and failures. A tail flag says a property is unusual relative to this set. It does not estimate a probability of attrition.
Five metrics cannot cover all developability risks
TAP2 does not directly model chemical liabilities, immunogenicity, Fc behavior, glycosylation, expression yield, formulation conditions, concentration-dependent viscosity, or long-term stability. Reviews comparing in silico and high-throughput experimental methods emphasize that computational flags and experimental assays provide different evidence.[8]
The method profiles a paired Fv
It needs both VH and VL. The score does not represent a complete IgG, bispecific architecture, antibody–drug conjugate, or single-domain antibody under formulation conditions.
The reconstruction has explicit boundaries
ProteinIQ validates the published five-metric contract and documents the public evidence behind it. It cannot certify hidden behavior in Oxford's private implementation, reproduce unpublished annotations, or guarantee identical coordinates from a stochastic modeling stage.
TAP2 alternatives and complementary tools
The most useful alternative depends on the question. These tools are complementary rather than interchangeable.
| Tool | Best used for | How it relates to TAP2 |
|---|---|---|
| TAP2 | Paired VH/VL surface-property profiling against a therapeutic reference set | Provides the five developability-context metrics covered in this guide |
| ImmuneBuilder | Predicting immune-receptor structures and reviewing model error | Focuses on structure prediction rather than TAP2 reference flags |
| BioPhi | Measuring antibody humanness and proposing humanization changes | Addresses sequence humanness, a different development concern |
| ANARCII | Numbering and identifying antibody variable domains | Helps check domain boundaries and chain identity before TAP2 |
| Therapeutic Nanobody Profiler | Profiling a VHH or other single-domain antibody | Uses a reference and metrics appropriate to nanobodies without VL |
| MolProbity | Checking local structure geometry | Adds geometric validation to the predicted TAP2 model |
For a broader sequence-to-structure workflow, start with chain identification and numbering, run TAP2 for surface-property context, inspect the model, and combine the result with experimental assays. More methods are available in protein analysis.
Frequently asked questions
Is TAP2 a developability prediction?
TAP2 is better described as developability profiling. It identifies five modeled properties that are central or unusual relative to a clinical-stage therapeutic reference set. It does not predict a candidate's probability of clinical success, aggregation rate, viscosity, stability, or expression yield.
What sequences does TAP2 need?
It needs one complete VH and one complete kappa or lambda VL, each 70–180 standard amino acids. Use variable domains only; remove signal peptides and constant regions.
Does a red TAP2 flag mean an antibody will fail?
No. Red means the value lies in the most unusual region defined by the published reference bands. It is a prompt for structural review and targeted experiments, not a rejection rule.
Why can a low PSH value be red?
PSH uses two tails of the reference distribution. Both unusually low and unusually high values are flagged. The colors describe typicality among the reference therapeutics, so “red” is not always synonymous with “more hydrophobic” or “worse.”
Should I repeat a TAP2 run?
Repeat it when a score, especially PSH, is close to a flag boundary or when the contributing CDR has high model error. Repeated ABodyBuilder2 predictions can differ slightly in geometry, and a small numeric change can cross a categorical threshold.[2]
Is the ProteinIQ TAP2 implementation the original Oxford code?
No. It is an independent implementation reconstructed from the published methods and public executable evidence. Its five calculations reproduce all 3,320 released structure-conditioned reference values, but ProteinIQ does not claim access to Oxford's private source or bitwise identity for newly generated models.[1][3]
A practical first-run recipe
For one paired antibody candidate:
- Check VH and VL boundaries with ANARCII if needed.
- Submit both variable domains to TAP2.
- Record all five values, flags, and
tap2-cst-2023. - Inspect per-residue error around flagged CDRs.
- Trace PSH, PPC, or PNC contributors in
tap2_residues.csv. - Repeat metrics near a threshold; compare values, not colors alone.
- Confirm the risk with an orthogonal assay.
That workflow preserves what TAP2 does well: turn a paired sequence into an auditable, structure-informed comparison with clinical-stage antibody property space—while keeping its categorical flags in the proper experimental context.