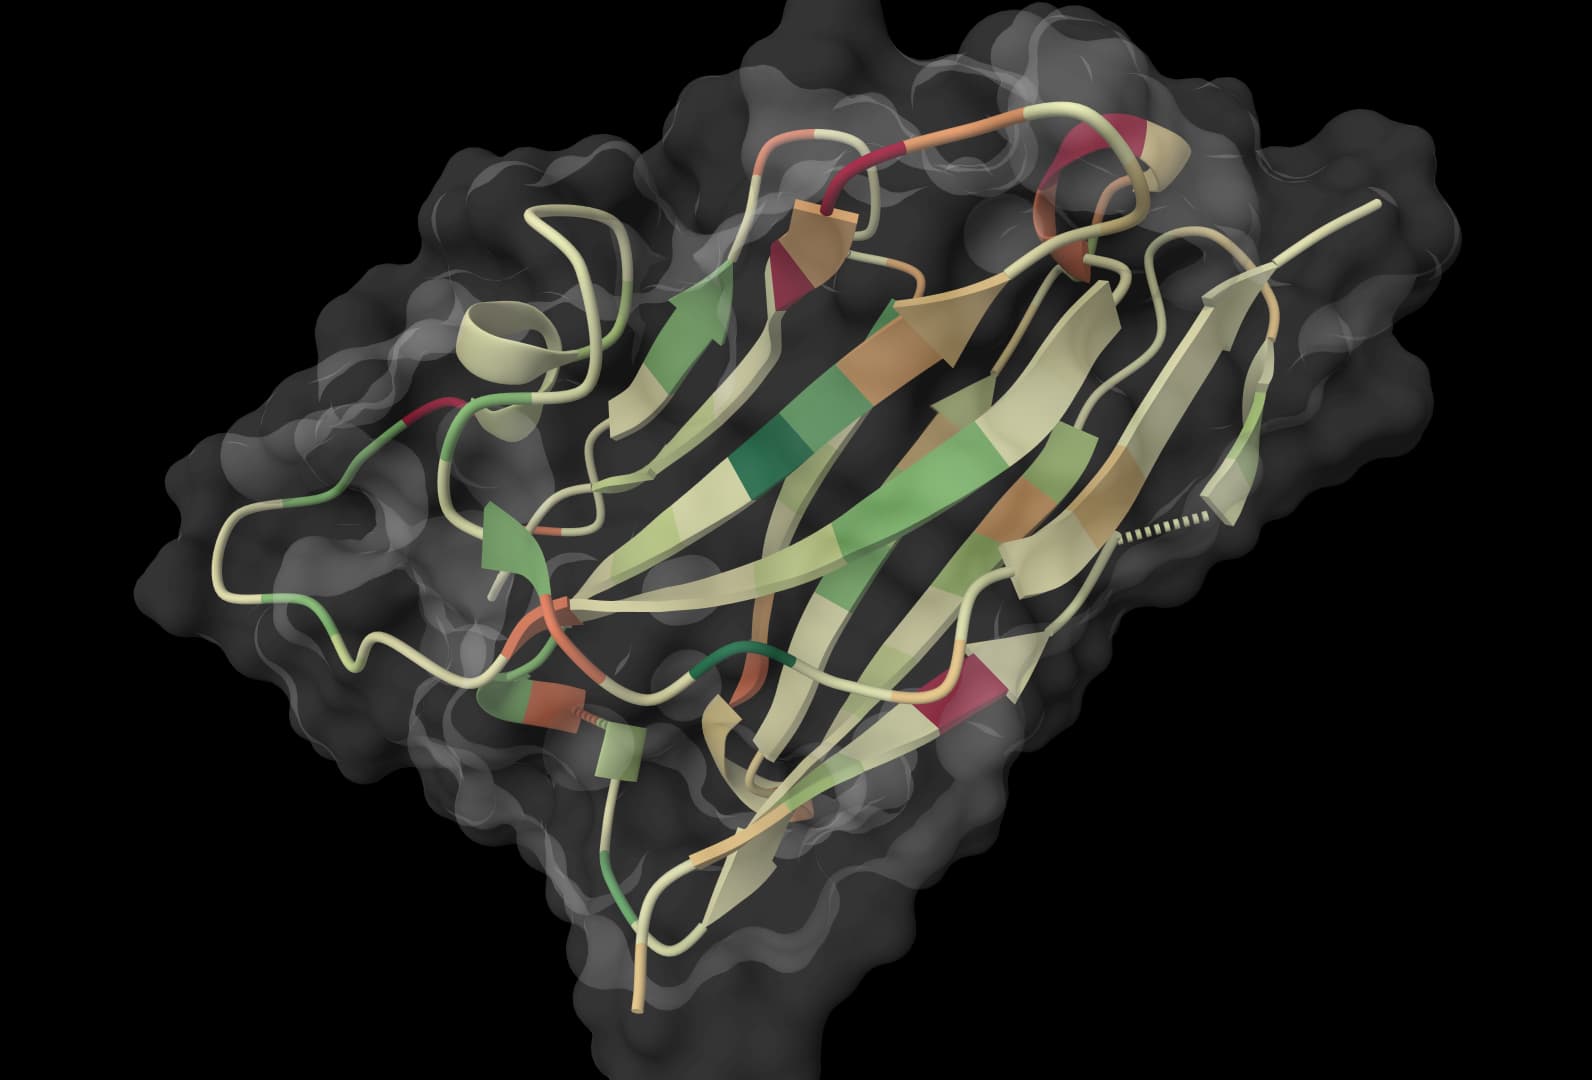
TAP2
Contextualize antibody developability risks across hydrophobicity, charge patches, CDR length, and Fv charge symmetry.
What is TAP2?
TAP2 is a structure-informed antibody developability profiling method for paired heavy and light-chain variable domains. It reports total CDR length, surface hydrophobicity, positive and negative charge patches, Fv charge symmetry, and reference flags.
ProteinIQ runs an independent reconstruction of the published five-metric protocol. The TAP2 online guide covers the scientific background, reconstruction evidence, and experimental follow-up in detail.
How to use TAP2 online
Enter one complete antibody heavy-chain variable domain and one complete kappa or lambda light-chain variable domain. ProteinIQ builds an IMGT-numbered ABodyBuilder2 model, calculates the five TAP2 metrics, assigns fixed 2023 clinical-reference flags, and returns the profiled PDB with CSV, JSON, residue-level, PSA, and run-log files.
Inputs
| Input | Accepted content | Requirements |
|---|---|---|
Heavy Chain (VH) | Raw sequence, one FASTA record, or .fasta, .fa, or .txt file | One complete VH domain, 70 to 180 standard amino acids; maximum file size 1 MB. |
Light Chain (VL) | Raw sequence, one FASTA record, or .fasta, .fa, or .txt file | One complete kappa or lambda VL domain, 70 to 180 standard amino acids; maximum file size 1 MB. |
Job name | Text | Optional label for the run. |
Each chain slot accepts one sequence. Remove signal peptides, constant regions, gaps, stop symbols, and ambiguous residues such as X. A paired FASTA with both chains in one slot is rejected.
Single-domain VHH sequences are not valid TAP2 inputs because the method requires both VH and VL. Use the Therapeutic Nanobody Profiler for VHH profiling.
Example input
The following example pair has passed repeated ProteinIQ validation runs.
Heavy chain (VH)
EVQLVQSGGGLVKPGGSLRLSCAASGFTFSGYTMNWVRQAPGKGLEWVSGISGNSGIIEYADSVKGRFTISRDNSKNTLYLQMNSLRAEDTALYYCAKDILGGFYYFDYWGQGTPVTVSSLight chain (VL)
VLTQSPLSLPVTLGQPASISCRSSQSLVFSDGNTYLHWFQQRPGQPPRRLIYQVSNRDSGVPDRFSGSGSGTDFTLKISRVEAEDVGVYYCMQALQVHSTFGPGTTVDIKRepeated validation runs produced the following results. Surface scores can vary slightly because ABodyBuilder2 does not provide a fixed seed.
| Metric | Validation result | Flag |
|---|---|---|
| Total CDR length | 52 | Green |
| PSH | 146.8535 to 155.0102 | Green |
| PPC | 0.0039 to 0.0051 | Green |
| PNC | 0.1811 to 0.1852 | Green |
| SFvCSP | 0.0 | Green |
Settings
TAP2 has no adjustable scientific settings. The fixed protocol keeps new results comparable with the published reference bands.
| Protocol element | Fixed value |
|---|---|
| Structure model | ABodyBuilder2 from ImmuneBuilder 1.2 |
| Numbering | IMGT |
| Hydrophobicity | Kyte-Doolittle scale normalized to values from 1 to 2 |
| Surface exposure | PSA side-chain relative accessibility of at least 7.5% |
| CDR vicinity | Exposed CDR anchors plus exposed residues within <4.0 Å |
| Patch neighbors | Ordered residue pairs with a minimum heavy-atom distance of 7.5 Å or less |
| Charge model | Asp/Glu -1, Lys/Arg +1, and His +0.1 at pH 7.4 |
| Reference set | tap2-cst-2023, the fixed 664-therapeutic set published with TAP2 |
Outputs
The result page separates the profile into three views.
| View | Contents |
|---|---|
Structure | Interactive view of tap2_model.pdb. Per-residue ABodyBuilder2 error estimates are stored in the B-factor column. |
Metrics | Copyable table containing the five metrics, flags, supporting counts, exposed chain charges, salt bridges, and reference version. |
Files | Downloadable structure, metric, residue, report, input, PSA, and log files. |
Metric columns
| Column | Meaning |
|---|---|
total_cdr_length | Number of residues in the six IMGT CDRs. |
psh | Hydrophobic patch score in the modeled CDR vicinity. |
ppc | Positive-charge patch score in the CDR vicinity. |
pnc | Negative-charge patch score in the CDR vicinity. |
sfvcsp | Product of the net exposed VH and VL charges. |
*_flag | Green, amber, or red reference category for the corresponding metric. |
surface_exposed_residues | Number of residues that pass the surface-exposure cutoff. |
cdr_vicinity_residues | Number of exposed residues included in the CDR-vicinity calculation. |
heavy_exposed_charge | Net charge across exposed VH residues. |
light_exposed_charge | Net charge across exposed VL residues. |
salt_bridges | Number of detected salt bridges. |
reference_version | Reference bands used for the flags. Current results use tap2-cst-2023. |
Downloadable files
| File | Contents |
|---|---|
tap2_model.pdb | Refined ABodyBuilder2 structure used for scoring. |
tap2_metrics.csv | One-row metric, flag, charge, count, and reference summary. |
tap2_residues.csv | Residue-level IMGT positions, exposure, CDR membership, vicinity membership, charge, hydrophobicity, salt bridges, and model error. |
tap2_report.json | Thresholds, metric definitions, runtime versions, sequence hashes, salt bridges, warnings, and limitations. |
tap2_input.fasta | Normalized VH and VL sequences used for modeling. |
psa.out | PSA 2.0 accessibility output used by the score calculation. |
run.log | Method, runtime, result, warning, or failure details. |
Workflows can reuse the metric row and each downloadable file from the same job. The paired VH and VL inputs remain linked to that job when a workflow supplies the antibody pair.
Understanding TAP2 results
Flags show where each modeled property falls relative to the fixed 2023 clinical-stage set. Green marks the central region, amber a tail, and red the outer region. They are reference categories, not pass-or-fail criteria.
| Metric | Green | Amber | Red |
|---|---|---|---|
| Total CDR length | 42 < value < 55 | 37 to 42 or 55 to 63 | <37 or >63 |
| PSH | 110.11 < value < 168.06 | 95.58 to 110.11 or 168.06 to 201.59 | <95.58 or >201.59 |
| PPC | <1.32 | 1.32 to 4.22 | >4.22 |
| PNC | <2.00 | 2.00 to 4.42 | >4.42 |
| SFvCSP | >-6 | -30.60 to -6 | <-30.60 |
Values exactly on a displayed boundary remain amber. PSH is two-sided, so unusually low and unusually high values can both receive alerts.
| Result pattern | Next check |
|---|---|
| Metric near a boundary | Repeat the run and compare numeric values rather than colors alone. |
| Alert in a high-error CDR | Inspect the modeled structure before interpreting the surface geometry. |
| PSH, PPC, or PNC alert | Use tap2_residues.csv to identify the contributing exposed residues. |
| Several alerts | Plan orthogonal assays for the specific surface properties involved. |
Troubleshooting
| Problem | Resolution |
|---|---|
| A chain is rejected as too short or long | Submit only the complete variable domain, between 70 and 180 residues. |
| A FASTA input reports multiple records | Keep one VH record in the heavy slot and one VL record in the light slot. |
| The sequence contains unsupported residues | Use the 20 standard one-letter amino-acid codes without gaps, stops, or X. |
| VH and VL boundaries are uncertain | Check the domains with ANARCII before submission. |
| Scores move across repeated runs | Compare the numeric values and model error. ABodyBuilder2 geometry can vary between runs. |
| Modeling or scoring fails | Open run.log for the failed stage, error code, and suggested correction. |
| Model refinement fails | Check the submitted domains and native diagnostics in run.log. The job returns no developability scores when ABodyBuilder2 cannot refine the model. |
How TAP2 works
ABodyBuilder2 predicts and refines an IMGT-numbered VH/VL structure. PSA identifies exposed side chains, and TAP2 calculates CDR length, hydrophobic and charged surface patches, and exposed chain-charge symmetry from that structure. The five values are then categorized against the fixed 2023 reference bands.
Important limitations
- TAP2 flags describe reference-set position, not clinical success or experimental failure.
- Scores depend on a predicted structure. Repeated models can differ, especially for PSH near a boundary.
- The method profiles a paired Fv, not Fc behavior, full-length geometry, formulation conditions, or concentration effects.
- The fixed
tap2-cst-2023bands can differ from services that use a newer reference population. - Expression, stability, viscosity, aggregation, self-interaction, and polyspecificity still require experimental measurement.
Related tools

TNP
Characterize nanobody developability with sequence, structure, and surface-property metrics.

Chou-Fasman
Predict protein secondary structure from amino acid propensities for helices, sheets, and turns.

AbLang-2
Predict non-germline residues and generate embeddings for paired or unpaired antibody sequences.

DeepRank-Ab
Score antibody and nanobody complexes with predicted DockQ.

DeepSP
Generate 30 sequence-derived spatial descriptors for paired antibody variable domains.

DeepViscosity
Screen paired antibody Fv sequences for high-concentration viscosity risk.

PolyXpert
Screen paired antibody variable domains for low or high polyreactivity.

DeepImmuno
Score, compare, and generate peptide candidates with the official DeepImmuno models.

IgGM
Design antibodies using a generative foundation model.

ProstT5
Bidirectional translation between protein sequences and 3Di structural tokens