TNP icon

TNP

(0.0.1)

Characterize nanobody developability with sequence, structure, and surface-property metrics. Learn more

What is TNP?

TNP, the Therapeutic Nanobody Profiler, is an open-source, structure-informed method for assessing the developability profile of single-domain VHH nanobodies. It combines three CDR geometry descriptors with three surface patch scores, then compares each value with a reference distribution built from 36 clinical-stage nanobody sequences and predicted structures.

Nanobodies differ from conventional antibodies because they have no light chain, leave the framework 2 region exposed, and often use longer CDR3 loops with distinct conformations. TNP therefore adds CDR3 length and compactness to the hydrophobicity, charge, and total CDR length measurements adapted from the Therapeutic Antibody Profiler.

The green, amber, and red labels are reference-range flags. They show how unusual one modeled property is among the clinical-stage reference set. They do not predict clinical success or replace expression, aggregation, stability, self-association, polyspecificity, or formulation experiments.

How to use TNP online

Run TNP online by pasting one VHH sequence or submitting an uppercase FASTA file with one or more nanobodies. ProteinIQ numbers each variable domain, predicts and refines a NanoBodyBuilder2 structure, calculates six developability descriptors, assigns clinical-reference traffic-light flags, and returns an interactive structure, a results table, native JSON, residue annotations, liabilities, and downloadable model files.

Inputs

Input formAccepted contentRequirements
Raw sequenceOne unwrapped amino-acid sequenceSubmit one complete VHH variable domain without spaces or line breaks. The default result name is Nb1.
FASTAOne or more FASTA recordsUse uppercase residues and a unique, filesystem-safe ID for each record. Wrapped sequence lines are accepted.

TNP is intended for nanobody variable domains, not arbitrary proteins, signal peptides, constant regions, or full fusion constructs. ANARCI and NanoBodyBuilder2 determine whether a submitted sequence can be numbered and modeled as a VHH. Input files may be up to 1 MiB, with the available batch size determined by the account plan.

Settings

SettingDefaultMeaning
Hydrophobicity scaleKyte-DoolittleSelects the residue hydrophobicity scale used for PSH. TNP also supports Wimley-White, Hessa et al., Eisenberg-McLachlan, and Black-Mould. Compare candidates using the same scale.
Raw sequence nameNb1Names a single raw-sequence result and its files. FASTA runs use record IDs instead.

IMGT numbering, NanoBodyBuilder2 modeling, structural refinement, surface calculations at pH 7.4, and the clinical-reference thresholds are fixed parts of the method.

Results

ResultInterpretation
Total CDR LengthTotal number of residues across IMGT CDR1, CDR2, and CDR3.
CDR3 LengthNumber of residues in the IMGT CDR3 loop.
CDR3 CompactnessCDR3 length divided by its reach from the loop anchors. Higher values describe a loop that is more compact relative to its length.
PSHPatch score for surface hydrophobicity across the modeled CDR vicinity.
PPCPatch score for positive surface charge across the CDR vicinity.
PNCPatch score for negative surface charge across the CDR vicinity.
Flag columnsTNP's green, amber, or red clinical-reference label for the corresponding metric.

PSH, PPC, and PNC are spatial patch scores rather than amino-acid counts or whole-domain net charge. Their values depend on the predicted three-dimensional structure.

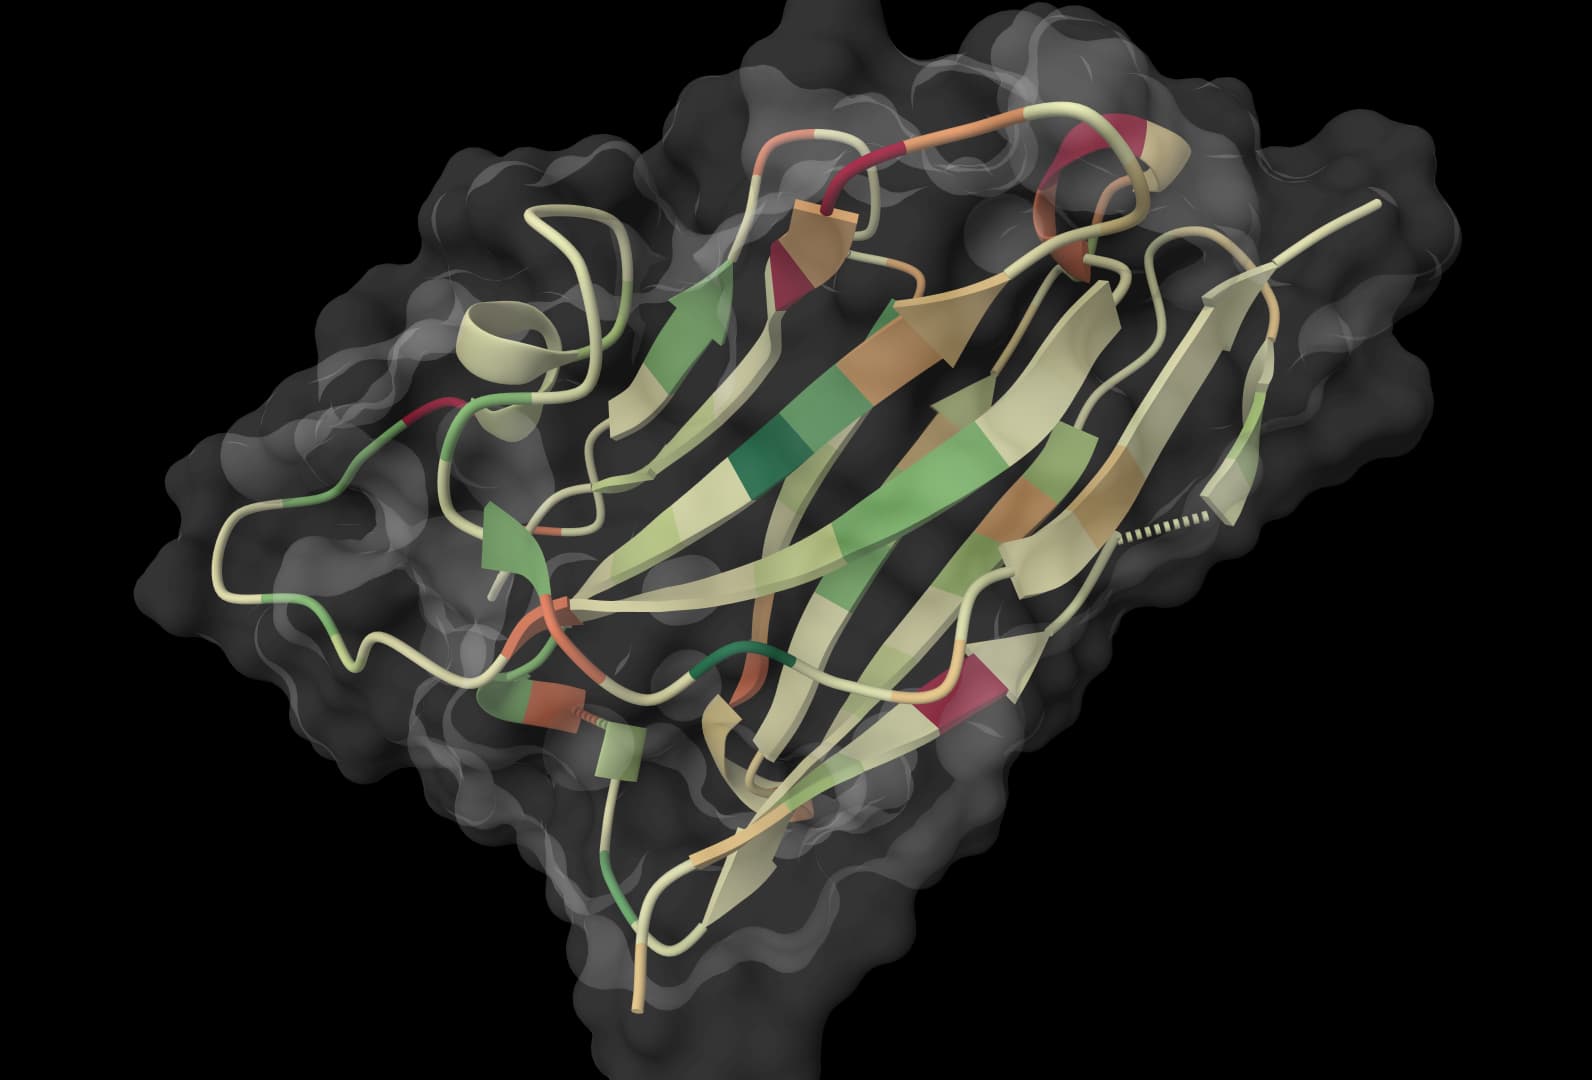
The Structures tab contains the NanoBodyBuilder2 model used for scoring and a second PDB with TNP surface annotations. The Files tab retains the complete run record.

File groupContents
TNP_Results_*.jsonNative metric and flag values for every reported record.
Final_Models/*_Model.pdbHydrogen-stripped NanoBodyBuilder2 structure used by TNP.
Final_Models/*_Model_Annotated.pdbStructure annotated with hydrophobicity and charge information.
Model details and annotationsDSSP properties, IMGT numbering, residue annotations, and the retained NanoBodyBuilder2 model.
Sequence liabilitiesNative sequence-liability table. TNP names one copied file with a .json extension even though its contents remain tabular text.
Run recordsPer-record TNP summary plus execution and invocation records.

Understanding the traffic-light flags

TNP calibrates its flags against 36 clinical-stage nanobody data points. Green marks the central reference region. Amber marks the lowest and/or highest 5% of the clinical distribution while remaining inside its observed range. Red marks a value outside the current observed clinical range.

MetricGreenAmberRed
Total CDR length25 to 3620 to 24 or 37 to 39<20 or >39
CDR3 length9 to 205 to 8 or 21 to 23<5 or >23
CDR3 compactness>0.81 and <1.570.56 to 0.81 or 1.57 to 1.61<0.56 or >1.61
PSH>79.59 and <126.8373.40 to 79.59 or 126.83 to 155.47<73.40 or >155.47
PPC<0.390.39 to 1.18>1.18
PNC<1.471.47 to 1.88>1.88

These bands are not a universal good-to-bad scale. Total CDR length, CDR3 length, compactness, and PSH use two-sided reference ranges, so an unusually low value can receive the same color as an unusually high value. PPC and PNC use upper-tail warnings because their clinical thresholds are one-sided.

Reading a profile

  • All green: The six modeled properties lie in the central clinical-reference regions. Other developability problems can still be present because TNP does not measure them directly.
  • One amber flag: The candidate is near an edge of the reference distribution for that property. The underlying value, returned PDB, and relevant experimental assay should be reviewed before deciding whether it matters.
  • One red flag: The property lies outside the range observed among the 36 clinical-stage references. Red identifies an outlier and a priority for follow-up, not a failed candidate.
  • Several amber or red flags: Multiple unusual properties strengthen the case for structural inspection and orthogonal assays. TNP does not combine the six flags into a single probability or overall score.

Length and compactness should be interpreted together. A long CDR3 may fold over the framework 2 region, while a shorter loop may extend away from it. Both broad conformational subtypes occur in clinical-stage nanobodies, so compactness alone does not define a preferred design.

PSH, PPC, and PNC describe local surface patterns around the paratope. A high PSH value can motivate hydrophobicity, aggregation, or nonspecific-binding experiments. High PPC or PNC values can motivate assays for self-interaction, solubility, and nonspecific interactions. The scores suggest where to investigate; they do not reproduce those assays.

The included example has a total CDR length of 28 and a CDR3 length of 12, which are both green. Structure-dependent values can vary between repeated runs. In particular, the example's PSH value can fall on either side of the green-to-amber boundary, while the sequence-derived length values remain fixed.

How TNP works

TNP follows a sequence-to-structure workflow:

  • ANARCI numbers the submitted VHH with the IMGT scheme and identifies CDR1, CDR2, and CDR3.
  • NanoBodyBuilder2 predicts the nanobody structure and refines it with OpenMM.
  • TNP calculates CDR3 compactness from the loop length and its modeled reach.
  • The bundled surface analysis calculates hydrophobic, positive-charge, and negative-charge patches across the CDR vicinity at pH 7.4.
  • TNP applies its clinical-reference thresholds and writes the native result JSON, structures, annotations, liabilities, numbering, and run summary.

The pinned implementation defines compactness as:

CCDR3=LCDR3ρC_{\mathrm{CDR3}} = \frac{L_{\mathrm{CDR3}}}{\rho}CCDR3​=ρLCDR3​​

Here, LCDR3L_{\mathrm{CDR3}}LCDR3​ is the IMGT CDR3 length and ρ\rhoρ is the distance from the loop anchors to its furthest point. TNP uses IMGT positions 27 to 38 for CDR1, 56 to 65 for CDR2, and 105 to 117 for CDR3.

Choosing TNP, TAP2, or ImmuneBuilder

TNP is designed for single-domain VHH nanobodies and uses nanobody-specific CDR3 descriptors and reference bands. TAP2 profiles conventional paired VH/VL antibodies against antibody clinical-reference distributions, so its values and thresholds should not be transferred to nanobodies.

ImmuneBuilder is appropriate when the main objective is immune-receptor structure prediction. TNP uses its NanoBodyBuilder2 model as one stage of a broader developability profile. BioPhi addresses sequence humanness and humanization, which is a separate question from the modeled CDR and surface properties reported by TNP.

Reproducibility and limitations

  • Predicted-structure dependence: NanoBodyBuilder2 has no seed setting. Repeated predictions can change compactness, PSH, PPC, PNC, annotated structures, and sometimes a flag near a threshold.
  • Small clinical reference set: The thresholds come from 36 clinical-stage nanobody sequences and predicted structures. They describe that population rather than every viable VHH scaffold or format.
  • Screening rather than diagnosis: The published comparison found that computational metrics and experimental assays provide complementary, sometimes discordant views of developability. Experimental testing remains necessary.
  • Construct differences: TNP analyzes an isolated VHH model. Experimental data in the study were collected from VHH domains expressed as Fc-fused IgG constructs, whose biophysical behavior can differ from isolated nanobodies.
  • Scale sensitivity: Changing the hydrophobicity scale changes PSH and can change its flag. Candidate comparisons should keep the scale fixed.
  • Versioned thresholds: TNP's authors expect the clinical guidelines to evolve as more nanobodies progress through trials. ProteinIQ keeps each saved run tied to its reported TNP version so its values and thresholds remain interpretable.

Table of contents

TNP icon

TNP

(0.0.1)

Characterize nanobody developability with sequence, structure, and surface-property metrics. Learn more

What is TNP?

TNP, the Therapeutic Nanobody Profiler, is an open-source, structure-informed method for assessing the developability profile of single-domain VHH nanobodies. It combines three CDR geometry descriptors with three surface patch scores, then compares each value with a reference distribution built from 36 clinical-stage nanobody sequences and predicted structures.

Nanobodies differ from conventional antibodies because they have no light chain, leave the framework 2 region exposed, and often use longer CDR3 loops with distinct conformations. TNP therefore adds CDR3 length and compactness to the hydrophobicity, charge, and total CDR length measurements adapted from the Therapeutic Antibody Profiler.

The green, amber, and red labels are reference-range flags. They show how unusual one modeled property is among the clinical-stage reference set. They do not predict clinical success or replace expression, aggregation, stability, self-association, polyspecificity, or formulation experiments.

How to use TNP online

Run TNP online by pasting one VHH sequence or submitting an uppercase FASTA file with one or more nanobodies. ProteinIQ numbers each variable domain, predicts and refines a NanoBodyBuilder2 structure, calculates six developability descriptors, assigns clinical-reference traffic-light flags, and returns an interactive structure, a results table, native JSON, residue annotations, liabilities, and downloadable model files.

Inputs

Input formAccepted contentRequirements
Raw sequenceOne unwrapped amino-acid sequenceSubmit one complete VHH variable domain without spaces or line breaks. The default result name is Nb1.
FASTAOne or more FASTA recordsUse uppercase residues and a unique, filesystem-safe ID for each record. Wrapped sequence lines are accepted.

TNP is intended for nanobody variable domains, not arbitrary proteins, signal peptides, constant regions, or full fusion constructs. ANARCI and NanoBodyBuilder2 determine whether a submitted sequence can be numbered and modeled as a VHH. Input files may be up to 1 MiB, with the available batch size determined by the account plan.

Settings

SettingDefaultMeaning
Hydrophobicity scaleKyte-DoolittleSelects the residue hydrophobicity scale used for PSH. TNP also supports Wimley-White, Hessa et al., Eisenberg-McLachlan, and Black-Mould. Compare candidates using the same scale.
Raw sequence nameNb1Names a single raw-sequence result and its files. FASTA runs use record IDs instead.

IMGT numbering, NanoBodyBuilder2 modeling, structural refinement, surface calculations at pH 7.4, and the clinical-reference thresholds are fixed parts of the method.

Results

ResultInterpretation
Total CDR LengthTotal number of residues across IMGT CDR1, CDR2, and CDR3.
CDR3 LengthNumber of residues in the IMGT CDR3 loop.
CDR3 CompactnessCDR3 length divided by its reach from the loop anchors. Higher values describe a loop that is more compact relative to its length.
PSHPatch score for surface hydrophobicity across the modeled CDR vicinity.
PPCPatch score for positive surface charge across the CDR vicinity.
PNCPatch score for negative surface charge across the CDR vicinity.
Flag columnsTNP's green, amber, or red clinical-reference label for the corresponding metric.

PSH, PPC, and PNC are spatial patch scores rather than amino-acid counts or whole-domain net charge. Their values depend on the predicted three-dimensional structure.

The Structures tab contains the NanoBodyBuilder2 model used for scoring and a second PDB with TNP surface annotations. The Files tab retains the complete run record.

File groupContents
TNP_Results_*.jsonNative metric and flag values for every reported record.
Final_Models/*_Model.pdbHydrogen-stripped NanoBodyBuilder2 structure used by TNP.
Final_Models/*_Model_Annotated.pdbStructure annotated with hydrophobicity and charge information.
Model details and annotationsDSSP properties, IMGT numbering, residue annotations, and the retained NanoBodyBuilder2 model.
Sequence liabilitiesNative sequence-liability table. TNP names one copied file with a .json extension even though its contents remain tabular text.
Run recordsPer-record TNP summary plus execution and invocation records.

Understanding the traffic-light flags

TNP calibrates its flags against 36 clinical-stage nanobody data points. Green marks the central reference region. Amber marks the lowest and/or highest 5% of the clinical distribution while remaining inside its observed range. Red marks a value outside the current observed clinical range.

MetricGreenAmberRed
Total CDR length25 to 3620 to 24 or 37 to 39<20 or >39
CDR3 length9 to 205 to 8 or 21 to 23<5 or >23
CDR3 compactness>0.81 and <1.570.56 to 0.81 or 1.57 to 1.61<0.56 or >1.61
PSH>79.59 and <126.8373.40 to 79.59 or 126.83 to 155.47<73.40 or >155.47
PPC<0.390.39 to 1.18>1.18
PNC<1.471.47 to 1.88>1.88

These bands are not a universal good-to-bad scale. Total CDR length, CDR3 length, compactness, and PSH use two-sided reference ranges, so an unusually low value can receive the same color as an unusually high value. PPC and PNC use upper-tail warnings because their clinical thresholds are one-sided.

Reading a profile

  • All green: The six modeled properties lie in the central clinical-reference regions. Other developability problems can still be present because TNP does not measure them directly.
  • One amber flag: The candidate is near an edge of the reference distribution for that property. The underlying value, returned PDB, and relevant experimental assay should be reviewed before deciding whether it matters.
  • One red flag: The property lies outside the range observed among the 36 clinical-stage references. Red identifies an outlier and a priority for follow-up, not a failed candidate.
  • Several amber or red flags: Multiple unusual properties strengthen the case for structural inspection and orthogonal assays. TNP does not combine the six flags into a single probability or overall score.

Length and compactness should be interpreted together. A long CDR3 may fold over the framework 2 region, while a shorter loop may extend away from it. Both broad conformational subtypes occur in clinical-stage nanobodies, so compactness alone does not define a preferred design.

PSH, PPC, and PNC describe local surface patterns around the paratope. A high PSH value can motivate hydrophobicity, aggregation, or nonspecific-binding experiments. High PPC or PNC values can motivate assays for self-interaction, solubility, and nonspecific interactions. The scores suggest where to investigate; they do not reproduce those assays.

The included example has a total CDR length of 28 and a CDR3 length of 12, which are both green. Structure-dependent values can vary between repeated runs. In particular, the example's PSH value can fall on either side of the green-to-amber boundary, while the sequence-derived length values remain fixed.

How TNP works

TNP follows a sequence-to-structure workflow:

  • ANARCI numbers the submitted VHH with the IMGT scheme and identifies CDR1, CDR2, and CDR3.
  • NanoBodyBuilder2 predicts the nanobody structure and refines it with OpenMM.
  • TNP calculates CDR3 compactness from the loop length and its modeled reach.
  • The bundled surface analysis calculates hydrophobic, positive-charge, and negative-charge patches across the CDR vicinity at pH 7.4.
  • TNP applies its clinical-reference thresholds and writes the native result JSON, structures, annotations, liabilities, numbering, and run summary.

The pinned implementation defines compactness as:

CCDR3=LCDR3ρC_{\mathrm{CDR3}} = \frac{L_{\mathrm{CDR3}}}{\rho}CCDR3​=ρLCDR3​​

Here, LCDR3L_{\mathrm{CDR3}}LCDR3​ is the IMGT CDR3 length and ρ\rhoρ is the distance from the loop anchors to its furthest point. TNP uses IMGT positions 27 to 38 for CDR1, 56 to 65 for CDR2, and 105 to 117 for CDR3.

Choosing TNP, TAP2, or ImmuneBuilder

TNP is designed for single-domain VHH nanobodies and uses nanobody-specific CDR3 descriptors and reference bands. TAP2 profiles conventional paired VH/VL antibodies against antibody clinical-reference distributions, so its values and thresholds should not be transferred to nanobodies.

ImmuneBuilder is appropriate when the main objective is immune-receptor structure prediction. TNP uses its NanoBodyBuilder2 model as one stage of a broader developability profile. BioPhi addresses sequence humanness and humanization, which is a separate question from the modeled CDR and surface properties reported by TNP.

Reproducibility and limitations

  • Predicted-structure dependence: NanoBodyBuilder2 has no seed setting. Repeated predictions can change compactness, PSH, PPC, PNC, annotated structures, and sometimes a flag near a threshold.
  • Small clinical reference set: The thresholds come from 36 clinical-stage nanobody sequences and predicted structures. They describe that population rather than every viable VHH scaffold or format.
  • Screening rather than diagnosis: The published comparison found that computational metrics and experimental assays provide complementary, sometimes discordant views of developability. Experimental testing remains necessary.
  • Construct differences: TNP analyzes an isolated VHH model. Experimental data in the study were collected from VHH domains expressed as Fc-fused IgG constructs, whose biophysical behavior can differ from isolated nanobodies.
  • Scale sensitivity: Changing the hydrophobicity scale changes PSH and can change its flag. Candidate comparisons should keep the scale fixed.
  • Versioned thresholds: TNP's authors expect the clinical guidelines to evolve as more nanobodies progress through trials. ProteinIQ keeps each saved run tied to its reported TNP version so its values and thresholds remain interpretable.

Table of contents

Related tools

PolyXpert

PolyXpert

Predict low or high antibody polyreactivity from paired VH and VL variable-domain sequences with the source PolyXpert ESM-2 classifier.

antibodytherapeutics+5
Aggrescan3D

Aggrescan3D

Static-mode Aggrescan3D analysis for per-residue aggregation propensity from a single protein structure.

protein-analysisproperty-prediction+3
Chou-Fasman

Chou-Fasman

Predict protein secondary structure using the classic Chou-Fasman algorithm based on amino acid propensities

protein-analysisstructure-prediction+2
DeepSP

DeepSP

Predict 30 antibody spatial descriptors from paired heavy- and light-chain variable-domain sequences, including SAP-positive and positive/negative SCM values across CDR and variable-domain regions.

protein-analysisdeep-learning+2
DeepViscosity

DeepViscosity

Classify paired monoclonal antibody Fv sequences as low viscosity (at or below 20 cP) or high viscosity (above 20 cP) at 150 mg/mL, with ensemble probabilities and 30 DeepSP descriptors.

protein-analysisdeep-learning+2
EvoIF

EvoIF

Score protein mutations with evolutionary profiles from homologous sequences and inverse folding. EvoIF returns a dimensionless log-odds score for each submitted single or multi-site mutation.

protein-analysisproperty-prediction+3
PROPKA 3

PROPKA 3

Predict pKa values of ionizable groups in proteins and protein-ligand complexes from 3D structure. PROPKA calculates environment-driven pKa shifts for standard ionizable residues, terminal groups, and supported ligand atom types.

protein-analysisproperty-prediction+3
Prot2Prop

Prot2Prop

Predict multiple protein developability properties from amino-acid sequences using a multitask ProstT5 adapter.

protein-analysisdeep-learning+5
ThermoMPNN

ThermoMPNN

Predict protein thermostability changes (ΔΔG) for point mutations using a graph neural network. Enables computational saturation mutagenesis screening to identify stabilizing mutations.

protein-analysisproperty-prediction+3
AllMetal3D

AllMetal3D

Predict metal and water binding sites in protein structures using 3D convolutional neural networks (AllMetal3D + Water3D).

structure-analysisdeep-learning+3