TL;DR
- DR-BERT predicts a continuous disorder score from 0 to 1 for each residue using only the protein sequence. It does not require a multiple sequence alignment or a structure.
- Paste one raw sequence or a FASTA batch of up to five sequences into the ProteinIQ DR-BERT webserver. The model scores the first 1022 residues of each sequence.
- Interpret broad, contiguous high-scoring regions more cautiously than a binary cutoff. ProteinIQ does not impose a disorder threshold that is absent from the source scoring program.
- Cross-check important predicted regions with experimental annotations, another disorder predictor, structure-confidence evidence, and the biological context of the protein.
DR-BERT predicts which residues in a protein sequence are likely to belong to intrinsically disordered regions. It is useful for locating flexible tails, linkers, and other candidate regions that may not adopt one stable structure, but its scores are predictions rather than experimental evidence or direct annotations of function.[1]
For a first run:
Open DR-BERT online
Open the ProteinIQ DR-BERT webserver.
Add the protein sequences
Paste one raw amino acid sequence or a FASTA batch of up to five sequences. DR-BERT scores the first 1022 residues of each sequence.
Submit the job
DR-BERT has no scientific settings, so the submitted sequence determines the prediction.
Inspect the score profile
Look for sustained high-scoring regions instead of treating one value as a universal disorder cutoff.
Download and validate the results
Save the residue tables and native output, then compare important regions with experimental annotations or another disorder predictor.
What is DR-BERT?
DR-BERT stands for Disordered Region prediction using Bidirectional Encoder Representations from Transformers. It is a compact protein language model trained to predict intrinsic disorder directly from amino acid sequence.[1]
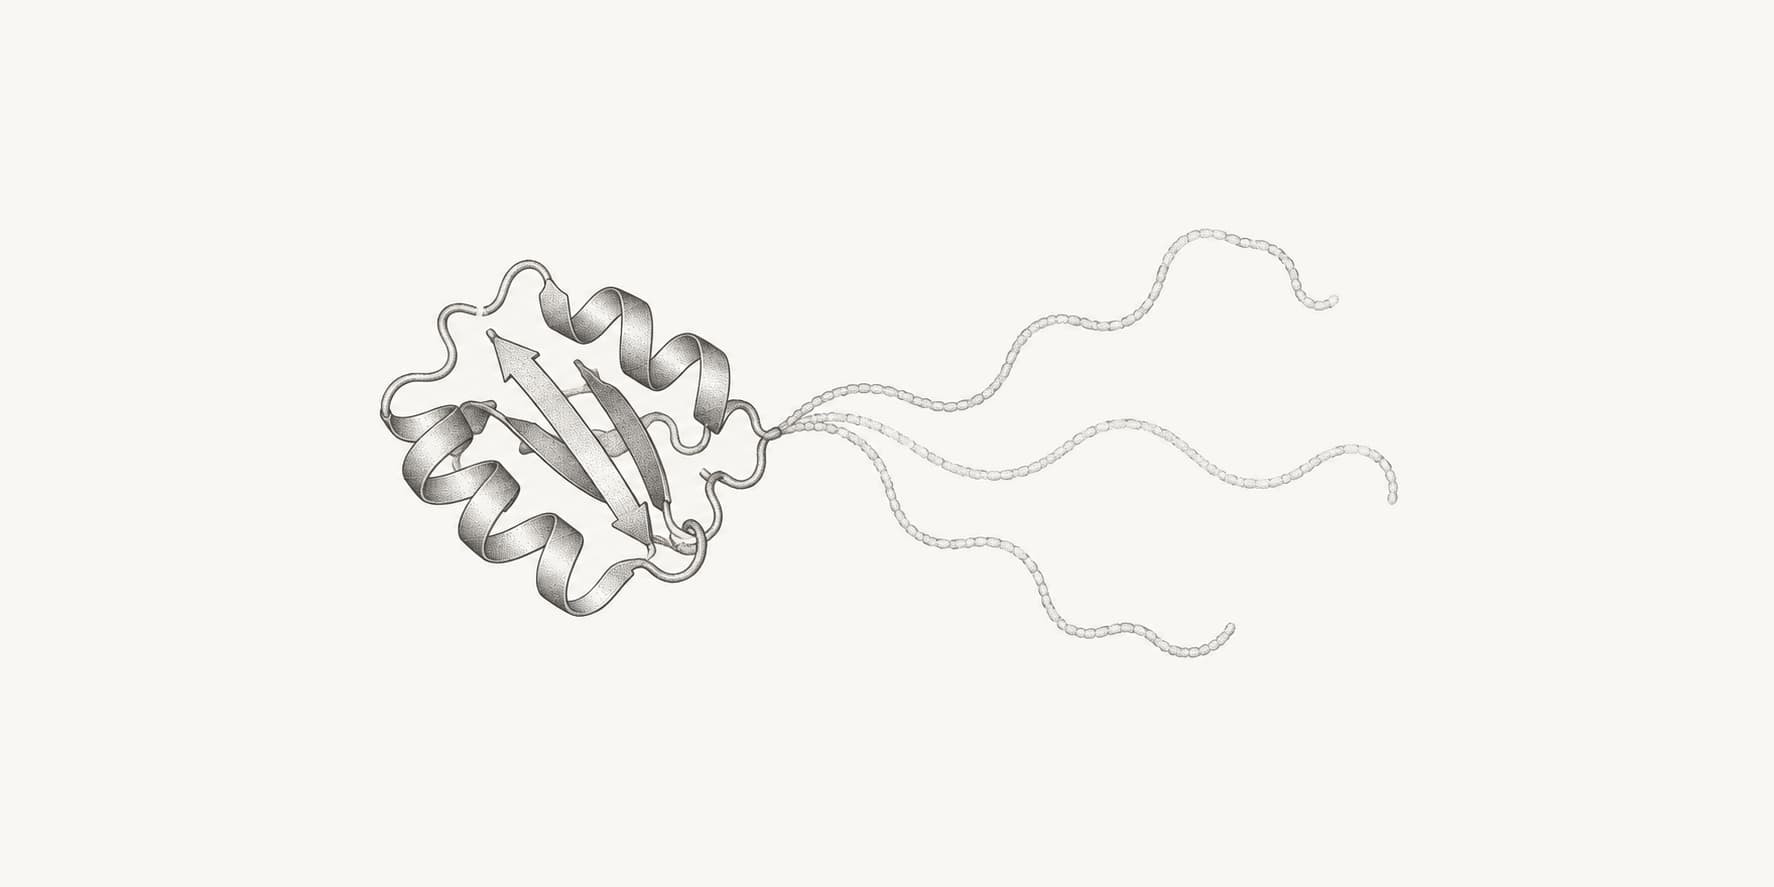
An intrinsically disordered region (IDR) is a continuous stretch of a protein that does not settle into one stable three-dimensional fold under the conditions in which it is observed. Instead, it can occupy an ensemble of conformations. Disorder is not the same as being biologically unimportant. Experimentally supported IDRs participate in binding, regulation, signaling, linkers, and other functions, and DisProt curates both their positions and the evidence used to establish them.[3]
The distinction is also not perfectly binary. CAID2 describes protein disorder as context-dependent and distributed along a continuum between fully disordered states and folded proteins with dynamic regions. A region can also fold after binding a partner or under a different chemical environment.[4]
DR-BERT is therefore best used as a residue-level hypothesis generator. It can identify regions worth examining, but it cannot by itself tell you why a region is disordered, which partner it binds, whether it drives phase separation, or whether it is disordered in every biological condition.
How does DR-BERT work?
The webserver is simple because the trained model has no scientific settings to tune, not because the model itself is trivial. DR-BERT first learned general protein-sequence patterns and was then trained to convert those patterns into one disorder score per residue.[1]
1. Each amino acid becomes a token
DR-BERT reads a protein as an ordered sequence of amino acid tokens. A token is simply the model's numerical representation of one residue. Positional information is added so that two identical amino acids at different sequence positions can be treated differently.
Each token begins as a 768-value vector, often called an embedding. This is not yet a disorder score. It is a working representation that the transformer layers update as they process the sequence.[1]
2. Pretraining teaches general protein-sequence context
Before learning the disorder task, DR-BERT was pretrained on 6,564,742 proteins sampled from UniRef90. During masked language modeling, 15% of the amino acid tokens were hidden and the model learned to recover them from the surrounding sequence.[1]
For example, if one residue is hidden, the model must use the residues before and after it to estimate which amino acid belongs there. Repeating this task across millions of proteins teaches recurring sequence relationships without requiring disorder annotations. Pretraining therefore builds general sequence representations; it does not yet tell the model which residues are disordered.
3. Fine-tuning connects those representations to disorder
The authors then fine-tuned DR-BERT on 2,386 proteins derived from DisProt. They converted the recorded disorder ranges into a residue-by-residue target that marked each position as disordered or not disordered for training.[1]
A token-classification head was added to the pretrained transformer. For each residue, this head compares the ordered and disordered classes and converts the model output into probabilities. The continuous value reported by DR-BERT is the probability assigned to the disordered class, not a direct physical measurement of flexibility.
4. Self-attention gives each residue sequence context
DR-BERT contains six transformer encoder layers, each with 12 self-attention heads. At every layer, the representation of a residue can be updated using information from other residues in the submitted sequence. Different attention heads can learn different relationships in parallel.[1]
This is why DR-BERT is not equivalent to applying a fixed amino acid propensity or a short sliding window. The same local motif can receive a different score when it appears in a different sequence context. The paper's RPB6 analysis showed deeper-layer attention patterns that separated its disordered N-terminal region from the more ordered portion of the protein.[1]
Attention maps show how the model distributed attention across sequence positions, but they do not by themselves explain a biological mechanism or prove why a region is disordered.
5. The trained model returns one score per residue
At prediction time, the published scoring script keeps the first 1022 amino acids, adds the model's special boundary tokens, runs the token-classification model, applies a softmax transformation, and removes the two boundary positions. The result is one value from 0 to 1 for each scored amino acid.[2]
The model does not build a multiple sequence alignment, search for homologs, or require a structure. ProteinIQ preserves the continuous source scores, maps them back to residue identities and positions, and provides the table, CSV, and score profile used elsewhere in this guide.
What did the published benchmarks show?
The DR-BERT paper evaluated the model on held-out CAID and CAID2 datasets. The authors reported an AU-ROC of 0.82 on the CAID1 comparison and found that DR-BERT outperformed the compared methods on two of four CAID2 test cases while remaining competitive on the others.[1]
Those results support the method, but they do not create a universal score threshold or guarantee that DR-BERT is best for every protein. CAID2 found that predictor rankings vary with the benchmark definition and that users may need to balance predictive performance, runtime, and the type of disorder being studied.[4]
How to use DR-BERT online
The online workflow has no model settings to tune. Most of the scientific judgment goes into choosing the sequence context, preserving coordinates, and interpreting the score profile.
1. Open DR-BERT
Go to DR-BERT online. The current ProteinIQ implementation runs the published scoring program with a pinned model checkpoint and returns both the native score file and easier-to-read derived outputs.
Each job currently costs 10 credits and accepts up to five sequences. The exact quote appears before submission.
2. Prepare the protein sequence
Use a raw one-letter amino acid sequence or FASTA. FASTA is preferable when you want to preserve an accession, protein name, organism, or original coordinate range.
For one sequence, a concise header is enough:
>sp|P61218|RPAB2_HUMAN
MSDNEDNFDGDDFDDVEEDEGLDDLENAEEEGQENVEILPSGERPQANQKRITTPYMTKY
This sequence excerpt comes from the repository's official sample.fa input.[2]
For a batch, place each sequence in its own non-empty FASTA record. The webserver accepts up to five records in one job and keeps complete FASTA headers in the prepared input and native output.
Before submitting:
- remove numbering, alignment gaps, punctuation, and annotation symbols;
- use one-letter protein sequence characters;
- confirm that each FASTA header is followed by sequence data;
- give each record an identifier that will still make sense in a downloaded CSV;
- preserve the original accession and coordinate range when submitting a fragment.
Raw sequence input is converted to uppercase and has whitespace removed. FASTA records retain their submitted headers and sequence text, so clean FASTA is the safest choice for reproducibility.
3. Decide how to handle proteins longer than 1022 residues
DR-BERT scores the first 1022 residues of each submitted sequence. A longer sequence is accepted, and the complete sequence remains in the native pickle and prepared FASTA, but the derived score table stops at residue 1022.
If the biological region of interest lies after residue 1022, submit a separate, biologically meaningful segment. Put the source coordinates in the header:
>protein_name residues_950_1450
[sequence for original residues 950 to 1450]
Avoid splitting a long protein into arbitrary independent chunks without recording the boundaries. Because DR-BERT uses sequence context, a residue near a fragment edge is evaluated with less of its native neighborhood. Overlapping fragments can help you see whether a proposed boundary is stable, but their positions must be mapped back to the original sequence before comparison.
4. Submit the job
Optionally add a job name, then submit. There are no model, threshold, alignment, or database-search settings.
The absence of settings does not make every input equivalent. A full-length natural sequence, an isolated domain, and a short peptide give the model different context. Use the sequence form that matches the biological question and record any fragment coordinates.
5. Inspect the score profile before choosing boundaries
The Scores view reports:
sequence_idpositionresiduedisorder_score
Start with the SVG score profile. Look for regions where elevated scores remain coherent across multiple adjacent residues. Then inspect the corresponding table rows to locate the transition and map it to domains, motifs, variants, or construct boundaries.
Do not interpret a single high residue in isolation. A narrow spike may reflect local sequence context, while a broad plateau is a stronger candidate for a sustained disordered segment. The profile is still a model output, so both patterns require supporting evidence.
6. Download the result files
The Files view includes:
dr_bert_scores.pkl, the native DR-BERT DataFrame;dr_bert_residue_scores.csv, the portable per-residue table;dr_bert_score_profile.svg, the score plot;dr_bert_input.fasta, the exact prepared input;run.log, the source, model, runtime, counts, warnings, and artifact record.
Keep the prepared FASTA and run log with any downstream analysis. They establish which sequence, coordinates, and model revision produced the profile.
A reproducible DR-BERT example
The official DR-BERT repository includes sample.fa with two real protein records:[2]
- Human DNA-directed RNA polymerase subunit RPABC2, UniProt
P61218 - African swine fever virus inner membrane protein p54, UniProt
Q65194
Download or copy that file from the source repository, then submit both records together. The result should contain two independently labeled score series and a row for each safely mapped residue.
Use this sample to learn the interface rather than to establish a universal score cutoff. Check that:
- both identifiers are present;
- the score profile contains two series;
- positions begin at 1 for each sequence;
- the CSV and score table agree;
- the prepared FASTA matches the submitted records;
- the run log reports two processed sequences.
The DR-BERT paper provides a separate biological case study for RPB6. The authors found strong disorder support for its N-terminal tail and compared the prediction with NMR evidence for a flexible tail involved in binding the TFIIH p62 PH domain. They also inspected attention maps across all six encoder layers to show how the model used sequence context.[1]
This is a useful interpretation pattern: compare a coherent predicted region with independent structural or biochemical evidence. Do not assume that every high-scoring region has the same function as the RPB6 tail.
How to interpret DR-BERT scores
DR-BERT returns a continuous value from 0 to 1 for each scored residue. Higher values mean stronger model support for disorder. ProteinIQ intentionally preserves those continuous scores and does not add a binary threshold that is absent from the published scoring program.
Read regions, not isolated numbers
A practical interpretation sequence is:
- Locate sustained high-scoring regions in the profile.
- Check whether the transition is gradual or abrupt.
- Map the region to known domains, motifs, linkers, or termini.
- Compare the same region with another independent evidence source.
- Treat the boundary as approximate until experimentally tested.
Do not compare a score of 0.71 in one protein with 0.69 in another as if that difference were experimentally calibrated. The most defensible use is to rank and inspect regions within their sequence and biological context.
Disorder is not a direct function label
A high score does not establish protein binding, RNA binding, DNA binding, phase separation, degradation, or post-translational regulation. Those behaviors require separate evidence or specialized predictors.
Similarly, a low score does not prove that a region is rigid under every condition. Disorder can be conditional, and some IDRs fold when a partner binds. CAID2 specifically emphasizes that different experimental definitions and contexts lead to different disorder references.[4]
Low AlphaFold confidence is related, but not identical
In AlphaFold2, pLDDT values below 50 can be a useful indicator of disorder, and large-scale AlphaFold analyses found that low-confidence regions often correspond to predicted or experimentally annotated disorder.[5]
However, pLDDT is a structure-model confidence measure, not the same output as a sequence-based disorder probability. Low confidence can also reflect missing context, an uncertain domain orientation, unusual sequence, or a region that folds only in a complex. Agreement between DR-BERT and low pLDDT strengthens a hypothesis; disagreement is a reason to investigate, not a reason to discard one result automatically.
How to check a predicted disordered region
Here, checking a prediction means asking whether a high-scoring stretch is supported by independent evidence before treating it as an intrinsically disordered region. It does not mean checking whether the webserver ran correctly, and it does not turn a prediction into experimental proof.
Use several layers of evidence for any decision that affects experiments, construct design, or a proposed biological mechanism.
Check curated experimental annotations
Search DisProt for the protein or a close biological equivalent. DisProt records residue ranges, disorder-related functions, and the experimental evidence supporting each annotation. It is also used to construct CAID reference datasets.[3]
An absent DisProt annotation does not mean the region is ordered. It may simply not have been studied or curated.
Compare predictors with different assumptions
Run at least one method that approaches disorder differently. Agreement between a protein language model and a biophysical or consensus method is more informative than repeating the same model.
Compare the region boundaries, not just a binary label. Two predictors may agree that a tail is disordered while placing the transition tens of residues apart.
Check structure and confidence evidence
If an experimental structure or reliable structure prediction exists, inspect:
- missing residues in experimental models;
- local NMR ensemble variability;
- AlphaFold2 or ESMFold confidence;
- whether the region becomes ordered in a complex;
- whether the modeled construct omits the sequence of interest.
Missing electron density can support flexibility, but it is not by itself a universal proof of intrinsic disorder. Crystal packing, construct design, proteolysis, and experimental quality also affect which residues are observed.
Choose an experiment that matches the claim
Different experiments answer different questions. NMR can characterize residue-level dynamics and disorder, circular dichroism can report global secondary-structure content, SAXS can constrain ensemble dimensions, and limited proteolysis can identify accessible flexible regions. DisProt records multiple evidence types because no single assay captures every flavor of disorder.[3]
For construct design, test more than one boundary when practical. A prediction can identify a transition region, but expression, solubility, folding, and biological activity determine the useful experimental construct.
Common DR-BERT mistakes
Treating the score as a binary fact
The output is continuous. Applying an arbitrary cutoff can make adjacent residues appear qualitatively different when their evidence is nearly the same.
Calling every flexible region intrinsically disordered
Loops in folded proteins, hinge motions, missing density, and low structure confidence are related observations, but they are not interchangeable definitions.
Ignoring sequence context
Submitting only a short motif can change its prediction because the surrounding residues are missing. Use the full natural context when possible, and label any fragments with source coordinates.
Losing coordinates when segmenting long proteins
Positions in the result refer to the submitted sequence. A fragment beginning at original residue 950 still starts at position 1 in its own result, so the offset must be preserved in the FASTA header or analysis notes.
Assuming high disorder identifies function
DR-BERT predicts disorder, not binding partners, molecular recognition features, phase separation, or regulatory sites.
Ignoring a mapping warning
If a source score vector cannot be mapped reliably to the submitted characters, ProteinIQ keeps the native pickle and profile but omits unsafe table and CSV rows. Fix nonstandard sequence text and rerun rather than trying to align those scores manually.
DR-BERT alternatives
No disorder predictor is best for every task. Choose the method according to the evidence and output you need.
| Method | Main approach | Prefer it when |
|---|---|---|
| DR-BERT | Compact protein language model using sequence context | You want fast, alignment-free per-residue scores from sequence |
| IUPred2A | Estimated pairwise interaction energies with context-dependent modes | You want a biophysical perspective or predictions related to redox state and partner-induced folding[6] |
| MobiDB-lite | Consensus across multiple disorder predictors with smoothing and long-region filtering | You want conservative consensus annotations for long IDRs or proteome-scale annotation[7] |
| flDPnn | Deep learning with sequence profiles and predicted disorder-function propensities | You also need hypotheses for protein, DNA, RNA binding, or linker function[8] |
| AlphaFold2 or ESMFold confidence | Structure prediction with per-residue confidence | You need a structural hypothesis and want to compare low confidence with a dedicated disorder predictor[5] |
For important boundaries, use complementary methods rather than selecting a predictor only because it gives the desired answer.
Practical checklist
Before the run:
- Use a raw sequence or clean FASTA with one-letter protein characters.
- Keep accessions and original coordinates in FASTA headers.
- Submit no more than five records.
- Plan separate, labeled segments if the target lies beyond residue 1022.
After the run:
- Inspect the full profile before choosing a boundary.
- Confirm the table, CSV, and prepared FASTA use the expected identifiers.
- Read warnings and the run log.
- Compare candidate regions with another predictor.
- Check DisProt, experimental structures, and structure-confidence evidence.
- Treat construct boundaries and functional interpretations as hypotheses to test.
Protein analysis tools on ProteinIQ
- DR-BERT predicts continuous intrinsic-disorder scores from sequence.
- AlphaFold2 predicts protein structures and reports pLDDT confidence.
- ESMFold provides single-sequence structure prediction and residue confidence without an MSA.
- Protein-Sol predicts sequence-based solubility properties, which answer a different question from intrinsic disorder.
Frequently asked questions
Does DR-BERT require a multiple sequence alignment?
No. DR-BERT uses only the amino acid sequence at prediction time. Its published design avoids explicit evolutionary profiles, structural features, and other precomputed inputs.[1]
What DR-BERT score means a residue is disordered?
ProteinIQ does not impose a classification threshold. Higher scores mean stronger model support for disorder, but boundaries should be interpreted from the continuous profile and validated with independent evidence.
Can DR-BERT score proteins longer than 1022 residues?
The webserver accepts longer proteins, but the source model scores only the first 1022 residues. Submit a separately labeled segment if the region of interest occurs later in the protein.
Can DR-BERT process multiple sequences?
Yes. One job can contain up to five FASTA records. Each sequence receives its own positions and score series.
Does a high DR-BERT score prove that a region drives phase separation?
No. Intrinsic disorder may be relevant to phase separation, but a disorder score does not measure condensate formation, interaction valency, concentration dependence, or cellular conditions.
Is DR-BERT better than AlphaFold pLDDT for finding disorder?
They are different signals. DR-BERT is trained specifically for residue-level disorder prediction from sequence. AlphaFold pLDDT estimates confidence in a predicted structure and can also indicate disorder, but low confidence has other possible causes. Use agreement as supporting evidence and investigate disagreement in context.[4][5]
Can I use DR-BERT to choose protein construct boundaries?
Yes, as one input to the decision. Look for a sustained transition, compare other predictors and structural evidence, preserve required motifs, and test more than one boundary when the experiment permits.