Drug discovery trends are easy to overstate when approval counts, clinical-trial registrations, target classes, AI tools, and R&D spending are mixed together. The most useful numbers keep those categories separate across the same small-molecule discovery, biologics, and clinical-development pipeline.
This page collects current drug discovery and drug development statistics from regulators, trial registries, scientific databases, government reports, and peer-reviewed papers.
Approval output and regulatory speed
Regulatory approval counts are a lagging indicator of drug discovery productivity, but they are still the cleanest public measure of what reached patients after discovery and development.
The caveat is that regulators count different things. FDA CDER novel drug approvals are not the same as EMA marketing-authorization recommendations, and CDER figures exclude some products handled by other FDA centers.
- FDA CDER approved 46 novel drugs in 2025, made up of 34 new molecular entities and 12 therapeutic biologics.[1]
- FDA CDER said its 46 novel drug approvals in 2025 were above the historical annual average of 38 since 2007 and similar to the previous 5-year average of about 47 per year.[1]
- FDA CDER listed 23 novel drug approvals in 2026 through June 26, 2026, with the page current as of that date.[2]
- FDA CDER reported that 39 of its 46 novel drug approvals in 2025, or 85%, were approved in the first review cycle.[1]
- FDA CDER reported that 33 of its 46 novel drug approvals in 2025, or 72%, used at least one expedited development or review program.[1]
- EMA recommended 104 human medicines for marketing authorization in 2025, including 38 medicines with new active substances.[3]
- EMA recommended 41 biosimilar products in 2025, while FDA CDER approved 18 biosimilars in 2025 and had approved 81 biosimilars for 20 reference products since 2015.[3][1]
Clinical-trial pipeline volume
ClinicalTrials.gov is not a perfect census of global research, but it is one of the most transparent ways to track development activity. Counts can change daily as records are added, updated, terminated, or reclassified.
The figures below use ClinicalTrials.gov API queries run on July 1, 2026. The first returned record in the total-studies query showed a versionHolder date of 2026-06-30.
- ClinicalTrials.gov returned 591,832 total registered studies on July 1, 2026.[4]
- ClinicalTrials.gov returned 451,610 interventional studies on July 1, 2026.[5]
- ClinicalTrials.gov returned 218,766 interventional drug or biological studies on July 1, 2026.[6]
- ClinicalTrials.gov returned 37,846 interventional drug or biological studies that were recruiting, not yet recruiting, or active but not recruiting on July 1, 2026.[7]
- Calculated: interventional drug or biological studies made up 48.4% of interventional ClinicalTrials.gov records on July 1, 2026; the calculation is 218,766 divided by 451,610.[6][5]
- FDA CDER received more than 3,000 investigational new drug applications, about 12,300 clinical protocols, and more than 4,500 formal meeting requests in 2025.[1]
Modalities and target classes
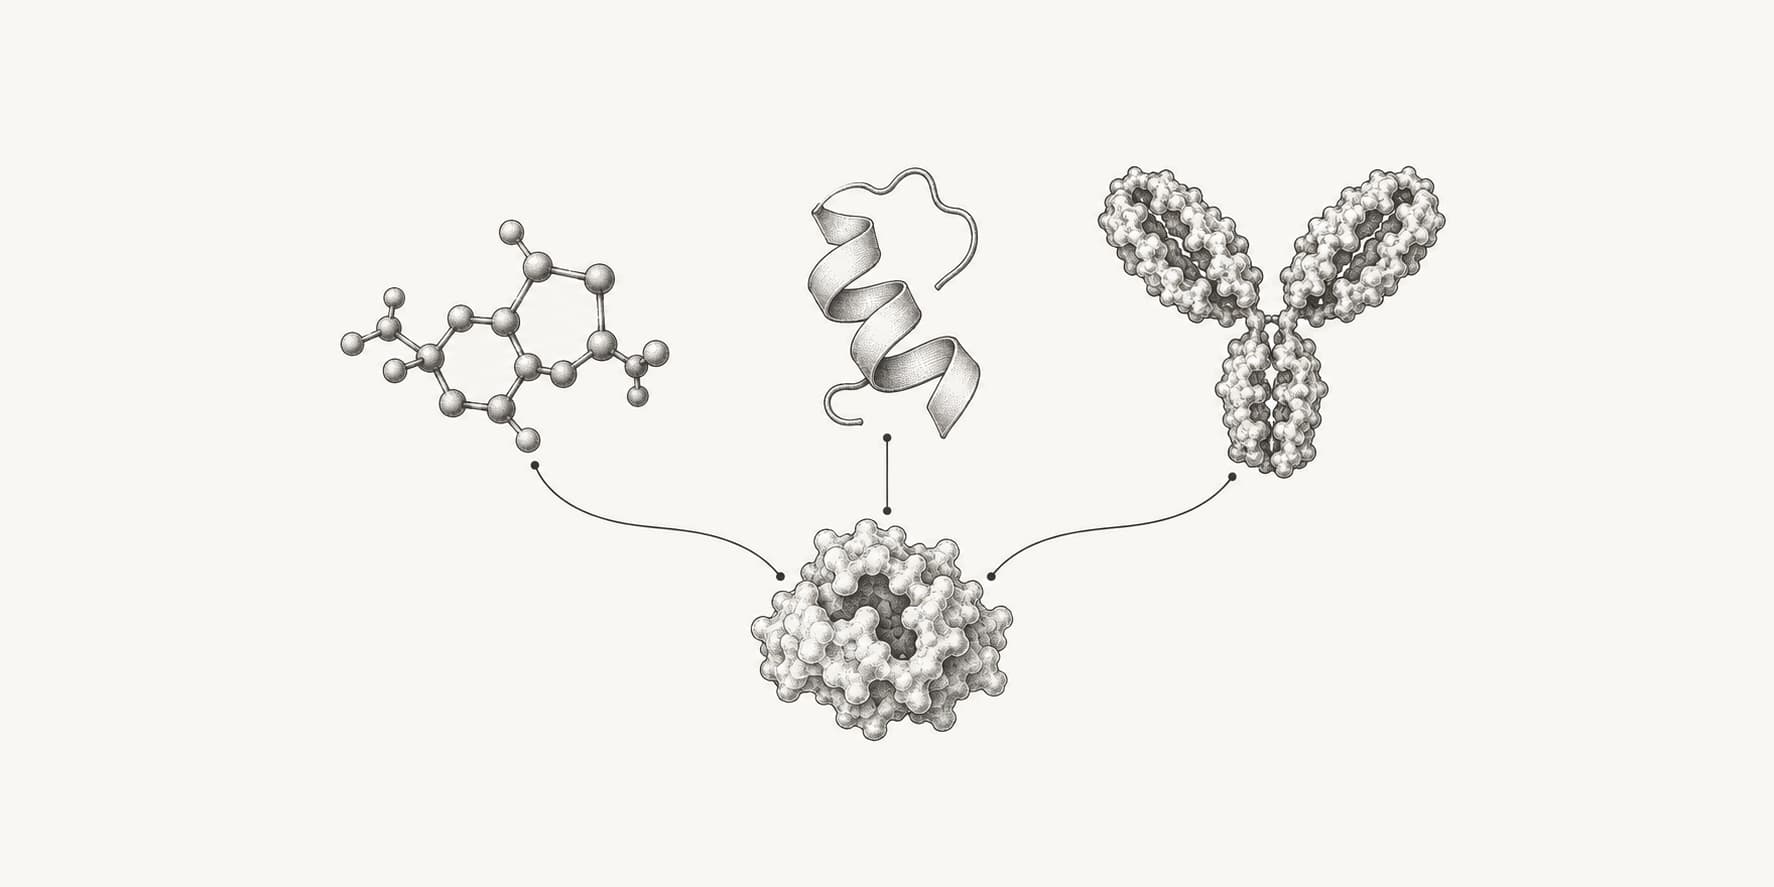
Current trends in drug discovery include more work beyond conventional oral small molecules, but modality categories overlap. A peptide can act on a GPCR, a biologic can have an orphan indication, and a cell therapy is counted differently from a CDER novel drug.
Target-class statistics are useful because they show where discovery activity is concentrated. GPCRs and kinases remain major target families, while peptides and cell and gene therapies show how delivery, manufacturing, and disease selection shape new programs.
- Calculated: FDA's Office of Therapeutic Products page listed 49 licensed cellular and gene therapy products as of April 23, 2026; the count is the 49 product rows in the FDA table.[12]
- A 2025 peptide therapeutics review reported 38 peptide drugs in Phase 3 clinical trials and 42 Phase 3 route-or-indication entries.[13]
- A 2025 peptide therapeutics review reported that routes of administration for FDA-approved peptide-based drugs from 2014 to 2024 were 13 of 29 subcutaneous, 10 of 29 intravenous, and 5 of 29 oral.[13]
- A 2025 GPCR drug review reported that 516 approved drugs, or 36% of all approved drugs in its dataset, mediate their actions through GPCRs.[14]
- A 2025 GPCR drug review reported 337 GPCR-targeting agents in clinical trials, 121 GPCR targets for approved drugs, and 30 additional receptors that had entered clinical trials.[14]
- Roskoski's 2026 kinase update reported 94 FDA-approved protein kinase inhibitors through October 31, 2025, including 10 approved in 2025.[15]
- Roskoski's 2026 kinase update reported that 90 of 94 FDA-approved protein kinase inhibitors were orally bioavailable and that 45 of 94 had at least one Lipinski rule-of-five violation.[15]
AI, structure prediction, and human genetics
AI drug discovery trends need careful wording because "AI" can mean target selection, molecule generation, image analysis, trial design, or regulatory decision support. The FDA numbers below are about submissions with AI components, not proof that AI-discovered medicines are broadly replacing conventional discovery.
The most defensible public trend is that discovery teams now have much larger computational and genetic evidence bases. Those datasets can change target prioritization even when the final clinical-development risk remains high.
- FDA said CDER had experience with more than 500 submissions containing AI components from 2016 to 2023.[8]
- FDA said its January 2025 draft guidance on AI in drug and biological product regulatory decision-making was informed by more than 800 comments on its May 2023 AI discussion paper.[8]
- FDA's January 2025 AI draft guidance proposed a risk-based credibility assessment framework for AI models used to support regulatory decisions on drug or biological product safety, effectiveness, or quality.[9]
- AlphaFold DB v6 contains 241,070,489 predicted protein structures, including 40,054 isoforms, in the release synced to UniProt 2025_03.[10]
- A 2024 Nature analysis estimated that drug mechanisms with human genetic support were 2.6 times more likely to succeed clinically than mechanisms without human genetic support.[11]
Precision medicine and rare-disease discovery
Precision medicine trends show up in orphan designations, first-in-class mechanisms, biomarker-selected programs, and genetics-backed targets. These categories measure different things, but all point to narrower biological hypotheses and more defined patient populations.
The main caveat is that precision does not remove clinical risk. It can improve evidence quality for some programs while making enrollment, endpoint selection, and commercial scale more complex.
- FDA CDER identified 20 of 46 novel drug approvals in 2025, or 43%, as first-in-class therapies.[1]
- FDA CDER reported that 23 of its 46 novel drug approvals in 2025, or 50%, had orphan drug designation.[1]
- EMA recommended 16 medicines for rare diseases in 2025.[3]
- The BIO 2011-2020 clinical-development benchmark reported a 15.9% Phase 1-to-approval likelihood for programs using patient preselection biomarkers, compared with 7.6% for programs without biomarkers.[17]
- Calculated: biomarker-preselected programs had about 2.1 times the Phase 1-to-approval likelihood of programs without biomarkers in the BIO 2011-2020 benchmark; the calculation is 15.9% divided by 7.6%.[17]
Development risk and unmet-need gaps
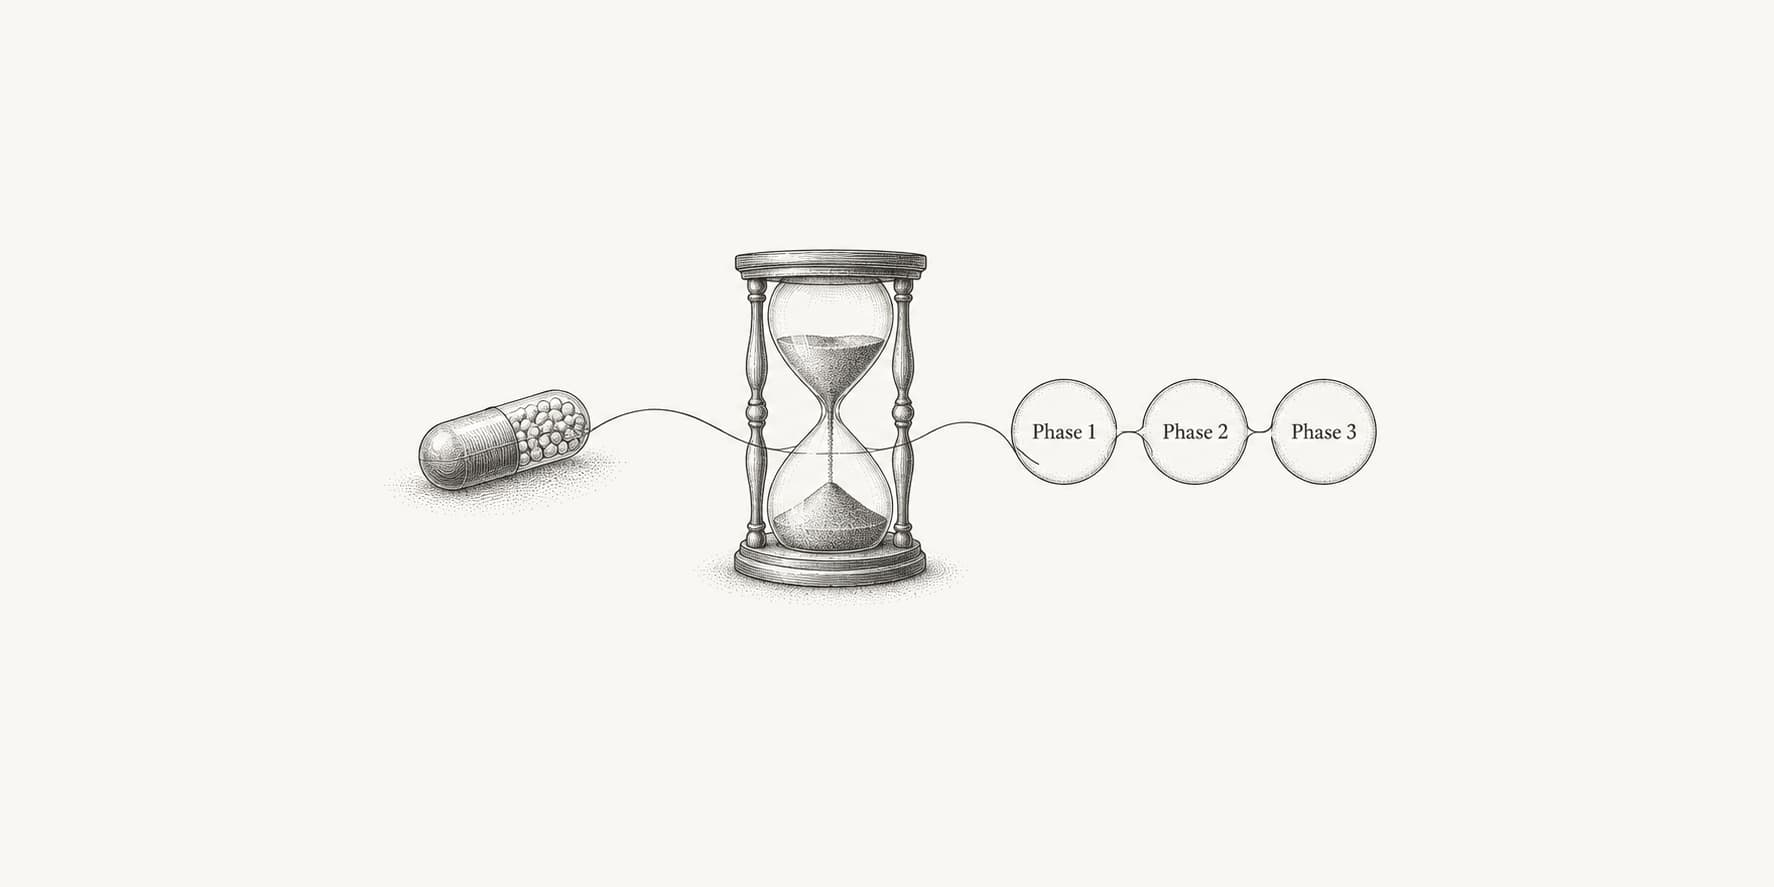
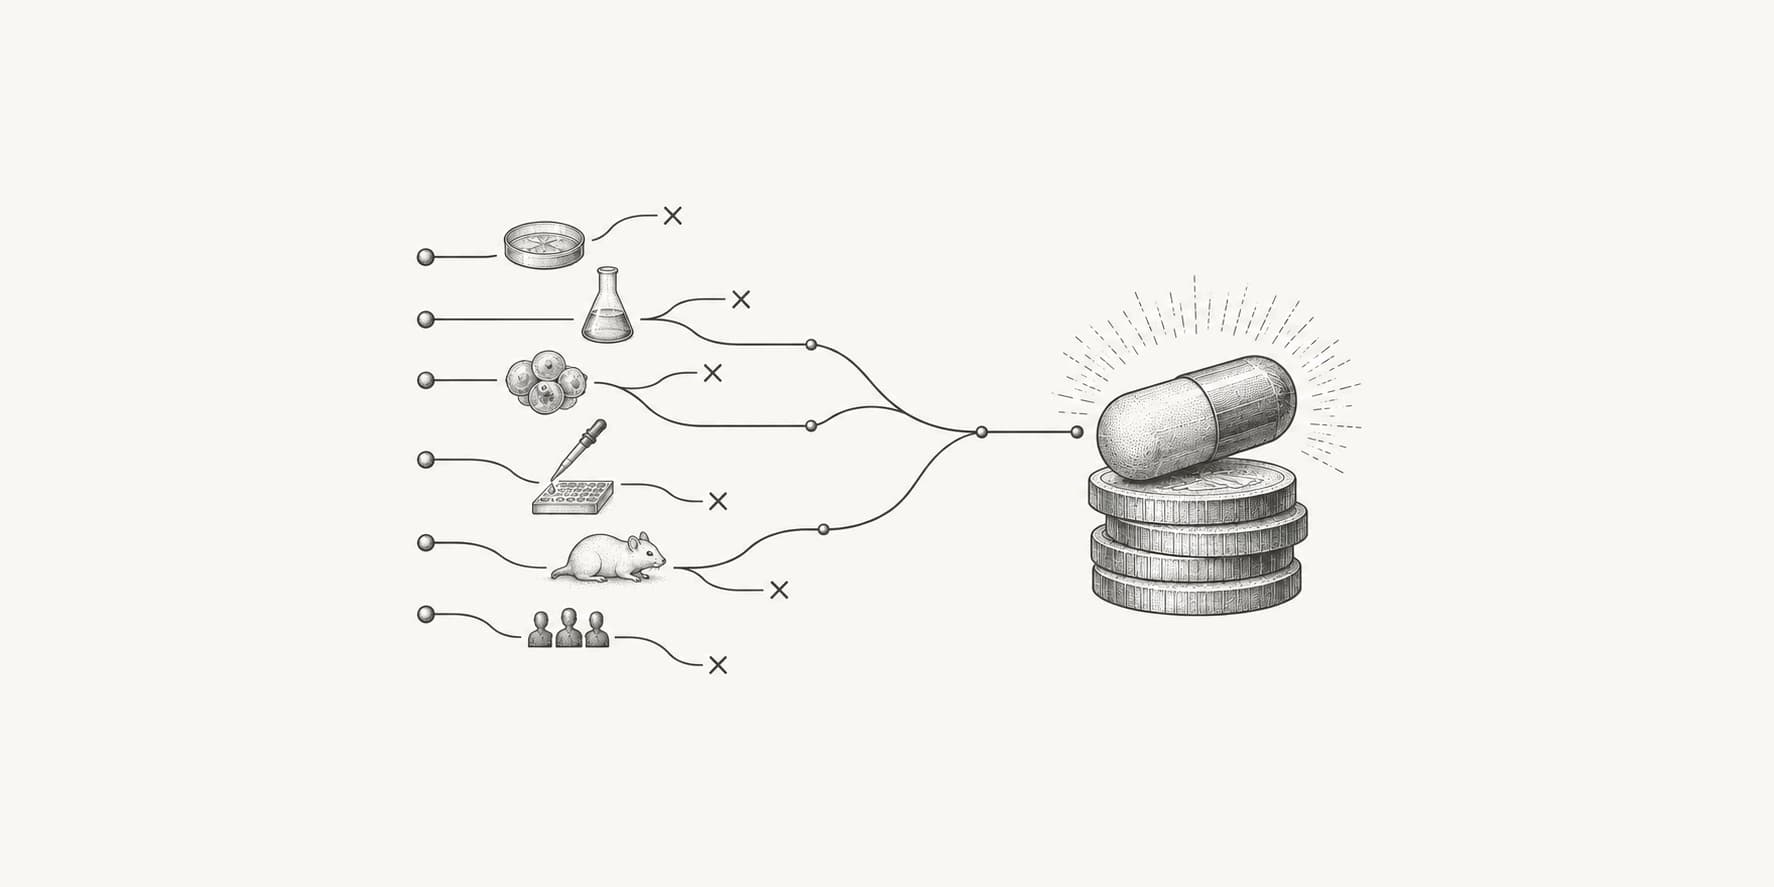
Recent trends in drug discovery and development are not all expansion stories. Clinical attrition and cost still shape the same pipeline, which is why clinical-trial failure rates and drug development cost sit beside approval, modality, and AI-adoption statistics.
The antibacterial pipeline is a useful reality check because high unmet need does not automatically create a large or durable development pipeline. CNS and oncology also remain high-risk areas despite major investment.
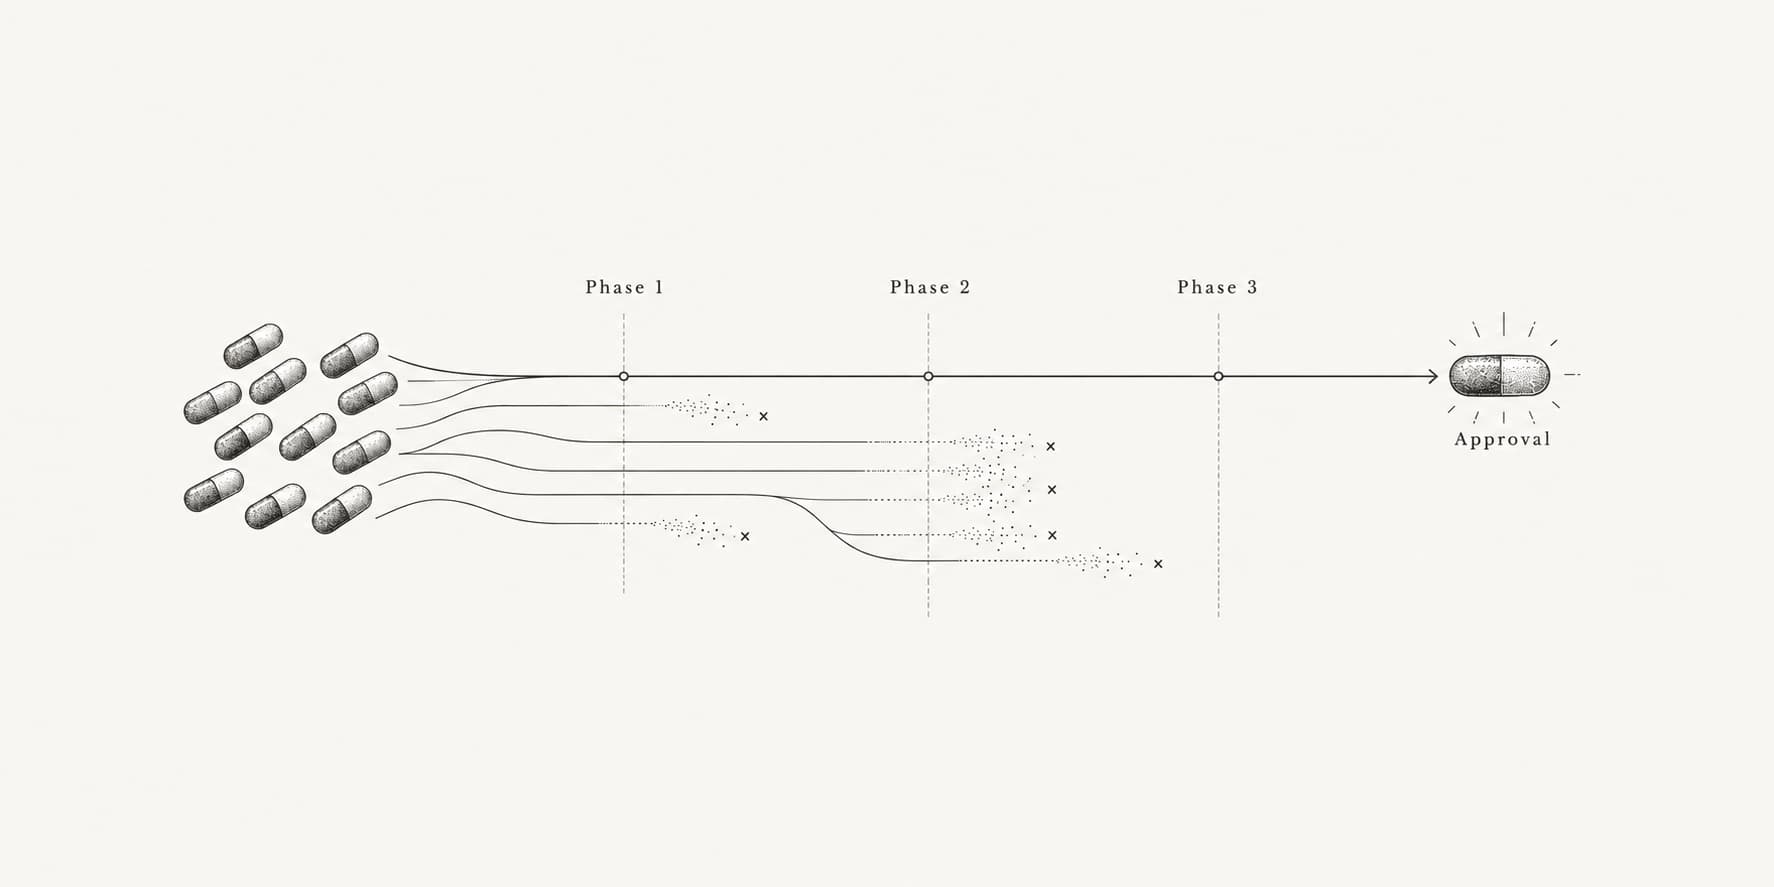
- The BIO 2011-2020 benchmark reported a 7.9% Phase 1-to-approval likelihood for drug development programs, implying a 92.1% failure rate; the calculation is 100% minus 7.9%.[17]
- The BIO 2011-2020 benchmark reported Phase 1-to-approval likelihoods of 5.3% for oncology and 5.9% for neurology.[17]
- The Congressional Budget Office reported that the pharmaceutical industry spent USD 83 billion on R&D in 2019, about 10 times the annual amount spent in the 1980s after adjusting for inflation.[18]
- WHO reported 90 antibacterials or antibacterial combinations in the global clinical pipeline from Phase 1 to NDA/MAA as of February 15, 2025, including 50 traditional agents and 40 non-traditional agents.[16]
- WHO reported that the clinical antibacterial pipeline decreased from 97 agents in 2023 to 90 agents by February 15, 2025.[16]
- WHO reported that between December 2023 and February 2025, 4 of 97 clinical antibacterial agents were approved, 1 of 97 entered NDA/MAA review, and 10 of 97 were withdrawn.[16]
- WHO reported that 5 of 27 traditional agents targeting bacterial priority pathogens, or 19%, showed no known cross-resistance, and that only 5 potentially innovative products were active against WHO critical-priority pathogens.[16]
Methodology and citation
This article keeps regulator-specific definitions separate: FDA CDER novel drug approvals, EMA human medicine recommendations, ClinicalTrials.gov registrations, FDA OTP cellular and gene therapy product rows, and WHO antibacterial pipeline counts are not interchangeable measures.
ClinicalTrials.gov counts were queried through the API on July 1, 2026 and can change after that date. Calculated values are labeled in the relevant bullets and the arithmetic is shown in plain English.
- The 48.4% ClinicalTrials.gov calculation divides 218,766 interventional drug or biological studies by 451,610 interventional studies.[6][5]
- The 49 cellular and gene therapy product count is a row count from FDA's Office of Therapeutic Products table, which was current as of April 23, 2026.[12]
- The 2.1 times biomarker calculation divides the BIO benchmark's 15.9% Phase 1-to-approval likelihood for patient-preselected programs by 7.6% for programs without biomarkers.[17]
- The 92.1% clinical-development failure rate subtracts the BIO benchmark's 7.9% Phase 1-to-approval likelihood from 100%.[17]
To cite this page: ProteinIQ. "Drug discovery trends statistics [2026]." Updated July 1, 2026. Accessed [your access date]. https://proteiniq.io/guides/drug-discovery-trends