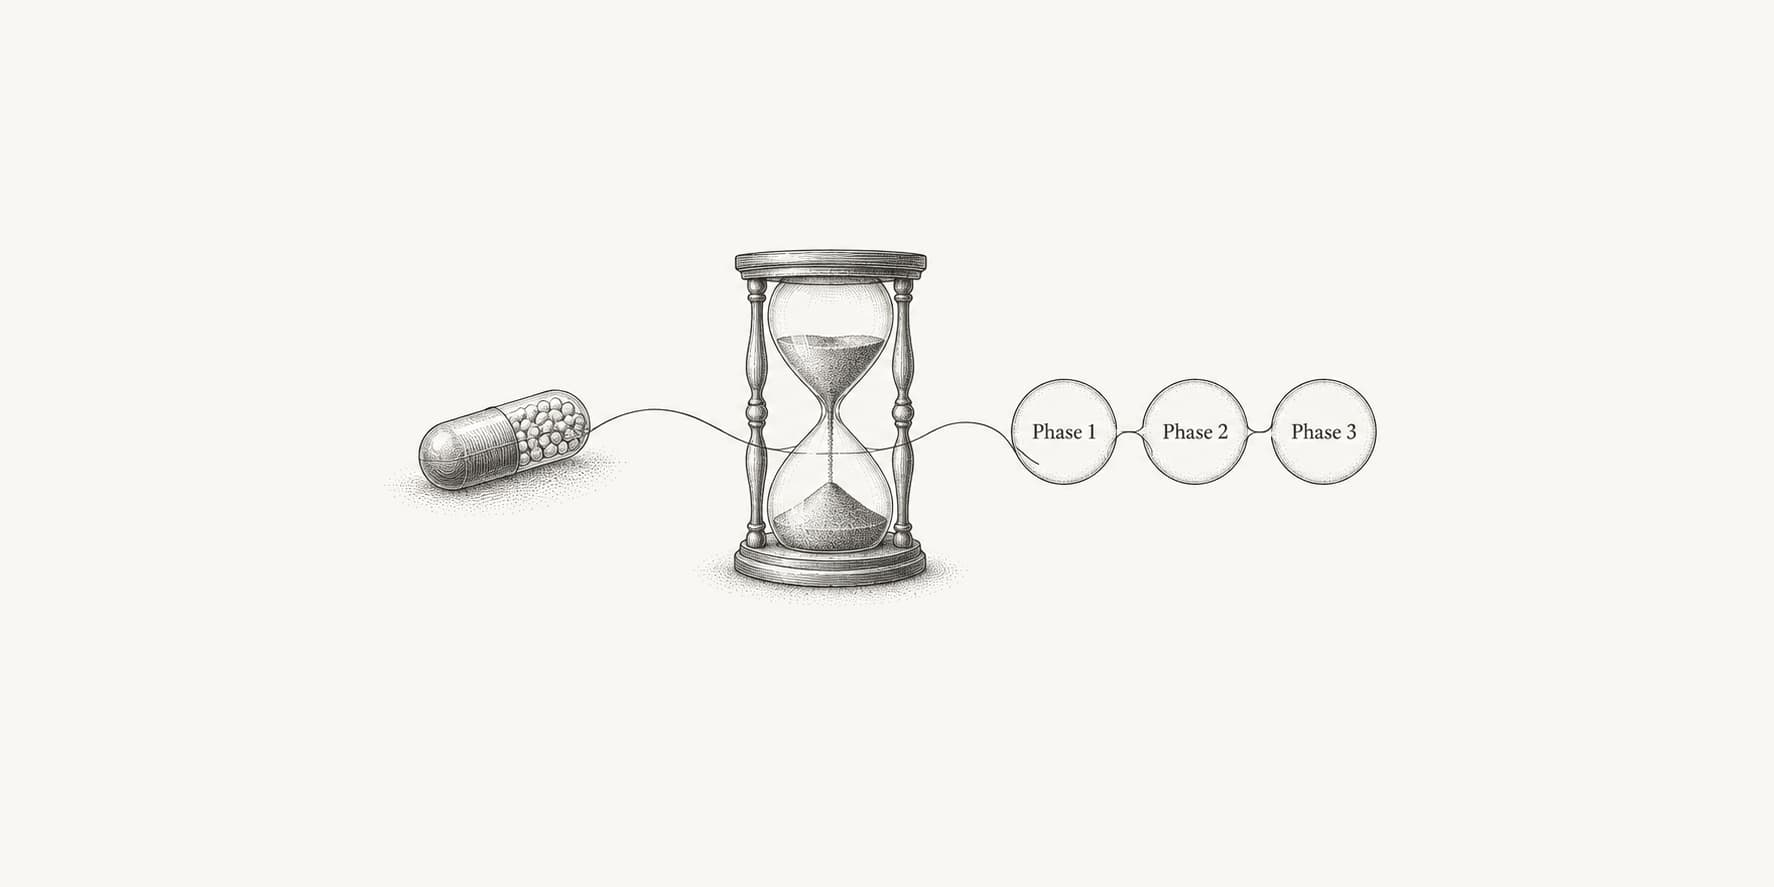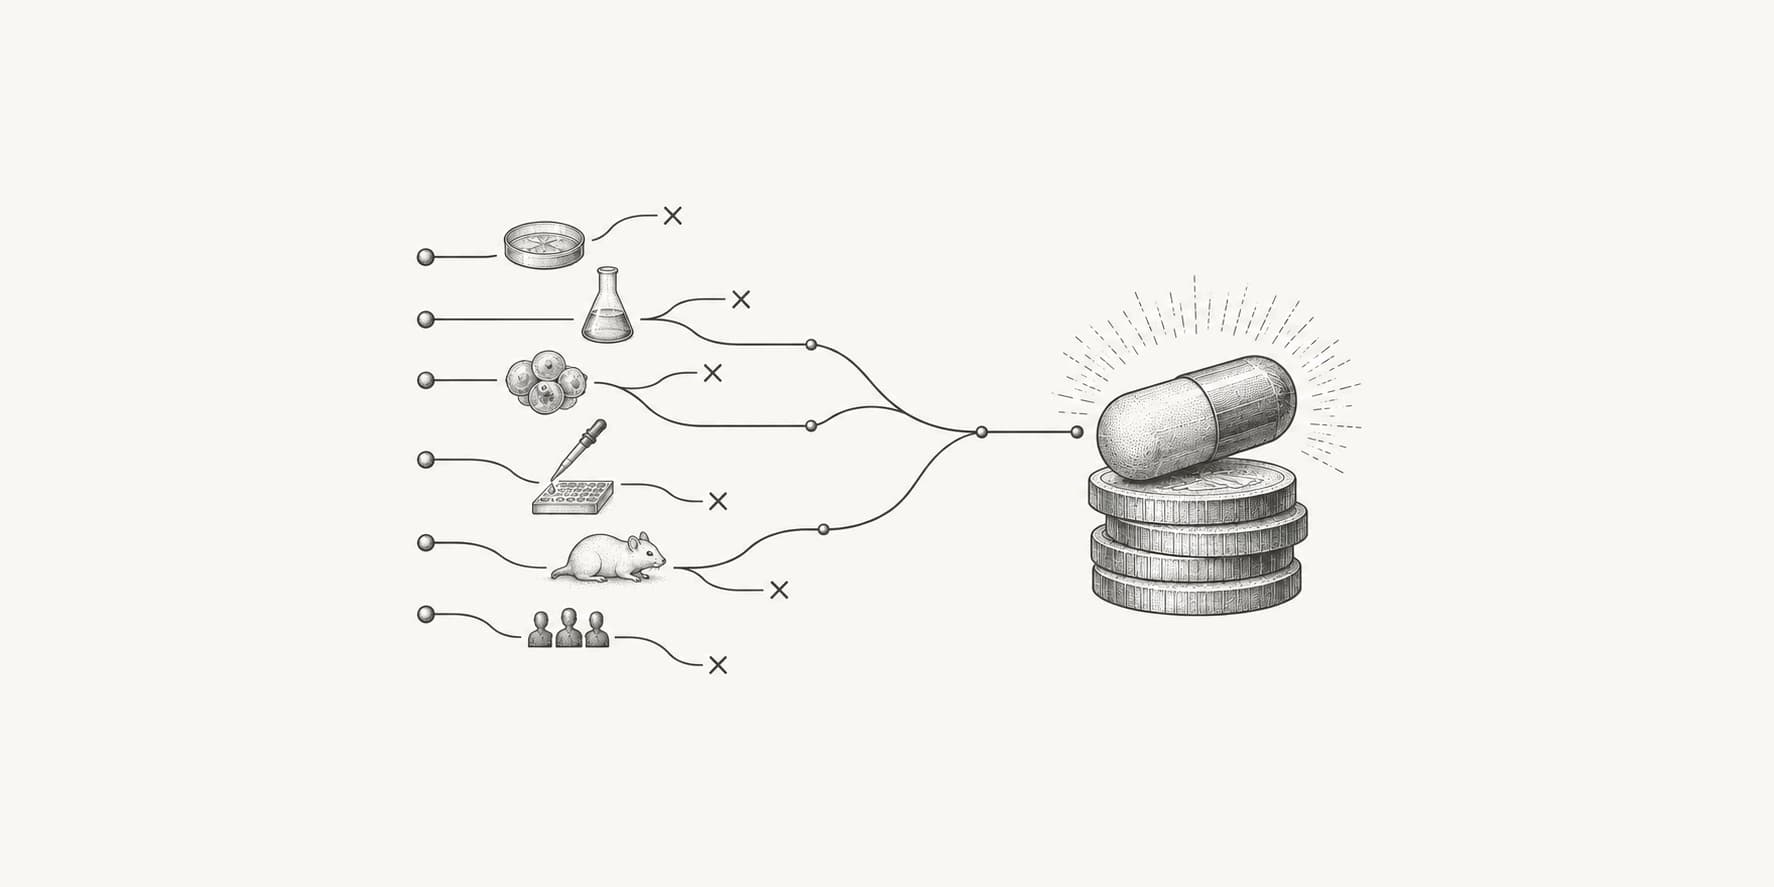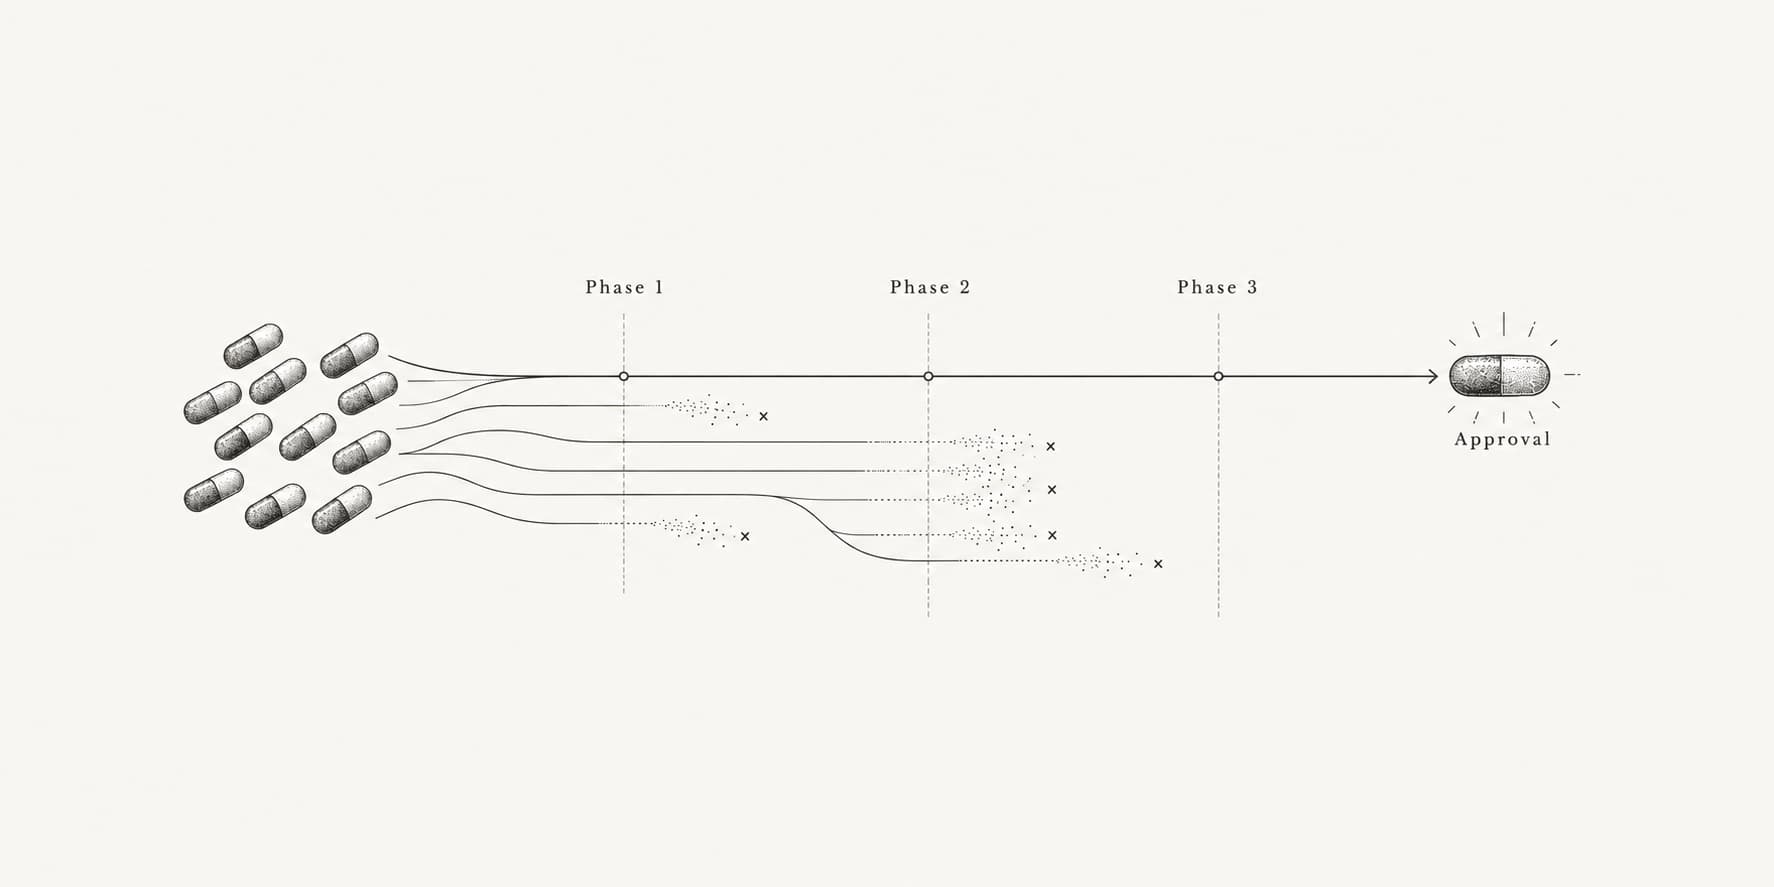
About nine in ten drug-development programs entering human clinical testing do not reach approval. Three widely cited historical estimates imply failure rates of approximately 86% to 93%, depending on the population and calculation method.
These figures describe the path from Phase 1 to approval. Our separate analysis of 33,667 registered drug or biological trials found that 13.9% were marked terminated. The two percentages answer different questions: whether a development program reaches approval, and whether an individual study stops early.
How often do individual clinical trials stop early?
We analysed ClinicalTrials.gov records for 33,667 interventional drug or biological trials with actual starts in 2015-2020, covering Phase 1 through Phase 3, including combined phases. In the September 2026 snapshot, 4,692 trials, or 13.9%, had a terminated status. Phase 1/2 had the highest recorded proportion, at 18.6%. These are our calculations from registry records, rather than a published estimate of drug-development failure.[9]
| Registered phase | Eligible trials | Terminated | Share |
|---|---|---|---|
| Phase 1 | 9,825 | 1,164 | 11.8% |
| Phase 1/2 | 3,347 | 624 | 18.6% |
| Phase 2 | 11,971 | 1,906 | 15.9% |
| Phase 2/3 | 1,344 | 168 | 12.5% |
| Phase 3 | 7,180 | 830 | 11.6% |
| All included phases | 33,667 | 4,692 | 13.9% |
Source: our analysis of ClinicalTrials.gov. The downloadable results retain exact counts and unrounded percentages.[9]
This is the proportion recorded as terminated at extraction, not the eventual probability of termination. We retained 3,341 ongoing, 122 suspended and 3,857 unknown-status trials in the denominator; 21,655 were completed. A completed trial may have negative results, while a terminated trial may have stopped because recruitment was too slow. Neither status alone establishes whether a drug works. The cohort includes existing medicines, combinations and all sponsor types, so it is broader than a pipeline of novel drugs seeking approval.
Restricting the calculation to trials starting in 2015-2019 gave a similar recorded termination proportion: 3,689 of 26,676, or 13.8%. That sensitivity check allows more time for follow-up, but does not resolve incomplete or stale reporting. Differences between phases are descriptive; we did not adjust for disease, sponsor or follow-up time.
What reasons did terminated trials report?
Recruitment difficulties appeared in 120 of 400 randomly sampled terminated trials, or 30.0%. This was the most frequent label in our exploratory review of their reported stopping explanations. The corresponding 95% Wilson interval was 25.7% to 34.7%; it describes sampling uncertainty, not errors or omissions in registry reporting or our classification.
Explicit lack of efficacy or activity appeared in 42 records, or 10.5%, with a 95% interval of 7.9% to 13.9%. Safety-related concerns appeared in 16, or 4.0%, with an interval of 2.5% to 6.4%. The safety category includes concerns arising from external evidence or participant exposure risks, so it should not be read as the frequency of demonstrated drug toxicity. We kept explicit commercial or development-strategy changes separate from sponsor decisions with no underlying explanation.
Seventy records, or 17.5%, had missing or unclear explanations, sometimes alongside another interpretable reason. Separately, 39 records, or 9.8%, cited an unspecified sponsor decision. These reporting gaps mean that an unmentioned reason cannot be assumed absent. Multiple labels were allowed, so percentages do not form mutually exclusive shares of one cause.
We developed the classification rules from a separately seeded 30-record pilot, then used a seeded random sample of 400 from all 4,692 terminated records; two records appeared in both samples. One AI assistant read each explanation and assigned labels with written rationales. A second pass revisited 137 records, covering all 111 marked uncertain and a random 40-record audit, with overlap. This repeated review was not independent human validation. The results describe reported explanations and should be treated as exploratory, especially when comparing smaller categories.
Our initial extraction returned 58,303 records. We excluded 16,534 outside the specified phases, 7,508 without an actual start and 594 whose withdrawn or not-yet-recruiting status conflicted with an actual start. These sequential exclusions are mutually exclusive. Each retained NCT identifier counts once; we did not infer drug-program outcomes from trial records.
The methods and reproduction instructions include the query, exclusions, sampling seeds, limitations and links to the frozen source files. Download the full cohort, 400 coded explanations, classification rules and analysis script to inspect or reproduce our calculations.
What percentage of drugs fail clinical trials?
Citeline's 2024 report estimated a 6.7% likelihood of approval for programs entering Phase 1, using transitions recorded during 2014-2023. Its complement is a 93.3% failure rate. This is a historical development benchmark, not a measurement of trials conducted in 2026.[1]
| Study and period | Population and approach | Approval | Failure |
|---|---|---|---|
| Citeline, 2014-2023 | Biomedtracker phase transitions | 6.7% | 93.3% |
| BIO/QLS/Informa, 2011-2020 | Company-sponsored, FDA registration-enabling programs | 7.9% | 92.1% |
| Wong et al., 2000-2015 | Industry-sponsored drug-indication paths reconstructed from trial records | 13.8% | 86.2% |
Sources: Citeline, BIO/QLS/Informa, and Wong et al. All rates cover Phase 1 through approval. We calculated failure as 100% minus each published approval probability. These are separate estimates, not a pooled rate or confidence interval.[1][2][3]
BIO estimated approval likelihood by multiplying phase-transition probabilities; each transition rate used programs that advanced or were suspended, excluding ongoing programs.[2] Wong and colleagues instead reconstructed development paths, including inferred missing phases. Their full dataset contained 406,038 entries representing 185,994 distinct trials; the headline 13.8% estimate concerns industry-sponsored programs across indications.[3] The dates therefore identify the records used, not a single cohort enrolled in Phase 1 and followed to its final outcome.
A drug-indication program evaluates a drug for a particular disease or use. The same molecule can fail in one indication and succeed in another. Counting approval in any indication as molecule-level success answers a different question from counting each program separately.
Zhou and colleagues' 2025 analysis illustrates this distinction using 20,398 programs involving 9,682 molecular entities over 2001-2023. Molecule-based estimates tended to exceed program-based estimates. Their analysis also found that success rates declined earlier in the century before leveling off and recently increasing. Differences in data coverage, time windows, and treatment of missing records make direct comparisons with Citeline's declining trend difficult.[4]
The 86% to 93% range is consequently a useful summary of the three benchmarks above, not a universal bound for every disease, drug type, or period.
What percentage fail at each clinical trial phase?
In BIO's 2011-2020 benchmark, 71.1% of Phase 2 programs failed to advance, the highest attrition among the clinical phases.[2]
| Development step | Success | Attrition |
|---|---|---|
| Phase 1 to Phase 2 | 52.0% | 48.0% |
| Phase 2 to Phase 3 | 28.9% | 71.1% |
| Phase 3 to regulatory filing | 57.8% | 42.2% |
| Regulatory filing to FDA approval | 90.6% | 9.4% |
| Phase 3 through FDA approval | 52.4% | 47.6% |
Source: BIO/QLS/Informa. We calculated attrition as 100% minus reported success. Filing means submitting a New Drug Application (NDA) or Biologics License Application (BLA); approval includes resubmissions.[2]
For Phase 3, 42.2% describes failure to reach filing; 47.6% also includes later regulatory attrition. Neither measures how often an individual Phase 3 trial misses its primary endpoint.[2]
The distinction between phases helps explain the pattern. Phase 1 generally examines safety and dosage. Phase 2 evaluates efficacy and side effects in patients, while Phase 3 provides larger studies of benefit and adverse reactions.[5] Evidence sufficient to justify further testing is not necessarily sufficient to establish a favorable balance of benefit and risk.
Citeline's later 2014-2023 analysis reported transition success rates of 47.3% in Phase 1, 28.0% in Phase 2, 55.0% in Phase 3, and 91.8% after filing. Phase 2 remained the least successful transition.[1] Phase-specific percentages have different denominators and cannot be added to obtain overall failure.
Why do drugs fail in clinical trials?
Insufficient efficacy was the most frequently recorded reason in two major analyses of late-stage failures. Their percentages describe reasons among failed programs or agents, rather than the risk of failure among all drugs entering trials.[6][7]
Hwang and colleagues followed 640 novel therapeutics that entered pivotal trials during 1998-2008, assessing approval status through 2015. Of these, 344 remained unapproved anywhere. The researchers classified their failures as follows:
| Reason for failure | Failed agents | Share of 344 failures |
|---|---|---|
| Inadequate efficacy | 195 | 56.7% |
| Safety concerns | 59 | 17.2% |
| Commercial or other reasons | 74 | 21.5% |
| Unknown | 16 | 4.7% |
Source: Hwang et al., Table 2. Published percentages total slightly above 100% because of rounding.[6]
Harrison's separate analysis identified 218 drug-indication failures during 2013-2015, from Phase 2, including Phase 1/2, through submission. Reasons were available for 174: efficacy accounted for 52%, safety for 24%, strategy for 15%, commercial considerations for 6%, and operations for 3%. It included both new substances and new uses of marketed drugs.[7]
These studies support the same broad conclusion about efficacy, but their categories should not be merged into a single distribution. Hwang retained unknown causes in the denominator; Harrison excluded failures without a stated reason. An efficacy failure, a safety failure, and a portfolio decision also have different implications for the underlying science. Discontinuation alone does not identify which occurred.
What is associated with higher clinical success rates?
Patient selection and human genetic evidence are associated with higher success in retrospective studies. These findings identify useful signals for development decisions, but do not establish that adopting a single practice will cause a particular improvement.
In Wong and colleagues' 2005-2015 biomarker analysis, the estimated Phase 1-to-approval probability was 10.3% with patient-selection biomarkers and 5.5% without them. Biomarkers are measurable characteristics used here to select participants. The authors used a phase-by-phase calculation for this comparison, so these values should not be substituted for their 13.8% overall path-based estimate.[3]
Minikel and colleagues reported a 2.6-fold higher probability of success for drug mechanisms supported by human genetic evidence. Their 2024 analysis examined target-indication pairs, with stronger associations when the evidence more confidently identified the causal gene. This measures support for a biological mechanism, rather than the success rate of individual trials.[8]
Both comparisons concern historical associations. Differences in diseases, targets, and development strategies limit how directly they can predict a new program's outcome. Selecting a plausible target and an appropriate patient population can strengthen a development rationale while leaving substantial uncertainty about efficacy and safety.
For interpreting drug-development costs and clinical-development timelines, the relevant failure rate must match the starting phase and population. A Phase 1-to-approval benchmark describes a much longer and riskier path than the remaining work after a regulatory filing.