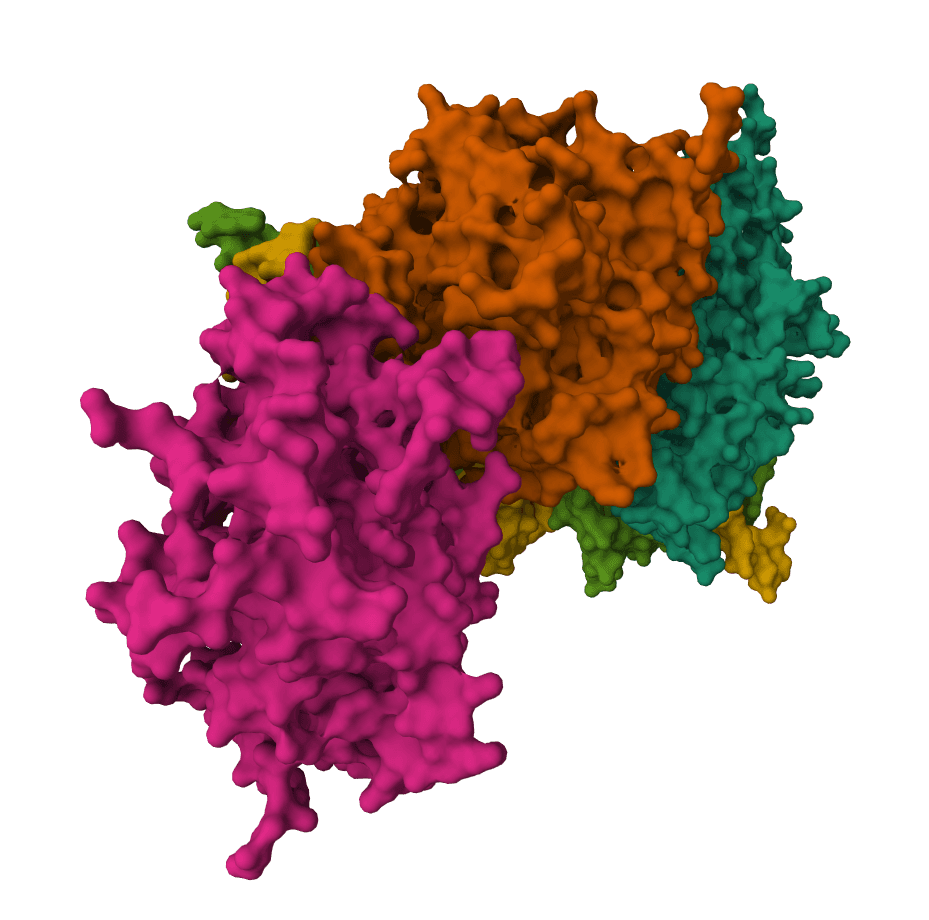
Predict protein ligand-binding residues from AlphaFold2 pair representations Learn more
Input
Protein structure to score for ligand-binding residues.
What is AF2BIND?
AF2BIND finds the residues on a protein most likely to contact a small-molecule ligand. It reads a single protein structure and returns a per-residue p(bind) score, so the binding pocket shows up as a cluster of high-scoring residues even when no ligand is present in the input.
The method works by borrowing AlphaFold2's learned sense of which residues sit at interfaces. Instead of docking an actual molecule, it presents the protein with a 20-residue bait made from single amino acids acting as stand-in ligands, then reads how strongly AlphaFold2's internal representation couples each target residue to those probes. Residues that the network treats as interface-like score high. This makes AF2BIND a fast way to localize a pocket before committing to docking or pocket geometry analysis.
AF2BIND scores one chain, a comma-separated set of chains, or a compact domain at a time. The selected chains can contain up to 300 residues processed by AF2BIND in total; unselected chains in the uploaded structure do not count toward that limit. Every processed residue must include its N, CA, and C backbone atoms. ProteinIQ checks this before the run because AF2BIND can otherwise write missing atoms at invalid coordinates. For a larger target, trim to the domain or interface region of interest before scoring.
This tool runs AF2BIND's standard notebook path. The experimental serial notebook and the separate large-protein domain-splitting pipeline are not included; use a trimmed domain of up to 300 residues for the standard method reviewed here.
How to use AF2BIND online
Upload a protein structure as a PDB file or fetch one from RCSB by ID, pick the chain to score, and AF2BIND returns a ranked table of p(bind) values plus a copy of the structure colored by those scores. The prediction runs on GPU infrastructure with no AlphaFold2 setup, no MSA database, and no local install. The top-ranked residues mark the most probable ligand-binding site.
The browser intentionally uses RCSB as its single database fetch source because it returns experimental PDB entries directly. API submissions may also provide an AlphaFoldDB UniProt identifier; AF2BIND then retrieves the corresponding predicted PDB structure before scoring it.
Inputs
| Input | Description |
|---|---|
Target protein | A PDB file or RCSB PDB ID containing protein atoms. Every residue processed by AF2BIND must contain N, CA, and C backbone atoms. For multi-model PDB files, AF2BIND uses the first model. |
Settings
| Setting | Description |
|---|---|
Target chain | Chain or comma-separated chains to score, by default A. For example, use A,B to score both chains as one target. |
Mask sidechains | Hides target sidechain atoms from the model so scoring leans on backbone geometry. On by default, matching the AF2BIND default rm_target_sc=True. |
Mask sequence | Hides the target sequence identity so scoring leans on structure alone. Off by default. |
Activation heatmap cutoff | Includes residues above the selected p(bind) value in the amino-acid bait activation heatmap. The source default is 0.50; 0.28 is the published recommended binding-site threshold. |
Rescale by maximum p(bind) | Normalizes the p(bind) values written into the structure so the highest-scoring residue maps to the top of the color range. Off by default, which preserves raw scores for coloring. |
Masking sidechains and keeping the sequence visible is the configuration AF2BIND was validated with. Turning on sequence masking is useful when testing how much a prediction depends on structure versus sequence, but it is not the recommended starting point.
Results
| Output | Contents |
|---|---|
| Results table | One row per residue, ranked from highest to lowest p(bind) for inspection. |
results.csv | The native AF2BIND table with chain, residue number, amino acid, and p(bind) in input-residue order. |
viewer.pdb | The structure shown in ProteinIQ and passed to structure workflow steps. It preserves AF2BIND's coordinates and B-factor scores while omitting atom records that cannot be matched unambiguously to the uploaded structure; it does not repair or invent coordinates. |
output.pdb | The unmodified PDB written by the pinned AF2BIND notebook, available for source-faithful inspection and download. |
output.zip | The native AF2BIND bundle containing output.pdb and results.csv. |
activation.csv | Per-residue contributions from each of the 20 amino-acid baits for residues above the chosen heatmap cutoff. |
source.log | Captured text output from the pinned AF2BIND notebook execution. |
How AF2BIND works
AlphaFold2 builds a pair representation, a tensor that encodes the relationship between every pair of residues across all chains in a complex. When two chains form an interface, the pair representation between their residues carries a distinctive signal that the network learned from real protein structures.
AF2BIND exploits this without needing a real ligand. It adds 20 separate single-residue "bait" chains to the prediction, one for each amino acid type, using the bait sequence ACDEFGHIKLMNPQRSTVWY. Each bait acts as a minimal pseudo-ligand. AlphaFold2 then produces a pair representation linking every target residue to every bait. A small trained logistic-regression layer reads those cross-chain features and outputs p(bind), the probability that a given target residue lies in a ligand-binding pocket.
Because the baits are individual amino acids rather than a specific compound, p(bind) flags where ligands tend to bind in general, not the affinity of any particular molecule.
Interpreting p(bind)
p(bind) is a calibrated per-residue probability of belonging to a small-molecule binding site. The final AF2BIND study recommends p(bind) ≥ 0.28 as the general classification threshold; at that threshold, the reported benchmark reached 67% sensitivity, a 4.3% false-positive rate, and 63% precision. Spatial context still matters: a convincing pocket usually appears as a compact group of high-scoring residues rather than isolated values scattered across the structure.
A practical reading approach:
- Start with residues at or above 0.28, then inspect the top 10 to 15 scores and their spatial arrangement.
- Map those residues onto the displayed structure or
viewer.pdb. Residues that cluster spatially are the predicted pocket; lone high scorers far from the cluster are usually noise. Useoutput.pdbwhen you specifically need the unmodified source artifact. - Use the activation heatmap to see which amino-acid baits support or oppose each high-scoring residue; these contributions explain the model signal but do not identify a preferred real ligand.
For proteins with more than one pocket, expect more than one spatial cluster. The ranking alone will not separate them, so the structural view matters.
When to use AF2BIND vs alternatives
AF2BIND is strongest when a structure exists and the goal is to localize a small-molecule pocket quickly, especially for a protein where no bound ligand has been resolved. It needs no MSA and no docking box.
- For pockets defined by surface geometry and cavity detection rather than a learned interface signal, use fpocket, which is faster and gives explicit pocket volumes and druggability scores.
- For predicting protein-protein or protein-DNA binding residues rather than small-molecule sites, use ScanNet.
- Once a pocket is identified, estimate how a specific compound binds it with AutoDock Vina.
If the structure itself is uncertain, predict it first with AlphaFold 2, then score the model with AF2BIND.
Related tools
SPRINT
Rank a compound library against one protein target with SPRINT protein and ligand co-embeddings and native cosine similarity.
SMRTnet
Deep learning framework for predicting small molecule-RNA interactions using RNA secondary structure. Combines language models, CNNs, and graph attention networks for binding prediction.
ADMET-AI
Predict ADMET (Absorption, Distribution, Metabolism, Excretion, Toxicity) properties from SMILES strings using machine learning models trained on Therapeutics Data Commons datasets.
Admetica
Predict 22 ADMET properties from SMILES strings with the native Admetica Chemprop models from Datagrok.
Brenk filter
Identify toxic, reactive, and pharmacokinetically problematic molecular fragments using structural alert patterns
eToxPred
Predict toxicity and synthetic accessibility of small molecules using machine learning. eToxPred combines toxicity risk assessment with synthetic accessibility scoring to help prioritize drug candidates.
Lead-likeness filter
Screen for lead-like compounds using stricter molecular descriptor criteria than Lipinski or Veber rules for early-stage drug discovery
PAINS filter
Screen compounds for Pan-Assay Interference patterns that cause false positives in biological assays
QEPPI
Quantitative estimate for protein-protein interaction inhibitor potential. Evaluates drug-likeness for compounds targeting PPIs.
Structural alert screening
Screen compounds for structural toxicity alerts using PAINS, Brenk, and NIH filters. For focused screening, see PAINS Filter, Brenk Filter, or Veber's Rule.