Predict six sequence-level developability properties with a multitask ProstT5 model. Learn more
Input
Output
Configure inputs to begin
Set options on the left, then click “Submit job”.
What is Prot2Prop?
Protein developability is rarely controlled by one property. A sequence can look stable yet express poorly, remain soluble but aggregate under another condition, or fail during protein material production. Prot2Prop screens six such outcomes from amino acid sequence in one run: aggregation propensity, expression yield, folding stability, material production, solubility, and stability at 65 °C.
The model combines the structure-aware sequence representations learned by ProstT5 with a multitask prediction architecture. It returns three continuous ProteinGym-derived scores and three binary classifications. All predictions describe the complete submitted sequence. They do not identify individual residues or replace measurements under a specific expression, purification, formulation, or storage condition.
How to use Prot2Prop online
Prot2Prop runs online from one raw amino acid sequence or a multi-record FASTA file. ProteinIQ submits the sequences to the multitask ProstT5 model and returns one row per sequence, including three relative regression scores, three binary classifications, per-class probabilities, and a downloadable prediction CSV.
Input
| Input | Accepted format | Notes |
|---|---|---|
Protein sequences | Raw sequence or FASTA | One raw sequence or multiple FASTA records can be scored in the same job. FASTA headers become the Name values in the result. |
| Sequence file | .txt, .fasta, .fa, or .fas | Files can be up to 50 MB. Rows are returned in input order. |
| RCSB sequence | RCSB fetcher | Fetches an amino acid sequence as FASTA for sequence-level scoring. |
Prot2Prop accepts the 20 standard amino acid codes plus U, Z, O, B, and X. Input is converted to uppercase and whitespace is removed. Before ProstT5 encoding, U, Z, O, and B are represented as X, so variants that differ only at these ambiguous or rare symbols receive the same encoded residue at those positions. Stop symbols such as * are rejected.
There are no scientific settings to configure. The same checkpoint and six task heads run for every sequence.
Results
The result table begins with Name and Sequence, followed by the six tasks in the model's native order.
| Prediction | Type | What the result means |
|---|---|---|
Aggregation propensity | Regression | A relative ProteinGym DMS fitness score learned from aggregation-related assays. It is not an aggregation rate, concentration, or residue-level hotspot score. |
Expression yield | Regression | A relative ProteinGym DMS fitness score learned from expression-yield assays. It is not a yield in mg/L and does not specify an expression host. |
Folding stability | Regression | A relative ProteinGym DMS fitness score learned from folding-stability assays. It is not ΔG, ΔΔG, melting temperature, or half-life. |
Material production | Binary classification | Class 1 is the positive label for failure at the protein material stage. A high positive probability is therefore unfavorable. |
Solubility | Binary classification | Class 1 is the soluble class and class 0 is the insoluble class. |
Temperature stability | Binary classification | Class 1 indicates predicted structural stability at 65 °C. Class 0 indicates predicted instability at that condition. |
Regression columns
Each regression task has two columns:
| Column suffix | Interpretation |
|---|---|
_value | Prediction transformed back to the task's source-score scale using the training mean and standard deviation. This is the primary value for comparison within one property. |
_normalized_value | Standardized model output before rescaling. Values above 0 are above the task training mean, while values below 0 are below it. |
ProteinGym orients DMS_score so that higher values represent higher measured fitness in the source assay. Prot2Prop retains that convention. For aggregation-related data, a higher score should not automatically be translated as "more aggregation"; it means better fitness under the assay's directionality. The three regression columns also use different task distributions, so an aggregation score of 1.0 cannot be compared numerically with an expression or folding score of 1.0.
These values are most useful for ranking related candidates, such as variants of one scaffold scored together. Absolute cutoffs such as "stable above 0" or "high yield above 1" are not supported by the training labels.
Classification columns
Each classification task returns four columns:
| Column suffix | Interpretation |
|---|---|
_predicted_class | The class with the larger model probability. Class 0 or class 1. |
_positive_probability | Probability assigned to class 1. The biological meaning of class 1 depends on the task. |
_probability_class_0 | Probability assigned to class 0. |
_probability_class_1 | Probability assigned to class 1; this is the same quantity as _positive_probability. |
The two class probabilities sum to approximately 1. Values near 0.5 indicate a borderline call, while values closer to 0 or 1 indicate stronger model separation. They are model probabilities, not measured frequencies of success or failure. The predicted class uses the larger of the two probabilities, equivalent to a 0.5 boundary for class 1.
The material-production label deserves special attention. Its positive class is failure, unlike the positive solubility and temperature-stability classes. A sequence with material_production_positive_probability = 0.90 is predicted to have a high probability of failure at that stage, not a 90% probability of successful production.
Downloadable output
prot2prop_predictions.csv contains the same 20 columns shown in the spreadsheet:
nameandsequence- Raw-scale and normalized values for the three regression tasks
- Predicted class, positive probability, and class
0and class1probabilities for the three classification tasks
The CSV preserves FASTA input order and can be used to rank a batch, compare designed variants, or join predictions back to an experiment table.
How Prot2Prop works
Prot2Prop uses the encoder from ProstT5, a protein language model trained to connect amino acid sequences with Foldseek 3Di structural tokens. The frozen encoder converts each submitted sequence into residue embeddings. Prot2Prop then applies:
- A shared adapter that learns signals useful across all six properties
- A small residual adapter for each property
- Attention pooling that reduces residue embeddings to one task-specific sequence representation
- Separate multilayer prediction heads for regression and binary classification
The three regression heads were trained on ProteinGym substitution assays grouped as aggregation propensity, expression yield, and folding stability. The model learns the direction-normalized DMS_score for each group. The classification heads use material-production, DeepSol, and 65 °C temperature-stability datasets.
This shared architecture makes Prot2Prop efficient for broad candidate screening, but it does not mean that one property causes another. Each task has its own adapter and output head, and correlations between predictions can reflect shared sequence features or shared biases in the training data.
Choosing Prot2Prop or a specialized predictor
| Goal | Better starting point | Why |
|---|---|---|
| Screen many sequences across several developability properties | Prot2Prop | One sequence-only run returns all six task predictions on a consistent row set. |
| Inspect interpretable sequence features behind a solubility estimate | Protein-Sol | Returns composition, charge, hydropathy, feature deviations, and sliding-window profiles in addition to its solubility prediction. |
| Locate aggregation-prone regions on a known structure | Aggrescan3D | Uses solvent exposure and three-dimensional residue neighborhoods to produce residue-level scores and a scored PDB file. |
| Estimate the stability effect of every single amino acid mutation | ThermoMPNN | Uses a protein structure and reports mutation-level ΔΔG predictions rather than a whole-sequence relative fitness score. |
| Calculate transparent physicochemical descriptors | Protein Parameters | Reports quantities such as molecular weight, isoelectric point, instability index, and hydropathy without a learned multitask model. |
Prot2Prop works well as an early funnel: rank complete sequences first, then apply a specialized predictor to the property that limits a candidate. For example, a batch with weak aggregation-related scores can be narrowed with Aggrescan3D once structures are available.
Practical limitations
- Sequence-level output: Prot2Prop does not locate problematic residues, model mutations explicitly, or account for a known three-dimensional conformation.
- Assay-relative regression scales: The three continuous values inherit heterogeneous DMS assay scales. They are prioritization scores, not laboratory units.
- Condition-specific labels: Solubility, expression, aggregation, and stability depend on host, construct boundaries, tags, buffer, concentration, pH, and temperature. Most of that context is absent from a sequence-only prediction.
- Material-production semantics: The positive class represents failure at the protein material stage. It is not a general estimate of manufacturability or production yield.
- Ambiguous residues:
U,Z,O, andBare converted toXbefore encoding, reducing residue-specific information. - Long proteins: The training pipeline was configured for sequences up to 2,048 tokens. Predictions for substantially longer proteins are outside that training envelope.
- No experimental uncertainty: The output has class probabilities but no confidence interval, replicate variance, or uncertainty estimate for the regression values.
The safest use is comparative screening within a related sequence family, followed by condition-matched experimental measurements. Large sequence changes, membrane proteins, multidomain constructs, and proteins that depend on cofactors or post-translational modifications require extra caution.
Related tools
EvoIF
Score protein mutations with evolutionary profiles from homologous sequences and inverse folding. EvoIF returns a dimensionless log-odds score for each submitted single or multi-site mutation.
ThermoMPNN
Predict protein thermostability changes (ΔΔG) for point mutations using a graph neural network. Enables computational saturation mutagenesis screening to identify stabilizing mutations.
CANYA
Predict protein aggregation nucleation propensity from amino acid sequences using the Lehner Lab CANYA neural network.
Aggrescan3D
Static-mode Aggrescan3D analysis for per-residue aggregation propensity from a single protein structure.
PROPKA 3
Predict pKa values of ionizable groups in proteins and protein-ligand complexes from 3D structure. PROPKA calculates environment-driven pKa shifts for standard ionizable residues, terminal groups, and supported ligand atom types.
Protein-Sol
Predict protein solubility from amino acid sequence using the University of Manchester Protein-Sol method.
TNP
Profile nanobody developability with the Therapeutic Nanobody Profiler, including CDR geometry, surface hydrophobicity and charge, clinical-reference flags, and predicted structures.
AllMetal3D
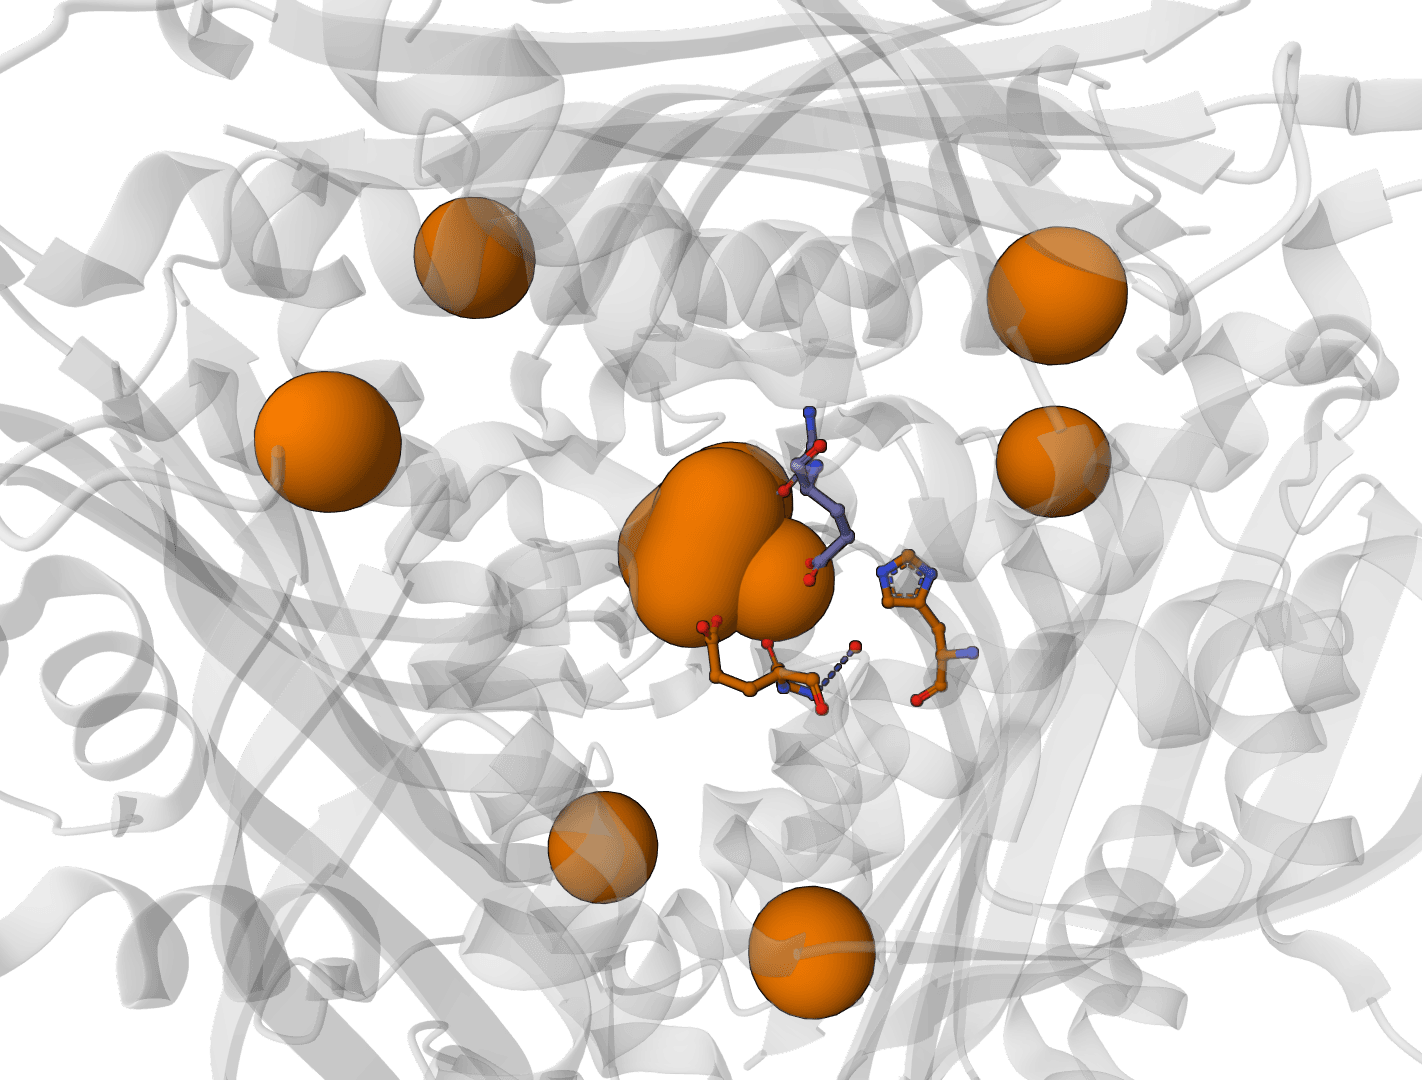
Predict metal and water binding sites in protein structures using 3D convolutional neural networks (AllMetal3D + Water3D).
DeepSP
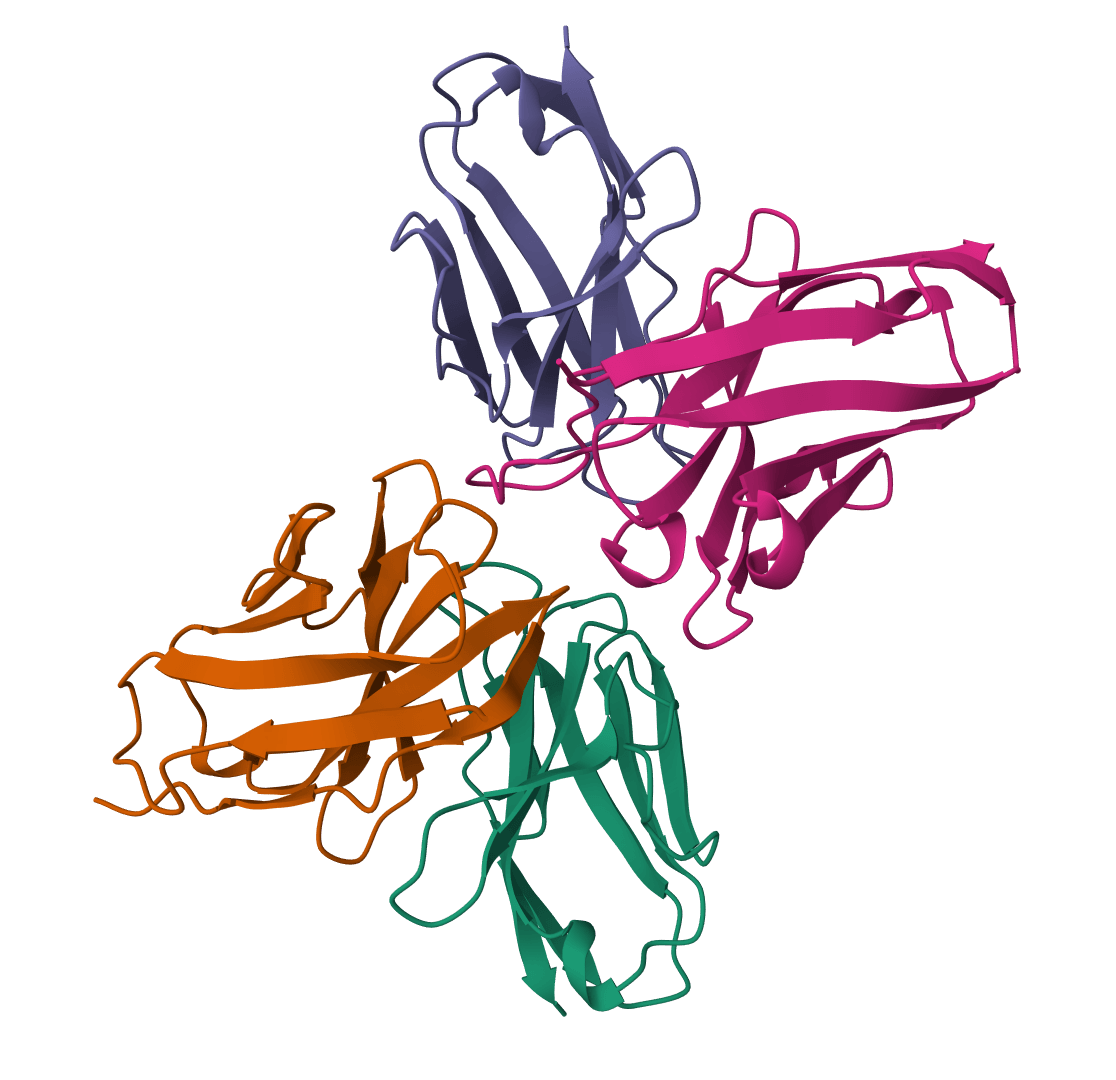
Predict 30 antibody spatial descriptors from paired heavy- and light-chain variable-domain sequences, including SAP-positive and positive/negative SCM values across CDR and variable-domain regions.
DeepViscosity
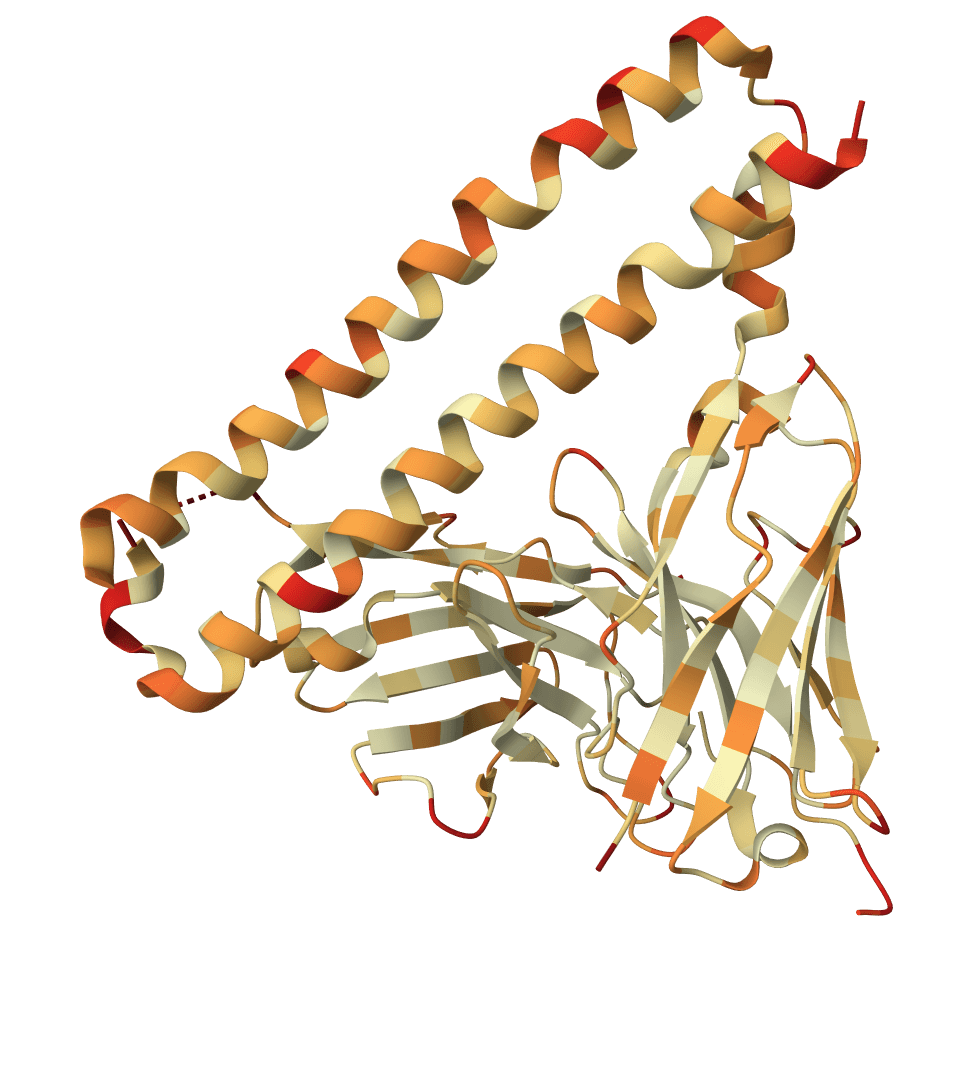
Classify paired monoclonal antibody Fv sequences as low viscosity (at or below 20 cP) or high viscosity (above 20 cP) at 150 mg/mL, with ensemble probabilities and 30 DeepSP descriptors.