Identify potential protein-coding regions in DNA across all six reading frames with NCBI ORFfinder. Learn more
Input
What is ORF Finder?
An open reading frame (ORF) is a DNA region that can be translated without encountering an in-frame termination signal. ProteinIQ runs the native NCBI ORFfinder 0.4.3 executable, the same scientific engine distributed by NCBI, rather than reproducing its search algorithm.
The search can inspect three reading frames on the forward strand, three on the reverse strand, or a selected strand only. The selected NCBI genetic code controls translation, alternative initiation codons, and termination behavior.
An ORF is a candidate coding region, not proof of a functional gene. Expression, conservation, gene context, and splice-aware evidence are usually needed for annotation.
Input
Submit raw DNA or one or more FASTA records. IUPAC ambiguity symbols are
preserved, so their coordinates remain stable and ambiguous translated codons
can appear as X. Gaps, punctuation, amino-acid characters, and other invalid
symbols are rejected instead of silently removed.
| Input | Limit |
|---|---|
| DNA sequence | Up to 10 MB and 10,000,000 nucleotides per job |
| FASTA records | Up to 500 records with unique identifiers |
For sequences longer than 20,000 nt, the interactive result still shows complete ORF tracks but omits nucleotide-by-nucleotide rendering. All native output files remain complete.
To keep result transfer and browser rendering reliable, one job can return at most 10,000 ORFs and 50 MB of combined native output. If a search exceeds either bound, increase the minimum ORF length or narrow the search region. Interactive tracks show the first 1,000 ORFs per sequence; the table and native files remain complete for successful jobs.
Settings
| Setting | Native behavior |
|---|---|
Minimum ORF length | Maps to -ml. Presets are 30, 75, 150, 300, and 600 nt; 75 nt is the default. A terminating stop triplet does not count toward the coding-length threshold. |
Genetic code | Maps to -g. The 26 choices match the current NCBI ORFfinder web application. |
Start codon mode | Maps to -s: ATG only, ATG plus alternatives defined by the selected genetic code, or any sense codon. |
Strand | Maps to -strand: both, plus, or minus. |
Ignore nested ORFs | Maps to native -n containment filtering. |
Start position | Maps to -b; inclusive and 1-based. |
End position | Maps to -e; inclusive, with 0 meaning the end of each sequence. |
The source also has an experimental circular-sequence flag. NCBI marks it as under development, so it is not offered here.
Results
The ORF explorer opens with a full-sequence map. Select an ORF to zoom into its region and see its coordinates, protein sequence, and oriented DNA sequence. Use the zoom controls to inspect individual bases, or select Full sequence to return to the overview. Hover over the map to mark a base position across all six reading frames. The ORF table provides search, strand and source-status filters, sorting, and CSV export. Summary shows totals across all input sequences and links the longest ORF back to the explorer.
These views are derived from the native protein and CDS FASTA records. They preserve native ORF order and biological direction:
- forward-strand coordinates ascend from start to end;
- reverse-strand coordinates descend from start to end;
Not marked partialmeans NCBI ORFfinder did not mark the protein record as partial;Marked partialis the source annotation, not an inference based only on the last codon;- first and last codons are shown exactly as they occur in the oriented native CDS.
Filters and CSV/JSON exports are convenience views over those native values.
Native files
Every run includes all output formats produced by the NCBI executable:
| File | ORFfinder format | Contents |
|---|---|---|
| Protein FASTA | -outfmt 0 | Native protein translations, headers, order, and partial labels |
| CDS FASTA | -outfmt 1 | Native oriented coding DNA sequences and source coordinates |
| Text ASN.1 | -outfmt 2 | Native sequence annotations and partial-location semantics |
| Feature table | -outfmt 3 | Native five-column feature table |
| Run log | Additive | Pinned version, effective flags, and native diagnostics |
ORF Finder examples
Human HBB transcript: a single standard-code ORF
This example searches the curated human beta-globin transcript for its main protein-coding region while retaining the transcript's untranslated sequence context.
- Input: Human
HBBtranscript, NCBINM_000518.5(628 nt) - Non-default settings:
Minimum ORF length=300 ntandStrand=Forward only (+)to focus the result on the annotated coding orientation
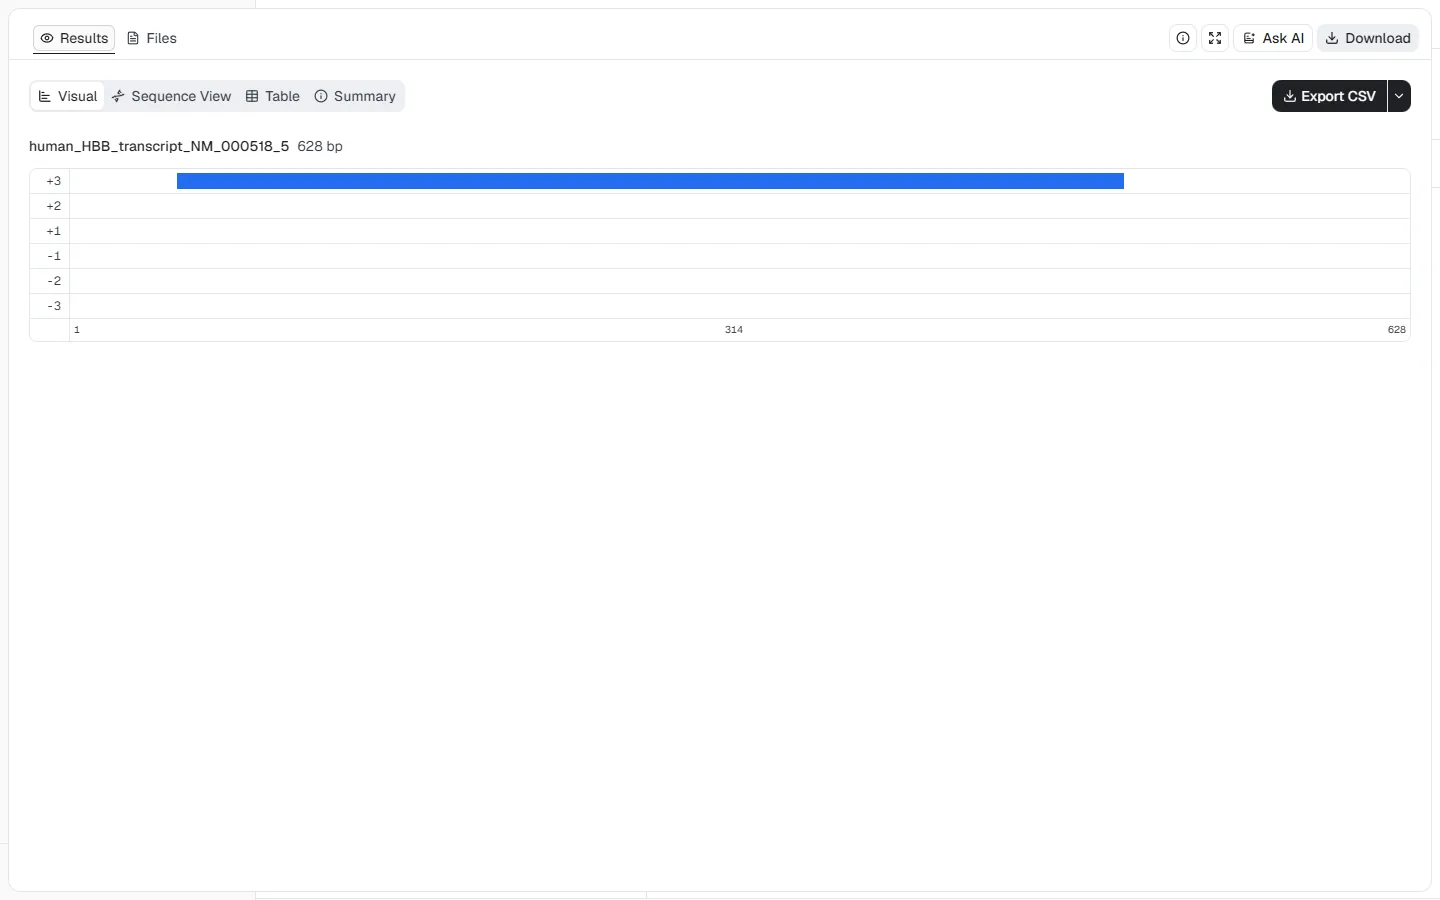
ORF Finder returns one frame +3 ORF from positions 51–494. The native coding
sequence is 444 nt and its protein translation is 147 aa. The visual map keeps
the 5′ and 3′ untranslated sequence visible around the ORF, which makes the
transcript context clear. This result identifies a translatable region in the
submitted sequence; it does not by itself demonstrate expression or confirm
transcript abundance in a biological sample.
Human ATP8/ATP6: overlapping mitochondrial reading frames
The human mitochondrial ATP8 and ATP6 genes overlap but use different
reading frames. This example shows why the biological source and genetic code
matter when interpreting ORF boundaries and translations.
- Input: Human mitochondrial reference
NC_012920.1, positions 8366–9207 (842 nt) - Non-default settings:
Minimum ORF length=150 nt,Genetic code=2. Vertebrate Mitochondrial, andStart codon mode=ATG + code-specific alternative starts
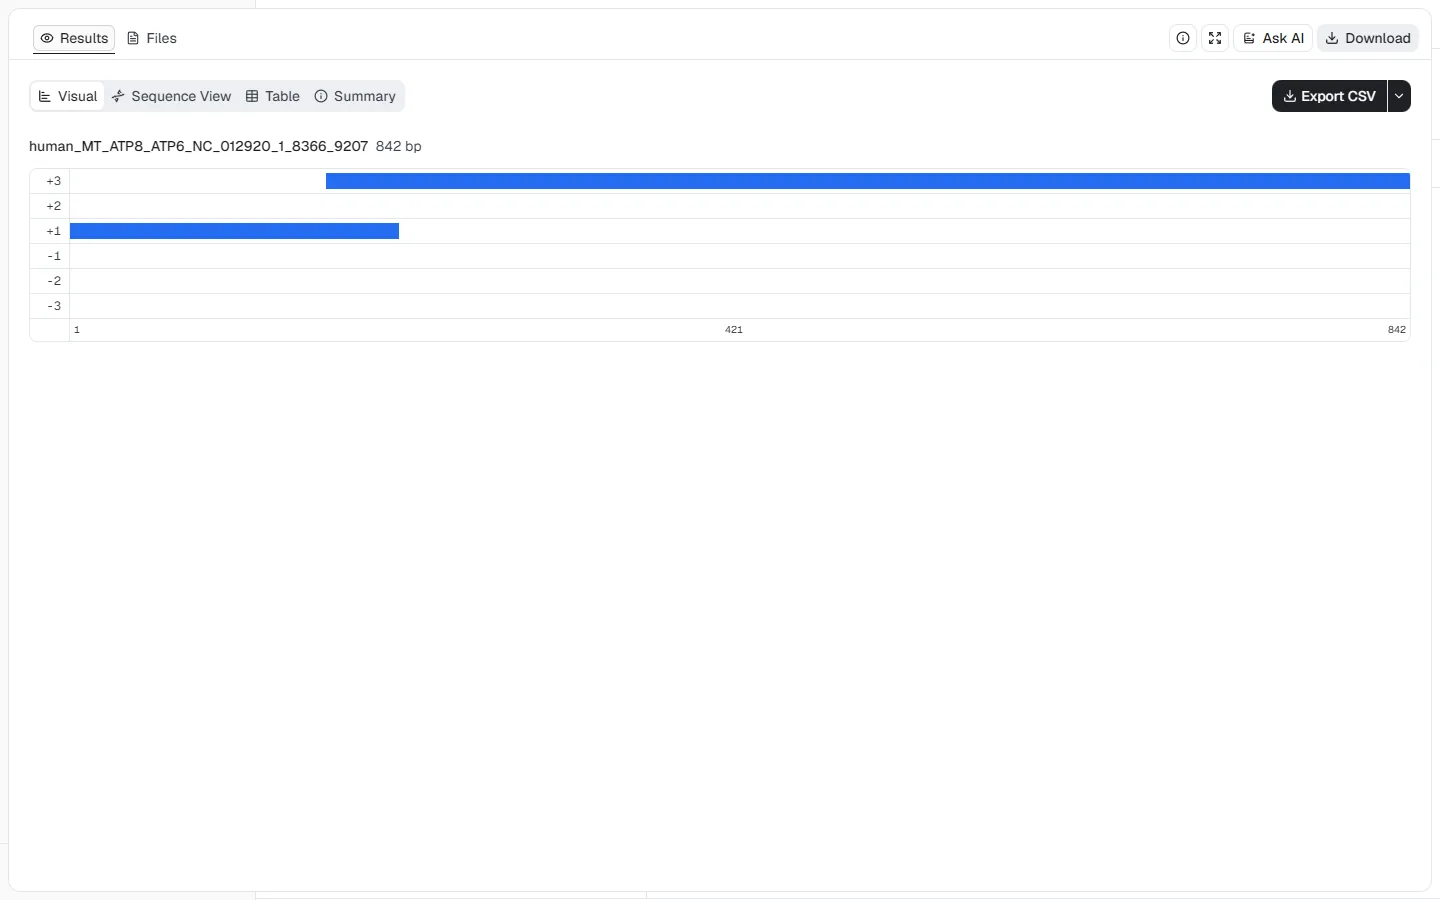
The frame +1 ORF spans positions 1–207 and returns 207 nt / 68 aa. The frame
+3 ORF spans positions 162–842 and returns 681 nt / 226 aa. Their 46 nt
overlap is visible directly in the track view. These translations use the
vertebrate mitochondrial code; applying the standard nuclear code can change
termination and amino-acid assignments.
E. coli lacI: reverse-strand detection with an alternative start
This genomic-region example demonstrates reverse-strand coordinates and a
code-specific alternative initiation codon around the E. coli K-12 lacI
locus.
- Input: E. coli K-12 reference
NC_000913.3, positions 366301–367650 (1,350 nt) - Non-default settings:
Minimum ORF length=300 nt,Genetic code=11. Bacterial, Archaeal and Plant Plastid,Start codon mode=ATG + code-specific alternative starts,Strand=Reverse only (-), andIgnore nested ORFs= enabled
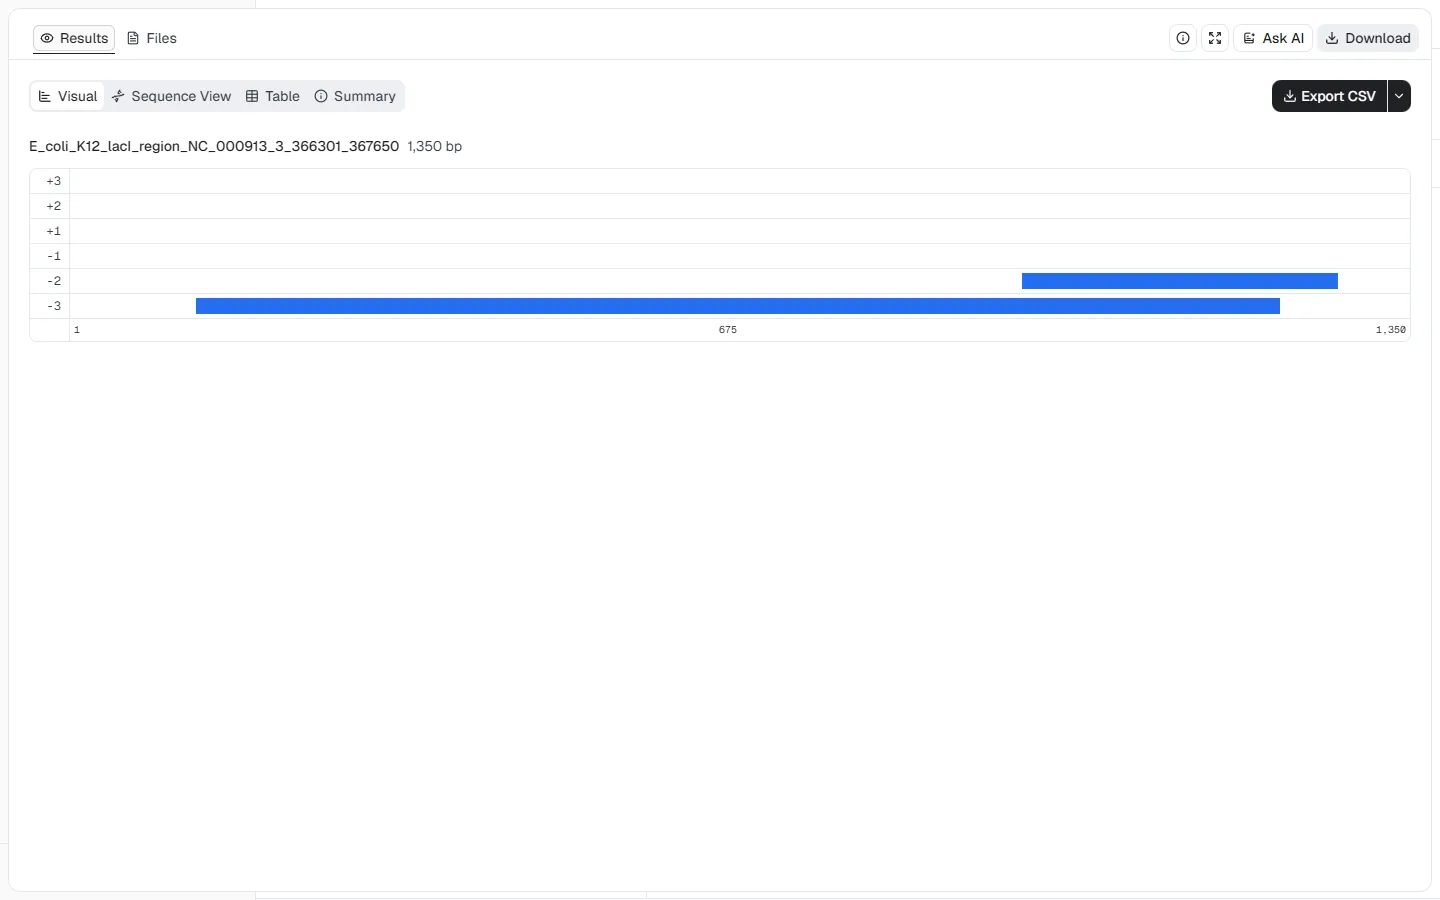
Both returned ORFs lie on the reverse strand. The longer frame -3 ORF covers
most of the submitted region, while the shorter frame -2 ORF occupies a
separate interval near the high-coordinate end.
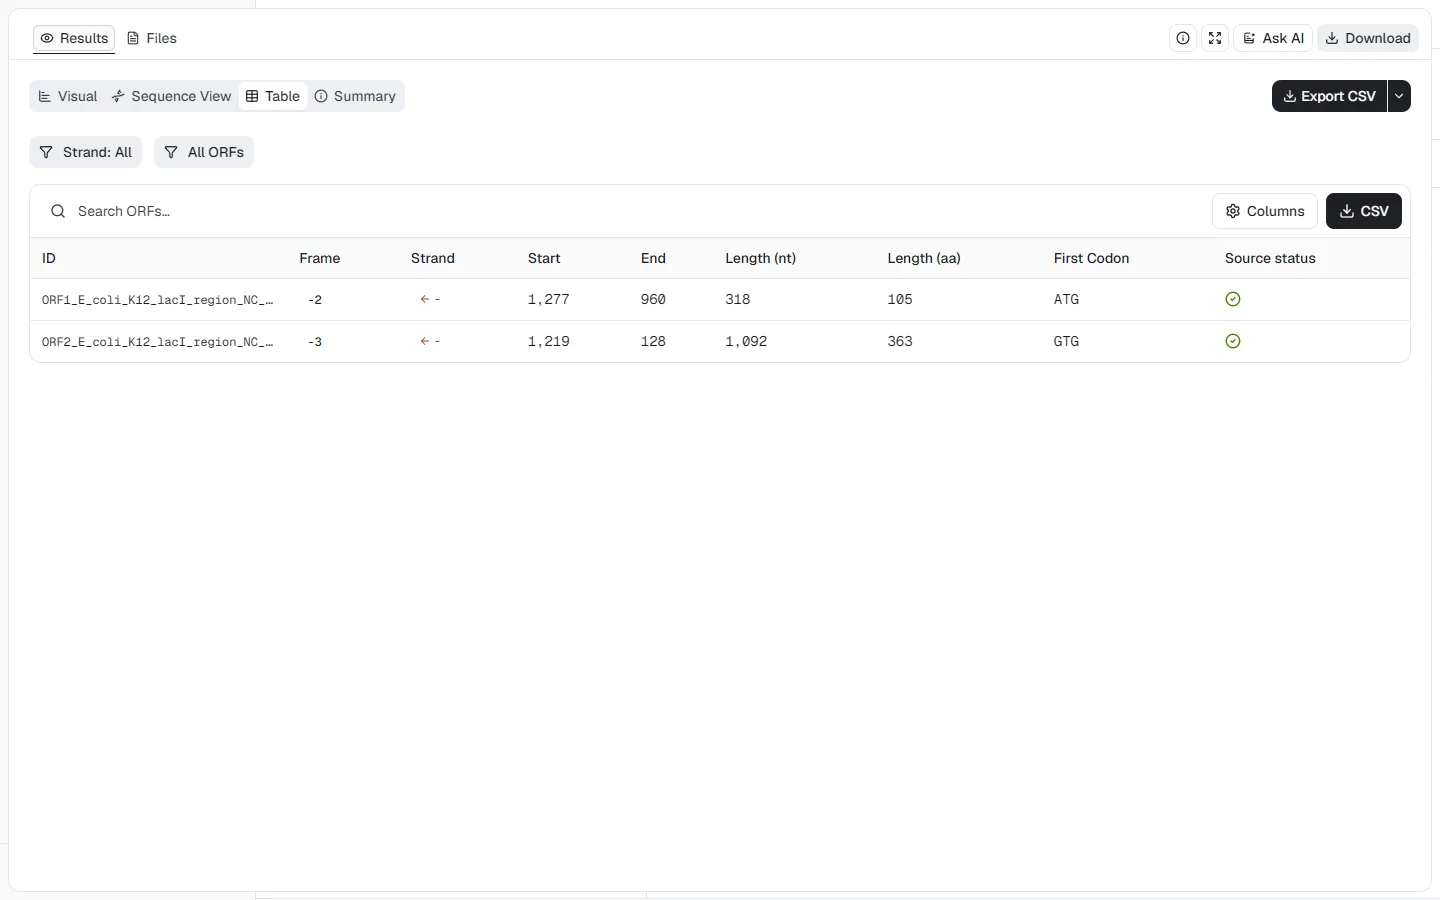
The table makes the strand direction explicit: the 1,092 nt / 363 aa ORF runs
from position 1,219 down to 128 and begins with GTG, an accepted alternative
start under genetic code 11. The second ORF runs from 1,277 down to 960 and
returns 318 nt / 105 aa with an ATG start. Descending coordinates are expected
for reverse-strand features; ORF detection alone does not establish promoter
activity, expression, or regulatory function.
Genetic codes
Choose the table that matches the biological source. Examples include:
| Code | Name | Notable behavior |
|---|---|---|
| 1 | Standard | TAA, TAG, and TGA terminate translation |
| 2 | Vertebrate Mitochondrial | TGA encodes Trp; AGA and AGG terminate |
| 3 | Yeast Mitochondrial | ATA and GTG can initiate; TGA encodes Trp |
| 6 | Ciliate Nuclear | TAA and TAG encode Gln |
| 11 | Bacterial, Archaeal and Plant Plastid | Includes several code-specific alternative starts |
| 26 | Pachysolen Nuclear | CTG can initiate and encodes Ala internally |
Using the wrong genetic code can change ORF boundaries, translations, and reported start sites.
Interpreting ORFs
- Longer ORFs are less likely to occur by chance, but length alone is not evidence of function.
- Prokaryotic ORFs often correspond closely to coding sequences.
- Eukaryotic genes with introns require splice-aware gene prediction; ORFfinder searches continuous submitted DNA.
- Compare candidates with conserved proteins, transcript evidence, codon usage, and genomic context before assigning function.
Related tools
DockQ
Assess docking model quality by comparing predicted complexes against native references. DockQ v2.1.3 supports protein, nucleic-acid, and supported small-molecule interfaces with native metrics.
AbLang
Restore missing antibody residues, generate 768-dimensional sequence or residue representations, and calculate amino-acid likelihood scores with the original AbLang heavy- and light-chain models.
CANYA
Predict protein aggregation nucleation propensity from amino acid sequences using the Lehner Lab CANYA neural network.
Carbon
Carbon is a DNA language model for generation, scoring, and sequence comparison using the native Hugging Face Carbon model family.
CpG Island Finder
Identify CpG islands in DNA sequences using the Gardiner-Garden and Frommer criteria. Analyze GC content, CpG density, and observed/expected ratios.
GC content calculator
Calculate GC content, GC/AT skew, melting temperature, and CpG islands for DNA/RNA sequences, with a sliding-window GC plot. Analyze individual sequences or get combined statistics.
IPC 2.0 (isoelectric point calculator)
Isoelectric Point Calculator 2.0 - Predict protein/peptide isoelectric point (pI) using 18+ validated pKa scales, SVR models, and deep learning. Supports proteins, peptides, and comprehensive analysis.
Oligo analyzer
Analyze unmodified DNA oligos with Primer3 thermodynamic Tm, hairpin, self-dimer, heterodimer, physical, and OD260 calculations.
PolyXpert
Predict low or high antibody polyreactivity from paired VH and VL variable-domain sequences with the source PolyXpert ESM-2 classifier.
Protein-Sol
Predict protein solubility from amino acid sequence using the University of Manchester Protein-Sol method.