# What is AlphaGenome? DeepMind's regulatory DNA model explained

> AlphaGenome is Google DeepMind's model that reads 1 Mb of DNA and predicts thousands of gene regulation tracks, from RNA-seq and chromatin accessibility to splicing and 3D contacts. It beats earlier models on most variant benchmarks, yet it calls a confident direction for well under half of known expression variants. Here is what it predicts, how its variant scores work and how to get access.

## What is AlphaGenome?

AlphaGenome is a deep learning model from Google DeepMind that reads 1 Mb of DNA sequence and predicts what thousands of genomics experiments would measure along it: gene expression, transcription start sites, chromatin accessibility, histone marks, transcription factor binding, splicing and 3D chromatin contacts. Run it twice, once on the reference sequence and once with a variant, and the difference is a predicted effect of that variant on gene regulation.

The paper's showcase is a leukaemia mutation. In some T-cell acute lymphoblastic leukaemias, a two-base insertion about 7.5 kb upstream of the TAL1 oncogene creates a binding site for the transcription factor MYB and switches TAL1 on. From sequence alone, AlphaGenome predicted the same story: more active-enhancer marks at the insertion, fewer repressive marks near the promoter and more TAL1 RNA, with the new MYB motif as the cause.

The same model is far less decisive on ordinary variants. Asked for the direction of effect of expression QTLs from GTEx, it gave a call that was right 90% of the time for 41% of them; for the other 59%, it could not commit at that accuracy. That was still more than twice Borzoi's 19%, the best earlier model. AlphaGenome is the strongest general model for reading regulatory DNA, and it still leaves most real variants uncalled.

What decides how far to trust a prediction is which output you read, which cell type it describes, how far the variant sits from the gene and how the score was calibrated. AlphaGenome itself is used through DeepMind's API and Python client, not through ProteinIQ; Evo 2 is the closest variant scorer you can run here.

## What AlphaGenome predicts

Each prediction covers 1,048,576 bp (2²⁰ bases) of human or mouse sequence, and returns 5,930 human or 1,128 mouse tracks across 11 output types. A track is one assay in one biological context, such as DNase-seq in HepG2 cells or RNA-seq in GTEx tibial artery. Most tracks are predicted at single-base resolution, some at 128 bp, and contact maps at 2,048 bp. We calculated what that means per window: 1,048,576 values for each 1 bp track, 8,192 bins for each 128 bp track and a 512 by 512 grid for each contact map.

Table 1 groups the 11 output types by the question each one answers. The training data came largely from ENCODE, GTEx, FANTOM5 and the 4D Nucleome project, so the tracks describe the tissues, cell lines and assays those consortia measured, not every cell type in the body.

  <caption><strong>Table 1. AlphaGenome 1 output types.</strong> Grouped by what they measure, with the resolution reported in the Nature paper.</caption>
  <thead>
    <tr>
      <th scope="col">Question</th>
      <th scope="col">Output types</th>
      <th scope="col">Resolution</th>
    </tr>
  </thead>
  <tbody>
    <tr>
      <td>How much RNA, and from where?</td>
      <td>RNA-seq; CAGE and PRO-cap (transcription start sites)</td>
      <td>1 bp and 128 bp</td>
    </tr>
    <tr>
      <td>Is the DNA open?</td>
      <td>DNase-seq, ATAC-seq</td>
      <td>1 bp and 128 bp</td>
    </tr>
    <tr>
      <td>What is bound or marked?</td>
      <td>Histone modification ChIP-seq, transcription factor ChIP-seq</td>
      <td>128 bp</td>
    </tr>
    <tr>
      <td>How is the transcript spliced?</td>
      <td>Splice sites, splice site usage, splice junctions</td>
      <td>1 bp</td>
    </tr>
    <tr>
      <td>Which regions touch in 3D?</td>
      <td>Contact maps from Hi-C and Micro-C</td>
      <td>2,048 bp</td>
    </tr>
  </tbody>

The splicing outputs are what set AlphaGenome apart from its predecessors. Splice junctions are predicted as donor and acceptor pairs with a strength, so the model can say that a variant creates a new junction, not only that it weakens a site. That matters for [introns and exons](/guides/introns-vs-exons): a variant deep inside an intron can make a cryptic exon that RNA-seq tracks alone would barely register.

AlphaGenome 2, released on 11 November 2026, changes the output model. Instead of a fixed catalogue of measured tracks, it takes a target condition (a tissue, cell type or cell state, or an embedding built from your own single-cell RNA-seq profiles) and predicts for that one condition. It adds CpG methylation, single-cell expression and single-cell ATAC outputs and drops PRO-cap in favour of CAGE.

## How the model reads a megabase

The architecture is U-Net-like. Convolutional layers find short motifs at single-base resolution, a transformer tower passes information across the whole window at 128 bp resolution, a pairwise block builds the 2,048 bp contact representation, and a decoder brings the signal back to single bases for the output heads. The preprint puts the model at about 450 million parameters, split across eight TPU devices during training by cutting the input into 131 kb chunks.

Training ran in two stages. Teacher models were trained on genome folds and on all data, then one student model learned to match an ensemble of teachers on randomly mutated input sequence. The distilled student scores a variant in under a second on an NVIDIA H100 GPU, with one model call per variant.

What was new is resolution and length together. Earlier sequence-to-function models had to choose: SpliceAI predicts every base but sees 10 kb of context, while Enformer and Borzoi see hundreds of kilobases but output 128 bp or 32 bp bins. Figure 1 puts the four on one axis.
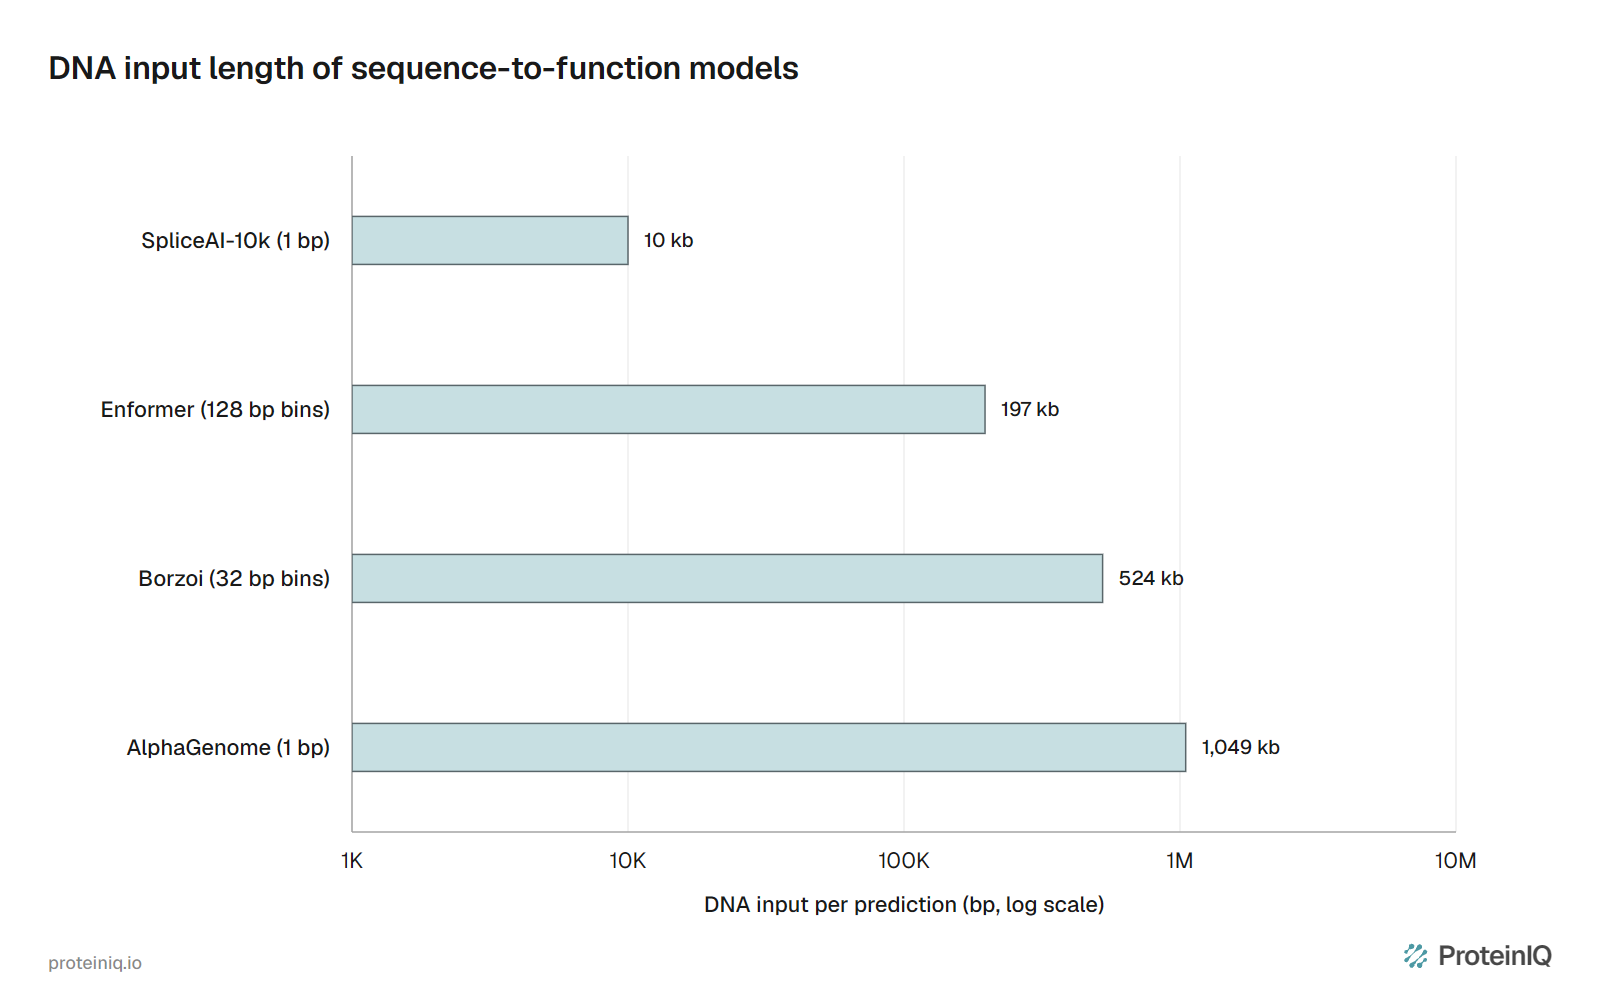
![Horizontal bar chart on a log scale of DNA input length per prediction: SpliceAI-10k 10 kb, Enformer 197 kb, Borzoi 524 kb and AlphaGenome 1,049 kb](/images/charts/sequence-to-function-model-input-length.webp "**Figure 1. DNA input length of sequence-to-function models.** Input sequence per prediction on a log scale, with the output resolution in brackets. AlphaGenome is the first of these to combine a 1 Mb window with single-base outputs. Source: the SpliceAI, Enformer, Borzoi and AlphaGenome papers.")

The authors chose 1 Mb because 465 of 471 validated enhancer and gene pairs, 99%, lie within that distance. The catch is that seeing a distant enhancer is not the same as using it. Expression QTL performance falls with distance from the gene, improves only mildly for variants beyond 35 kb, and the paper lists elements more than 100 kb away as "a continuing objective". Most of the window gives context; most of the confident calls come from its middle.

## How AlphaGenome scores a variant

A variant score is a comparison of two predictions over the same window, one with the reference allele and one with the alternate. What gets compared depends on the output type, and the client ships a set of recommended scorers that fix the choice.

For accessibility, CAGE and transcription factor tracks, the scorer sums each prediction in a 501 bp window centred on the variant and takes log₂((ALT sum + 1) / (REF sum + 1)); histone tracks use a 2,001 bp window. For RNA-seq, it averages predicted coverage over each gene's exons and reports the log fold change per gene. Splicing scores take the largest absolute change anywhere in the gene, and contact maps the mean absolute change across the window.
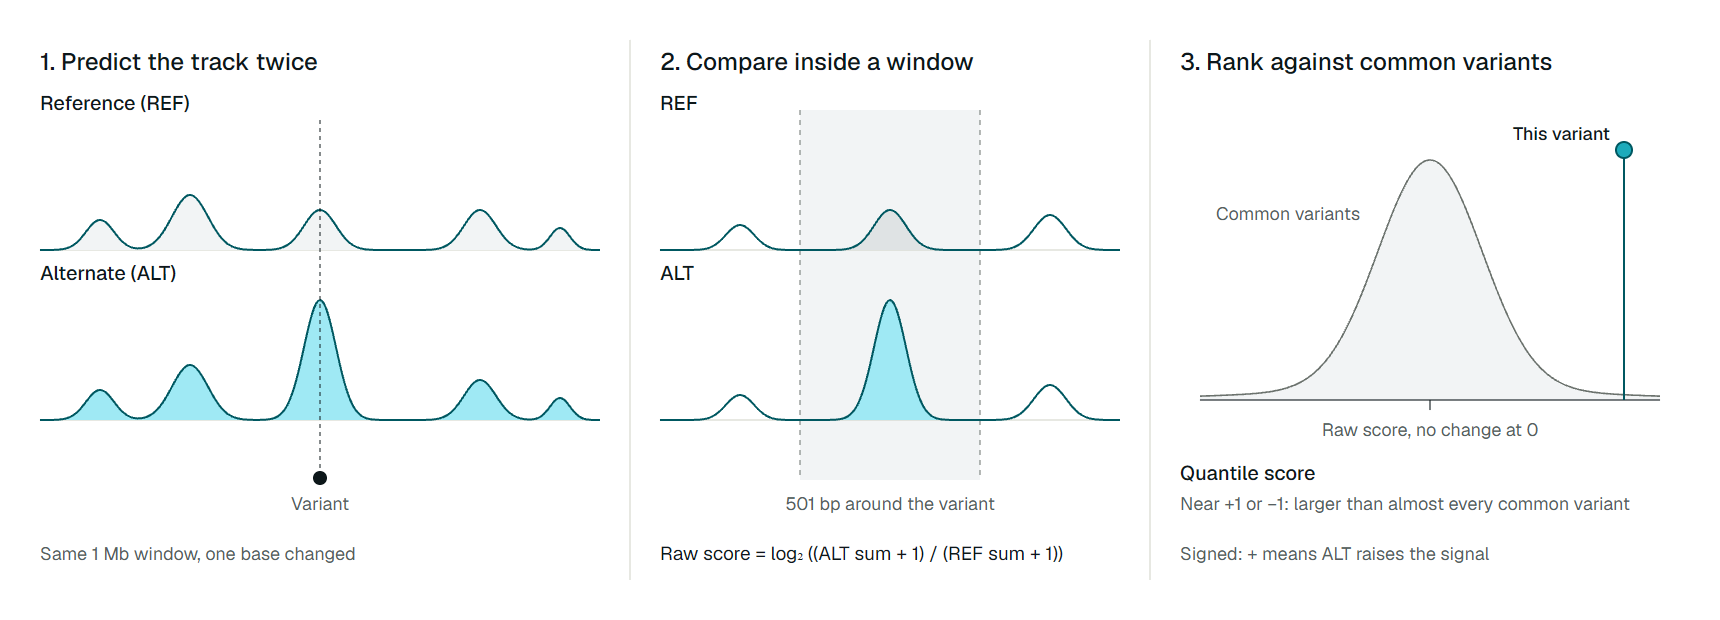
![Three-panel diagram. Panel 1 shows reference and alternate predictions of one track with a taller peak at the variant in the alternate. Panel 2 shows a 501 bp window around the variant and the formula log2 of ALT sum plus 1 over REF sum plus 1. Panel 3 places the variant's raw score far in the tail of the distribution of common-variant scores](/images/guides/what-is-alphagenome/variant-scoring.webp "**Figure 2. How AlphaGenome 1 scores a variant on an accessibility track.** The raw score compares summed predictions in a 501 bp window; the quantile score ranks that raw score against about 300,000 common variants scored on the same track. Track shapes are schematic. Source: AlphaGenome documentation.")

A raw log fold change of 0.5 means different things on tracks that swing widely and tracks that barely move, so AlphaGenome 1 also reports a quantile score. It scores about 300,000 common variants (minor allele frequency above 1% in gnomAD v3) on every track, ranks your variant's raw score against them and maps signed scores onto −1 to +1. A value near +1 says the alternate allele raises the signal more than almost any common variant does; near −1, it lowers it as much.

The quantile score is a rank, not a probability of harm. Common variants are mostly harmless, so beating 99% of them says the predicted molecular change is unusually large, nothing about disease. AlphaGenome 2 drops the quantile column and returns raw scores only, so a score copied from an AlphaGenome 1 analysis cannot be compared directly with one from the newer model.

## What the benchmarks show

AlphaGenome matched or beat the strongest external model in 25 of 26 variant effect evaluations and was state of the art on 22 of 24 track prediction tasks. The headline count hides a spread of margins, and Table 2 shows a few from the Nature paper.

  <caption><strong>Table 2. Selected variant effect benchmarks from the AlphaGenome paper.</strong> Each row compares AlphaGenome with the best external model the authors tested on that task.</caption>
  <thead>
    <tr>
      <th scope="col">Task and data</th>
      <th scope="col">Metric</th>
      <th scope="col">AlphaGenome</th>
      <th scope="col">Best other model</th>
    </tr>
  </thead>
  <tbody>
    <tr>
      <td>Direction of GTEx expression QTLs</td>
      <td>auROC</td>
      <td>0.80</td>
      <td>0.75 (Borzoi)</td>
    </tr>
    <tr>
      <td>Size of GTEx expression QTL effects</td>
      <td>Spearman ρ</td>
      <td>0.49</td>
      <td>0.39 (Borzoi)</td>
    </tr>
    <tr>
      <td>ClinVar deep intronic and synonymous splicing variants</td>
      <td>auPRC</td>
      <td>0.66</td>
      <td>0.64 (Pangolin)</td>
    </tr>
    <tr>
      <td>ClinVar missense variants affecting splicing</td>
      <td>auPRC</td>
      <td>0.18</td>
      <td>0.16 (Pangolin, DeltaSplice)</td>
    </tr>
    <tr>
      <td>MFASS exon-skipping variants</td>
      <td>auPRC</td>
      <td>0.51</td>
      <td>0.54 (Pangolin)</td>
    </tr>
    <tr>
      <td>Alternative polyadenylation</td>
      <td>Spearman ρ</td>
      <td>0.894</td>
      <td>0.790 (Borzoi)</td>
    </tr>
  </tbody>

Read the table by its rows, not its count. On expression direction the gain is large. On ClinVar splicing it is two points of auPRC over Pangolin, a specialist model, and on MFASS it lost. On missense variants that disrupt splicing, an auPRC of 0.18 means most of its top-ranked candidates are not real splice disruptors, although that is still well above chance: in the preprint's version of this set, 5,108 of 105,139 variants were positives, a base rate of about 0.05.

The tasks where AlphaGenome only tied are telling too. Zero-shot, it was comparable to Borzoi at picking causal expression QTLs from their linked neighbours, and on enhancer and gene linking it came within 1% auPRC of ENCODE-rE2G, a model trained for that task. Telling which variant in a block of correlated variants is causal is the question geneticists ask most, and it is where a single model's scores help least on their own.

## Reading the TAL1 case across outputs

The TAL1 case shows how to read a prediction when the outputs move in different directions. The insertion chr1:47239296 C>ACG sits about 7.5 kb from the TAL1 gene. In the CD34-positive myeloid progenitor tracks, the closest match the training data had to the cell of origin, AlphaGenome predicted H3K27ac and H3K4me1 to rise at the insertion, the repressive marks H3K9me3 and H3K27me3 to fall near the promoter, H3K36me3 to rise across the gene body and TAL1 RNA to go up.

Each of those is a different assay, and they agree on a mechanism: a new enhancer that activates the gene. That agreement is the evidence, more than the size of any single score. In silico mutagenesis then pointed to the cause; the alternate sequence introduced a MYB motif, matching the mechanism Mansour and colleagues found experimentally, and a second, ETS-like motif whose role the authors call "currently unknown".

The prediction was also not uniform across tissues. The effect was strongest in thymus and blood progenitor tracks. In a tissue where TAL1 is silent and the enhancer region is closed, the same insertion would score small. Reading the tissue that matches your question is the first check, and averaging across all tracks can hide a real effect.

The controls matter as much. The authors compared the insertion with length-matched, shuffled insertions at the same place, so the effect could be attributed to the sequence it created and not to any two extra bases. Scoring a few such controls next to a variant of interest costs a handful of API calls and turns a single number into a comparison.

## Where AlphaGenome stops working

The authors list the limits plainly in the paper. Distal elements more than 100 kb away remain hard, tissue-specific patterns and condition-specific effects "remain challenging", and the training data is "heavily focused on protein-coding genes". The model covers only human and mouse, and the evaluations are mostly human.

The largest gap for anyone thinking about patients is personal genomes. AlphaGenome predicts tracks for one reference sequence with one change. The paper says the model has not been benchmarked on predicting differences in expression between individuals from their own genomes, "a known weakness of models in this space". A prediction for variant X on the GRCh38 reference does not account for the other variants a real person carries nearby.

There is also no uncertainty estimate. A score comes without error bars, and the paper names certainty estimates as a needed addition. DeepMind's terms add the formal limit: predictions are "for theoretical modelling and research purposes only" and "must not be used for clinical decision-making".

For coding changes, AlphaGenome is the wrong first tool. It does not model protein structure or function, so a missense variant that breaks a protein but leaves expression and splicing alone scores near zero. [AlphaMissense](/guides/alphamissense), also from DeepMind, scores amino acid changes and covers that case.

## How to access AlphaGenome

AlphaGenome runs on DeepMind's servers. You request an API key from DeepMind, install the client with `pip install alphagenome` and call it from Python. The API is free for non-commercial use, query rates "vary with demand", and it suits analyses of thousands of predictions rather than genome-wide scans. The client supports windows of 16,384, 131,072, 524,288 and 1,048,576 bp; shorter windows are faster but give the model less context.

The terms limit outputs to non-commercial use and forbid using them to train other machine learning models. Commercial users go through Google Cloud for AlphaGenome 1, and AlphaGenome 2 is in private preview for commercial research.

The AlphaGenome 1 weights and research code are downloadable from Kaggle and Hugging Face under non-commercial model terms, and DeepMind recommends at least an H100 GPU to run them. AlphaGenome 2 weights have not been released; the technical report says they will follow final publication.

For many human questions, the cheapest route is a lookup rather than a prediction. AlphaGenome Atlas precomputes AlphaGenome 1 predictions for all of the roughly 9 billion possible single-base changes in GRCh38 and more than 100 million indels seen in large biobanks. It combines them with AlphaMissense and conservation into one AlphaGenome Variant Impact (AVI) score, scaled like CADD so that 20 marks the top 1% of predictions.

We checked the count: 3.1 billion positions with three alternative bases each gives about 9.3 billion changes. AVI downloads are available under permissive terms; the per-track Atlas features are non-commercial and API only.

AlphaGenome 2 targets the tissue gap. On the TenK10K single-cell data from 28 blood cell types, it recovered 30% of causal single-cell expression QTLs at 90% precision, against 16% for AlphaGenome 1 fine-tuned on single-cell data; for effect direction, 43% against 23%. Its own report still says that at high precision it "recovers only a minority" of fine-mapped expression QTLs and causal GWAS variants.

## How to read an AlphaGenome prediction

A prediction becomes useful when you ask it a narrow question and check it against something it did not produce. Table 3 turns the limits above into checks.

  <caption><strong>Table 3. Reading AlphaGenome variant predictions.</strong> What each output can and cannot show, and a cheap check for each.</caption>
  <thead>
    <tr>
      <th scope="col">You see</th>
      <th scope="col">It does not show</th>
      <th scope="col">Check</th>
    </tr>
  </thead>
  <tbody>
    <tr>
      <td>A large accessibility or histone change at the variant</td>
      <td>That the change reaches a gene</td>
      <td>Look for a matching RNA-seq change in a gene within about 35 kb, in the same tissue</td>
    </tr>
    <tr>
      <td>An RNA-seq change in one tissue</td>
      <td>That the gene is active in your tissue of interest</td>
      <td>Compare tissues and check the gene is expressed in the matched one</td>
    </tr>
    <tr>
      <td>A quantile score near +1 or −1</td>
      <td>Pathogenicity</td>
      <td>Treat it as a large molecular change, then look for clinical or experimental evidence</td>
    </tr>
    <tr>
      <td>A splice junction gain</td>
      <td>That the new transcript survives</td>
      <td>Compare with SpliceAI or Pangolin and, if it matters, an RNA assay</td>
    </tr>
    <tr>
      <td>A strong score for one variant in an LD block</td>
      <td>That this variant is the causal one</td>
      <td>Score every variant in the block and compare ranks, not single values</td>
    </tr>
    <tr>
      <td>Any effect from an indel</td>
      <td>That the effect is specific to the new sequence</td>
      <td>Score length-matched shuffled insertions at the same position</td>
    </tr>
  </tbody>

The habit that ties these together is to read several outputs for one variant in one matched tissue and ask whether they describe one mechanism. Agreement across assays, as in the TAL1 case, is stronger evidence than any single high score.

## Variant analysis tools on ProteinIQ

ProteinIQ does not host AlphaGenome; use DeepMind's API and Python client for it. For scoring DNA variants without tissue tracks, start with a genome language model and use the sequence utilities to prepare inputs.

- [Evo 2](/app/evo2): score a reference against an alternate sequence by model likelihood, with up to 1 Mb of context on the 7B model
- [Carbon](/app/carbon): compare reference and alternate DNA likelihoods with a second, independent DNA language model
- [CpG Island Finder](/app/cpg-island-finder): check whether a variant falls in a CpG island before reading methylation predictions
- [Reverse complement](/app/reverse-complement): flip a sequence to the strand a minus-strand gene or track expects

A language model score answers a different question from AlphaGenome's. Evo 2 says how unusual the alternate sequence looks against everything it learned, while AlphaGenome says which assays would change and where; running both on the same variant shows whether the two kinds of evidence agree.

## Frequently asked questions

### Is AlphaGenome free to use?

The AlphaGenome API is free for non-commercial use with a key from DeepMind, and query rates vary with demand. Commercial access to AlphaGenome 1 goes through Google Cloud, and AlphaGenome 2 is in private preview for commercial research.

### Can I run AlphaGenome locally?

Yes, for AlphaGenome 1. The research repository links model weights on Kaggle and Hugging Face under non-commercial model terms, and DeepMind recommends at least an NVIDIA H100 GPU. AlphaGenome 2 weights have not been released.

### How long a DNA sequence can AlphaGenome read?

Up to 1,048,576 bp (1 Mb) per prediction, with shorter windows of 16,384, 131,072 and 524,288 bp available in the client. The paper notes that elements more than 100 kb from a gene remain hard to model, so the outer part of the window adds less than its size suggests.

### What is an AlphaGenome quantile score?

In AlphaGenome 1, the quantile score ranks a variant's raw score against about 300,000 common gnomAD variants scored on the same track, mapped to −1 to +1 for signed scorers. A value near ±1 means an unusually large predicted molecular change, not a pathogenic variant. AlphaGenome 2 returns raw scores only.

### Can AlphaGenome be used for clinical diagnosis?

No. DeepMind's terms say predictions must not be used for clinical decision-making. The model has also not been benchmarked on predicting expression differences between individuals from personal genomes.

### How is AlphaGenome different from AlphaMissense?

AlphaMissense scores amino acid changes in proteins for likely pathogenicity, while AlphaGenome predicts how DNA changes alter regulatory assays such as expression, accessibility and splicing. AlphaGenome Atlas combines both, along with conservation, in its AVI score.
