# Isoelectric point of a protein: what pI means and how it is calculated
> The isoelectric point (pI) is the pH at which a protein carries zero net charge. Learn how calculators find it from the sequence, why EMBOSS, ExPASy (Bjellqvist), Lehninger and IPC 2.0 give different values, how pI is distributed across the human proteome, and how to use it for isoelectric focusing, ion exchange and solubility.
Hen egg-white lysozyme has an isoelectric point near pH 11. It is one of the most basic proteins in common lab use, and it is listed at a pI of 11 in the experimental benchmark that IPC 2.0 was trained on. Paste its mature sequence into a pI calculator and the answer is lower by almost two units: 9.3 with the Bjellqvist pKa values behind ExPASy's Compute pI/Mw, 9.2 with the [EMBOSS values our pI Calculator uses](/app/pi-calculator), and 8.4 with the IPC2_protein set.
None of these programs has a bug. All three count lysozyme's eight cysteines as free thiols that lose a proton above pH 8, but in the folded protein every one of them sits in a disulfide bond and carries no charge. Leave them out and the same calculators return 10.5 to 11.1. The isoelectric point is simple to define and simple to compute; the hard part is knowing which charges the sequence really carries.
## What the isoelectric point is
The isoelectric point (pI) is the pH at which a protein carries zero net charge. Below it the protein is net positive, above it net negative. At the pI itself the protein is not uncharged: lysozyme at pH 11 still has about a dozen positive arginines and lysines, balanced by an equal number of negative groups. The charges cancel, they do not vanish.
Seven side chains can carry charge: aspartate, glutamate, cysteine and tyrosine become negative when they lose a proton, and histidine, lysine and arginine are positive while they hold one. The free amino group at the N-terminus and the carboxyl group at the C-terminus add one positive and one negative group to every chain. Which of these side chains are [the most acidic and basic amino acids](/guides/most-acidic-and-basic-amino-acids), and their pKa values in free amino acids and in folded proteins, is covered separately.
Each group follows the Henderson-Hasselbalch equation, which links the pH to the ratio of deprotonated to protonated forms:
$$
\mathrm{pH} = \mathrm{p}K_a + \log_{10}\frac{[\mathrm{A^-}]}{[\mathrm{HA}]}
$$
Solved for the average charge of one group, a basic group carries $+1/(1+10^{\,\mathrm{pH}-\mathrm{p}K_a})$ and an acidic group carries $-1/(1+10^{\,\mathrm{p}K_a-\mathrm{pH}})$. When the pH equals the pKa, each is exactly half charged. Adding these terms over every ionizable group in the chain gives the net charge $Z$ at any pH:
$$
Z(\mathrm{pH}) = \sum_{i \in \{\mathrm{N},\,\mathrm{K},\,\mathrm{R},\,\mathrm{H}\}} \frac{n_i}{1 + 10^{\,\mathrm{pH} - \mathrm{p}K_i}} \;-\; \sum_{j \in \{\mathrm{C},\,\mathrm{D},\,\mathrm{E},\,\mathrm{Cys},\,\mathrm{Y}\}} \frac{n_j}{1 + 10^{\,\mathrm{p}K_j - \mathrm{pH}}}
$$
Here $n$ is the number of each group: one N-terminus (N) and one C-terminus (C), and as many K, R, H, D, E, Cys and Y as the sequence contains. The pI is the pH where $Z(\mathrm{pI}) = 0$. Every term falls as the pH rises, so $Z$ only ever decreases and there is exactly one such pH.
## How a pI calculator finds the zero
The sum above has no closed-form solution, so calculators search for it. Most use bisection: pick a pH range that brackets the answer, compute $Z$ at the midpoint, keep the half where the sign changes, and repeat until the interval is narrower than the reporting precision. EMBOSS iep describes the same model and states its assumption plainly: electrostatic interactions are taken not to change the ionization of any residue.
Lysozyme shows how quickly this converges. Its mature chain has 6 lysines, 11 arginines and 1 histidine against 7 aspartates, 2 glutamates, 3 tyrosines and 8 cysteines. With the EMBOSS pKa values, the net charge is +8.0 at pH 7, +0.9 at pH 9 and −2.9 at pH 10, so the zero lies between 9 and 10. Halving that interval seven times pins it to 9.21. The [protein charge plot](/app/charge-plot) draws the whole curve for any sequence, which shows how steeply it crosses zero.
The slope matters in practice. Where the curve is steep, a small error in one pKa moves the pI very little. Where it is flat, because no group titrates in that pH region, the same error can move the pI by a full unit. The Expasy documentation notes this for its own predictions: a protein's buffer capacity affects how accurate its predicted pI is.
## Why pI calculators give different answers
Every Henderson-Hasselbalch calculator uses the same equation. They differ in the nine pKa values they plug into it. Kozlowski collected the published sets in IPC, and Table 1 shows five that people meet most often.
Table 1. pKa sets used by common pI calculators. The Bjellqvist set also uses position-specific values for some terminal residues, for example 7.59 for an N-terminal alanine and 4.55 for a C-terminal aspartate. IPC2_protein values are fitted to measured protein pI, not to titration of individual groups. Sources: EMBOSS iep documentation; Kozlowski (2016, 2021).
pKa set
N-term
C-term
Asp
Glu
His
Cys
Tyr
Lys
Arg
EMBOSS
8.6
3.6
3.9
4.1
6.5
8.5
10.1
10.8
12.5
Bjellqvist (Expasy)
7.5
3.55
4.05
4.45
5.98
9.0
10.0
10.0
12.0
Lehninger
9.69
2.34
3.86
4.25
6.0
8.33
10.0
10.5
12.4
Solomon
9.6
2.4
3.9
4.3
6.0
8.3
10.1
10.5
12.5
IPC2_protein
5.779
6.065
3.766
4.497
5.492
7.89
11.491
9.247
10.223
The sets come from different experiments. Lehninger and Solomon are textbook values for free amino acids, which is why their terminal pKa values look like those of a single amino acid in water. EMBOSS uses its own default table.
Bjellqvist derived his values from the focusing positions of 29 polypeptides of known sequence in immobilized pH gradients, between pH 4.5 and 7.3 and in 9.2 to 9.8 M urea. They describe denatured proteins, the condition of the first dimension of a 2D gel, and Expasy notes that predictions for highly basic proteins have not been studied. A 1994 follow-up calibrated the pH scale of 2D maps against human proteins of known composition.
Kozlowski took the opposite route for IPC: instead of measuring groups, he optimized all nine values so that the plain Henderson-Hasselbalch sum best reproduces measured pI values. That is why IPC2_protein contains numbers no chemist would recognize, such as a C-terminal pKa of 6.07. They are not physical constants; they absorb average effects, including modifications, that a nine-number model cannot represent. IPC 2.0 then feeds the predictions of all 19 pKa sets into a support vector regression model built from 2,324 proteins with measured pI.
How much does the choice matter? On 581 proteins held out from training, the errors in Table 2 differ by about 0.2 pH units between the best and worst common sets. The best method still misses by 0.85 pH units on average (root mean square), and 247 of the 581 proteins, 43%, land more than half a unit from their measured pI. Peptides are much easier to predict.
Table 2. Hen egg-white lysozyme pI and benchmark error by method. Lysozyme values are our calculations for the mature chain (UniProt P00698, residues 19 to 147) with Kozlowski's IPC code, with all 8 cysteines counted or with the disulfide-bonded cysteines left out. Benchmark RMSE is the root-mean-square error against measured pI on IPC 2.0's held-out sets of 581 proteins and 29,774 peptides. Sources: Kozlowski (2021).
Method
Lysozyme pI, cysteines counted
Lysozyme pI, disulfides excluded
RMSE, proteins
RMSE, peptides
EMBOSS
9.21
11.07
1.05
0.60
Bjellqvist (Expasy)
9.33
10.47
0.94
0.41
Lehninger
9.19
10.85
0.96
0.77
Solomon
9.19
10.88
0.96
0.75
IPC2_protein
8.39
9.69
0.86
Not designed for peptides
IPC 2.0 machine-learning models
Not calculated
Not calculated
0.85
0.22
So the pKa set explains part of the disagreement between tools, and it is the smaller part. In lysozyme the cysteines move the answer by 1.1 to 1.9 units, several times the spread between pKa sets. The [IPC 2.0 isoelectric point calculator](/app/isoelectric-point-calculator) reports all 19 sets side by side with its trained models, so you can see how much of your own answer depends on the constants.
## Worked example: hen egg-white lysozyme
The UniProt entry [P00698](https://www.uniprot.org/uniprotkb/P00698/entry) gives a 147-residue precursor. Residues 1 to 18 are a signal peptide that is cut off during secretion, and the remaining 129 residues form four disulfide bonds, between cysteines 24 and 145, 48 and 133, 82 and 98, and 94 and 112 in precursor numbering. The mature chain is:
```text
>P00698 mature lysozyme C, residues 19-147
KVFGRCELAAAMKRHGLDNYRGYSLGNWVCAAKFESNFNTQATNRNTDGSTDYGILQINSRWWCNDGRTPGSRNLCNIPCSALLSSDITASVNCAKKIVSDGNGMNAWVAWRNRCKGTDVQAWIRGCRL
```
Counted as written, it gives 18 basic side chains plus the N-terminus against 9 carboxyl groups plus the C-terminus, 3 tyrosines and 8 cysteines. At pH 9 the carboxyls are fully negative and the arginines fully positive, and the outcome hangs on lysines, tyrosines and cysteines, all of which titrate between pH 8.5 and 10.8. Eight cysteines losing protons in that window drag the zero down to 9.2 with EMBOSS values.
In the folded protein none of those eight thiols can ionize, because each one is bonded to another cysteine. Delete them from the sequence and the remaining groups give pI 11.07 with EMBOSS values, 10.85 with Lehninger and 10.47 with Bjellqvist, close to the measured value of about 11.
EMBOSS iep has a `-disulphides` option for exactly this case. The signal peptide, by contrast, barely matters here: computing on the full 147-residue precursor shifts the EMBOSS value by only 0.04, because those 18 residues add one arginine and one cysteine, whose charges nearly cancel at pH 9.
Two lessons carry over to any protein. Paste the sequence of the molecule you actually have, and before trusting the number, check whether cysteines, modified residues or blocked termini make some of the counted groups fictional.
## Typical pI values and the bimodal proteome
Most proteins have a pI between 4 and 10. We calculated the pI of every reviewed human protein in UniProt release 2026_03, 20,391 canonical sequences made only of standard residues: with the IPC2_protein set, 99.0% fall between 4 and 10, the median is 6.52, and the extremes are 3.2 and 11.7.
The distribution is not a single hump. In 1,784 proteomes from all domains of life, Kiraga and colleagues found the same bimodal shape, an acidic and a basic group of proteins with few between them, and the minimum between the two fell between pH 7.22 and 7.54 in every proteome, with a mean of 7.41. Proteome-pI 2.0 now holds predictions from 21 methods for more than 61 million sequences in 20,115 proteomes.
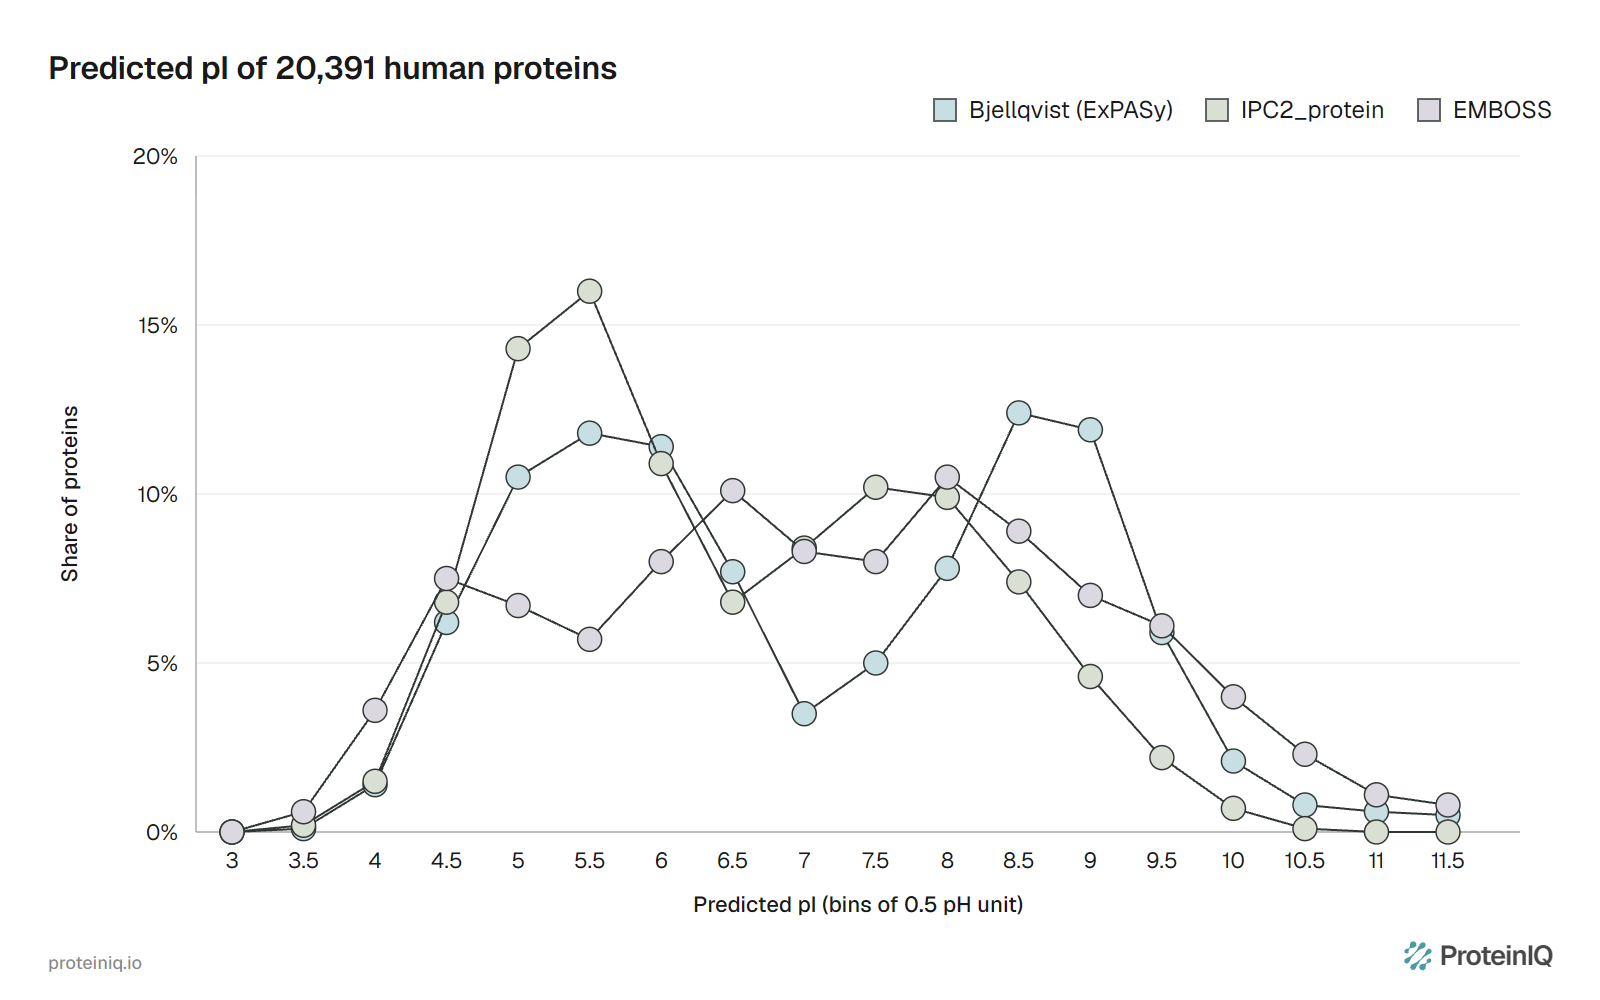
Our calculation shows how much of that shape comes from the constants. With Bjellqvist values, only 3.5% of human proteins land between pH 7.0 and 7.5, against 11.8% at 5.5 to 6.0 and 12.4% at 8.5 to 9.0.
With EMBOSS values the deepest gap moves to pH 5.5 to 6.0, and with IPC2_protein it becomes a shallow dip at 6.5 to 7.0. Each gap sits where a set has no group titrating: between histidine at 5.98 and the N-terminus at 7.5 for Bjellqvist, between glutamate at 4.1 and histidine at 6.5 for EMBOSS. Kiraga and colleagues note that the multiple peaks have been attributed to the pK values of the amino acid groups.
The real pattern also varies with biology. Across prokaryotes, species from saltier environments have more acidic proteomes, and intracellular parasites and endosymbionts have more basic ones. In their analysis of subcellular locations, mitochondrial proteins were the most basic and integral membrane proteins leaned basic; mitochondrial presequences are rich in basic residues, so an unprocessed precursor has a higher pI than its mature protein.
## What moves a real protein's pI
Sequence-based calculators assume an unmodified chain whose groups all behave like free amino acids. Real proteins break that assumption in five common ways.
Covalent chemistry changes the count of charged groups. Disulfide bonds remove cysteine thiols, as in lysozyme. Phosphorylation adds negative charge, acetylation of a lysine or of the N-terminus removes a positive one, and deamidation turns a neutral asparagine or glutamine into a negative acid.
ProMoST was built to calculate these shifts, and its authors note that the same modification moves the pI of different proteins by different amounts, because buffering capacity differs. Glycosylation can shift a protein's focusing position as well, and Expasy's calculator does not model any of these modifications.
Blocked N-termini are more common than databases admit. In Bjellqvist's 1994 study, 18 to 20 of 36 human proteins examined on 2D gels had a blocked N-terminus, only 6 of them annotated as such, and blockage was most likely when the first residue was methionine, serine or alanine. Each blocked terminus removes one positive charge, which matters most for small and near-neutral proteins.
The folded structure shifts individual pKa values. A side chain buried away from water, or sitting next to an opposite charge, can titrate several units from its model value. Lysines engineered into the core of staphylococcal nuclease had pKa values as low as 5.3. Shaw and colleagues showed that pI values estimated from model-compound pKa values can be wrong by more than one pH unit for a folded protein.
For a known structure, [PROPKA](/app/propka) estimates each residue's shifted pKa from the surrounding atoms, and [PDB2PQR](/app/pdb2pqr) uses such estimates to assign protonation states at a chosen pH.
Tags and leftover sequence count too. We calculated human ubiquitin (UniProt P0CG47, residues 1 to 76) with and without a 20-residue N-terminal tag, MGSSHHHHHHSSGLVPRGSH, a typical His-tag followed by a thrombin cleavage site. The six histidines and one arginine raise the pI from 6.20 to 7.51 with IPC2_protein values and from 7.54 to 9.14 with EMBOSS values.
A tag can therefore flip a protein's charge at pH 7, which changes how it binds an ion-exchange column. [Signal peptides](/guides/what-is-signalp-6) and transit peptides work the same way in reverse: they are part of the database sequence but not of the protein you purify.
Conditions differ between experiments. The Bjellqvist constants describe proteins denatured in urea, while native isoelectric focusing, ion exchange and solubility involve the folded protein in buffer. A sequence-based pI is most trustworthy for the denaturing first dimension of a 2D gel and least trustworthy for a folded protein with buried or coupled charges.
## Using the isoelectric point in the lab
Isoelectric focusing turns the definition into a separation. In a pH gradient under an electric field, a protein migrates until it reaches the pH where its net charge is zero, and stops there. Immobilized pH gradients, the method behind the Bjellqvist constants, made those focusing positions reproducible enough to compare with calculated pI.
O'Farrell's two-dimensional electrophoresis put isoelectric focusing in the first dimension and SDS electrophoresis by size in the second. It resolved 1,100 components from *E. coli* and could separate proteins differing by a single charge, which is how charge-changing modifications show up as separate spots.
Ion-exchange chromatography uses the sign of the net charge. Below its pI a protein is net positive and binds a cation exchanger; above its pI it is net negative and binds an anion exchanger. The calculated pI tells you which side you are on, but with a typical error near one pH unit, a buffer only a few tenths from the predicted pI is a guess. Choose a pH well on the intended side and confirm binding on a small scale. Local charge patches also let some proteins bind an exchanger on the "wrong" side of their pI.
Solubility usually reaches its minimum near the pI, where molecules carry no net charge to repel each other. Shaw and colleagues replaced acidic surface residues of ribonuclease Sa with lysines, raising its pI from 3.5 to 6.4 and 10.2. The pH of minimum solubility moved with the pI in each variant, while the pH of maximum activity and maximum stability did not. Storage and formulation buffers are therefore usually set away from the pI, and [Protein-Sol](/app/protein-sol) reports a predicted pI next to its solubility score.
## pI tools on ProteinIQ
The [pI Calculator](/app/pi-calculator) runs in the browser with the fixed EMBOSS pKa values and bisection described above, and returns one row per sequence for FASTA, CSV or PDB input. It is the quickest way to compare many sequences on one consistent scale, for example tagged and untagged constructs.
The [IPC 2.0 isoelectric point calculator](/app/isoelectric-point-calculator) runs Kozlowski's program, with all 19 pKa sets, the protein and peptide machine-learning models and per-residue pKa prediction. Use it when you want the most accurate sequence-based estimate or want to see how far the pKa sets disagree for your protein.
The [protein charge plot](/app/charge-plot) draws net charge from pH 0 to 14, which shows the charge at your buffer pH and how steep the curve is near the pI. [Protein Parameters](/app/protein-parameters) reports pI alongside molecular weight, extinction coefficient and stability indices, and [PROPKA](/app/propka) estimates residue pKa values from a 3D structure when buried or interacting groups make the sequence-based answer doubtful. Before calculating, [make a FASTA file](/guides/how-to-make-a-fasta-file) of the mature sequence you actually express.
## Frequently asked questions
### Is a protein uncharged at its isoelectric point?
No. Its net charge is zero, but it still carries many positive and negative groups that cancel. The surface can also have positive and negative patches, which is why a protein at its pI can still bind other molecules or a chromatography resin.
### Why does my pI differ between ExPASy, EMBOSS and other calculators?
They use different pKa sets (Table 1), and Expasy adds terminal-residue corrections and processes database entries to their mature form. For one sequence the difference is usually a few tenths of a unit, but it can exceed one unit, as with human ubiquitin, which gives 6.20 with IPC2_protein and 7.54 with EMBOSS values.
### How accurate is a calculated isoelectric point?
For proteins, the best sequence-based method in the IPC 2.0 benchmark had a root-mean-square error of 0.85 pH units, and the common pKa sets 0.94 to 1.05. For peptides the error falls to about 0.2 to 0.4 units. Expect larger errors for modified, disulfide-rich or very basic proteins.
### Should I include the His-tag when calculating pI?
Yes, if the tag is on the protein you load onto the column or gel. A His-tag adds six histidines and often other charged residues; on ubiquitin, a 20-residue tag raised the calculated pI by 1.3 to 1.6 units. Calculate the tagged and cleaved forms separately when you plan to remove the tag.
### Is the pI the same as a pKa?
No. A pKa belongs to one ionizable group and is the pH at which that group is half protonated. The pI belongs to the whole molecule and is the pH at which all the group charges sum to zero. For a free amino acid with no ionizable side chain, the pI is simply the average of its two backbone pKa values.