# Cryo-EM vs X-ray crystallography vs NMR vs AlphaFold

> X-ray crystallography, cryo-EM and NMR record signals from real protein, and AlphaFold predicts from sequence. Comparing 371 calmodulin structures in the PDB shows why a flexible protein has no single experimental answer for a prediction to match, and what each method is best at.

## How do cryo-EM, X-ray crystallography, NMR and AlphaFold differ?

X-ray crystallography, cryo-EM and NMR are experiments: each records a signal from real protein and fits a model to it. AlphaFold is not an experiment. It [predicts a structure from the sequence](/use-cases/protein-structure-prediction), using patterns learned from the structures that the three experiments produced.

The four can disagree about one small protein. We took 371 full-length calmodulin chains from the PDB, 187 from crystallography, 137 from cryo-EM and 47 from NMR, fitted both lobes of each one and measured how far apart two entries are. The median pair differs by 10.7 Å, because the lobes sit about 40 Å apart in some entries and about 23 Å apart in others.

The AlphaFold Database model sits a median of 11.4 Å from the experimental entries, about as far as they sit from one another, and the closest entry is 5.2 Å away. For a flexible protein there is no single experimental answer for a prediction to match.

Three questions decide which method fits a project: how big the particle is, how much of it holds still, and whether it will crystallize. AlphaFold changes the order of work more than it replaces a method, because a prediction is the cheapest first model and an experiment tells you whether it is right for your question. For cryo-EM, [ModelAngelo](/app/modelangelo) and [CryoAtom](/app/cryoatom) turn a density map into a first atomic model.

## What each method records

Each method measures something different, and the model you download is an interpretation of that measurement (Table 1).

  <caption><strong>Table 1. What each method measures and where it stops.</strong> Summarized from the primer on single-particle cryo-EM, the review of the crystallographic phase problem, a review of NMR size limits and the AlphaFold paper.</caption>
  <thead>
    <tr>
      <th scope="col">Method</th>
      <th scope="col">What is measured</th>
      <th scope="col">Sample</th>
      <th scope="col">What you get</th>
      <th scope="col">Where it stops</th>
    </tr>
  </thead>
  <tbody>
    <tr>
      <td>X-ray crystallography</td>
      <td>Diffraction from a crystal, averaged over every molecule in it</td>
      <td>A well-ordered crystal</td>
      <td>An electron density map and one averaged model</td>
      <td>Needs crystals, packing can fix the conformation, phases must be found</td>
    </tr>
    <tr>
      <td>Cryo-EM</td>
      <td>Images of single particles frozen in thin ice, sorted into classes and averaged</td>
      <td>Purified particles, no crystal</td>
      <td>A density map, sometimes several classes</td>
      <td>Small particles give low contrast, flexible regions blur, the map must be built into a model</td>
    </tr>
    <tr>
      <td>Solution NMR</td>
      <td>Signals from nuclei in a magnetic field: distances, angles and relaxation</td>
      <td>Isotope-labeled protein, concentrated, in solution</td>
      <td>An ensemble of models that satisfy the restraints, plus rates of motion</td>
      <td>Signals crowd as the protein grows, so size is the usual limit</td>
    </tr>
    <tr>
      <td>AlphaFold</td>
      <td>Nothing is measured; a neural network predicts coordinates</td>
      <td>A sequence and an alignment of related sequences</td>
      <td>One model with a confidence for each residue</td>
      <td>Learned from the PDB, no ligands, usually one conformation</td>
    </tr>
  </tbody>

Those differences set what a coordinate file can claim. A crystal records the average over all the molecules packed in its lattice, and diffraction does not record phases, which must come from a related structure, heavy atoms or anomalous scattering. Even so, two crystal forms of the same protein differ by a median Cα [RMSD](/guides/rmsd) of 0.6 Å, a baseline worth remembering when a prediction is called 1 Å off.

Cryo-EM needs no crystal. It images individual particles frozen in thin ice and averages them in three dimensions, so a region that takes many positions blurs out of the map while the rigid core sharpens.

NMR sees the protein in solution and measures motion directly, but only for what its signals can resolve, which in practice means small proteins. AlphaFold has no measurement at all. It returns coordinates and a confidence for each residue, and that confidence is the network's own estimate, not a measurement on your sample.

## Cryo-EM vs X-ray crystallography in the PDB

Cryo-EM wins on particle size and on proteins that will not crystallize. X-ray crystallography still wins on resolution and on the number of entries. The [PDB's method mix](/guides/rcsb-statistics) shows both: of 262,513 experimental entries on November 7, 2026, crystallography accounts for 209,240 (79.7%), cryo-EM for 37,856 (14.4%) and NMR for 14,762 (5.6%).

The yearly counts show the direction. Crystallography released 10,081 entries in 2025 and cryo-EM 7,198, which is 71% of the crystallography count, and cryo-EM has grown every year since 2012. NMR fell from 647 releases in 2008 to 224 in 2025. We counted entries by method and release year from the RCSB API, and the [counts and script](/data/guides/cryo-em-vs-x-ray-nmr-alphafold/pdb-releases-by-year.csv) are public.
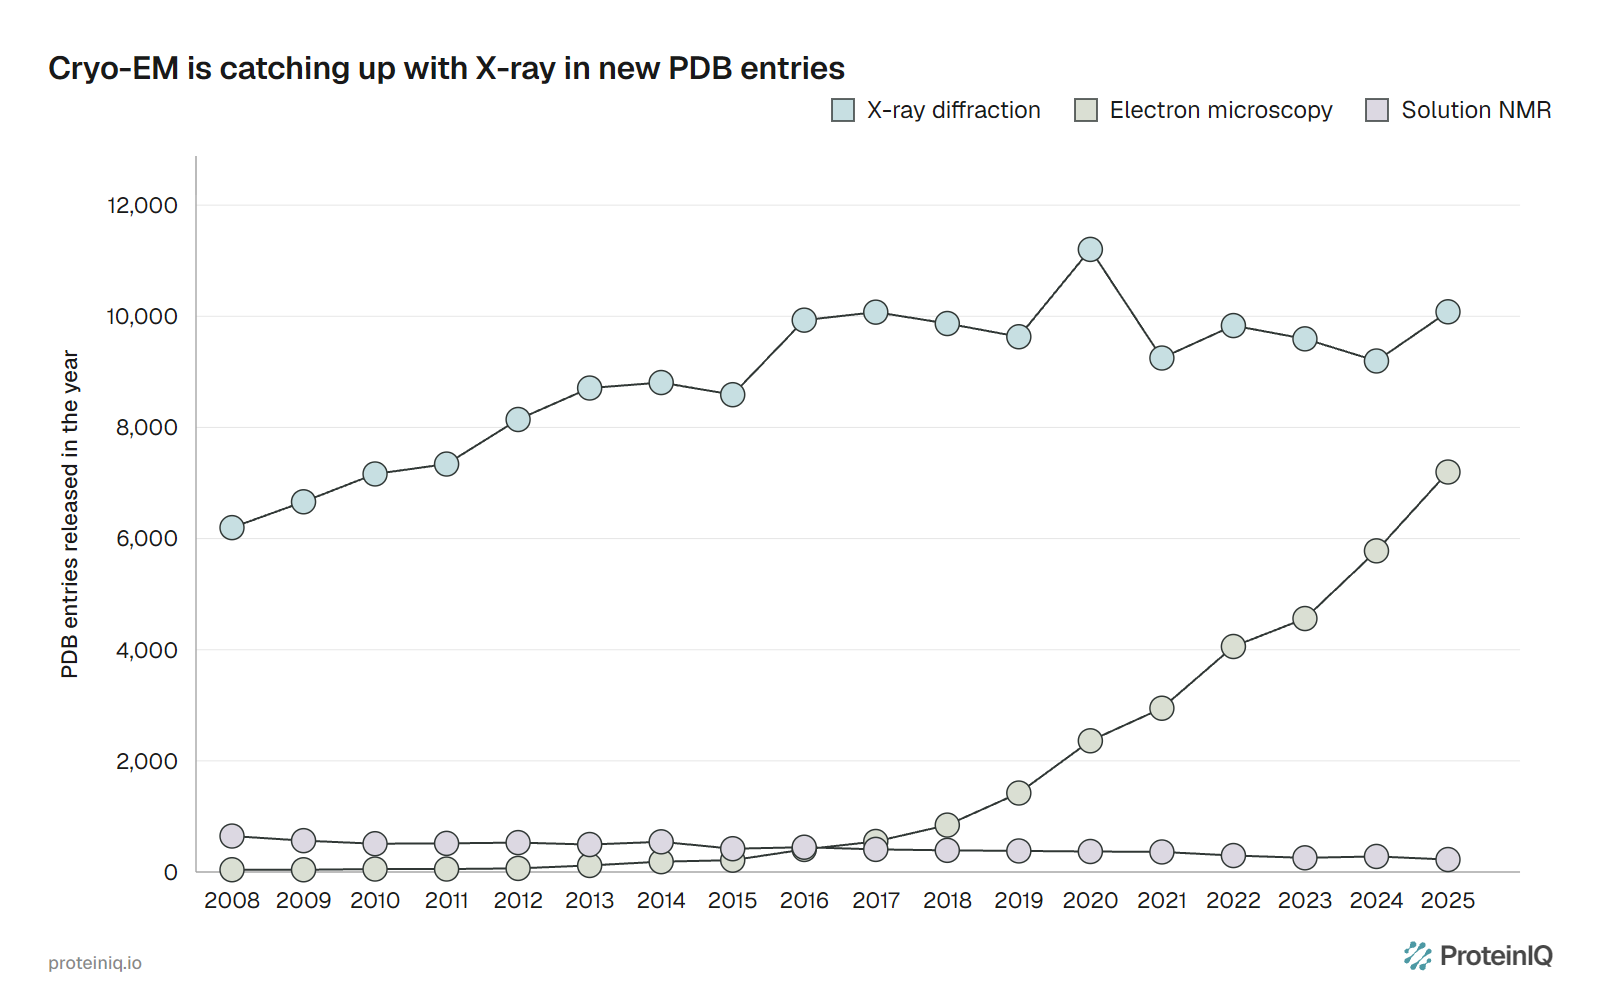
![Line chart of PDB entries released per year from 2008 to 2025 for X-ray diffraction, electron microscopy and solution NMR, with X-ray near 10,000 and electron microscopy rising to 7,198](/images/charts/pdb-releases-by-method-per-year.webp "**Figure 1. PDB entries released per year by method, 2008 to 2025.** Entries counted by experimental method and initial release year. Source: RCSB PDB Search API, queried November 7, 2026.")

Resolution is the other half. The median crystal structure released in 2025 has a resolution of 1.94 Å and the median cryo-EM structure 3.14 Å. The cryo-EM median was 4.8 Å in 2015, after direct electron detectors replaced older cameras, a change Kühlbrandt called a resolution revolution.
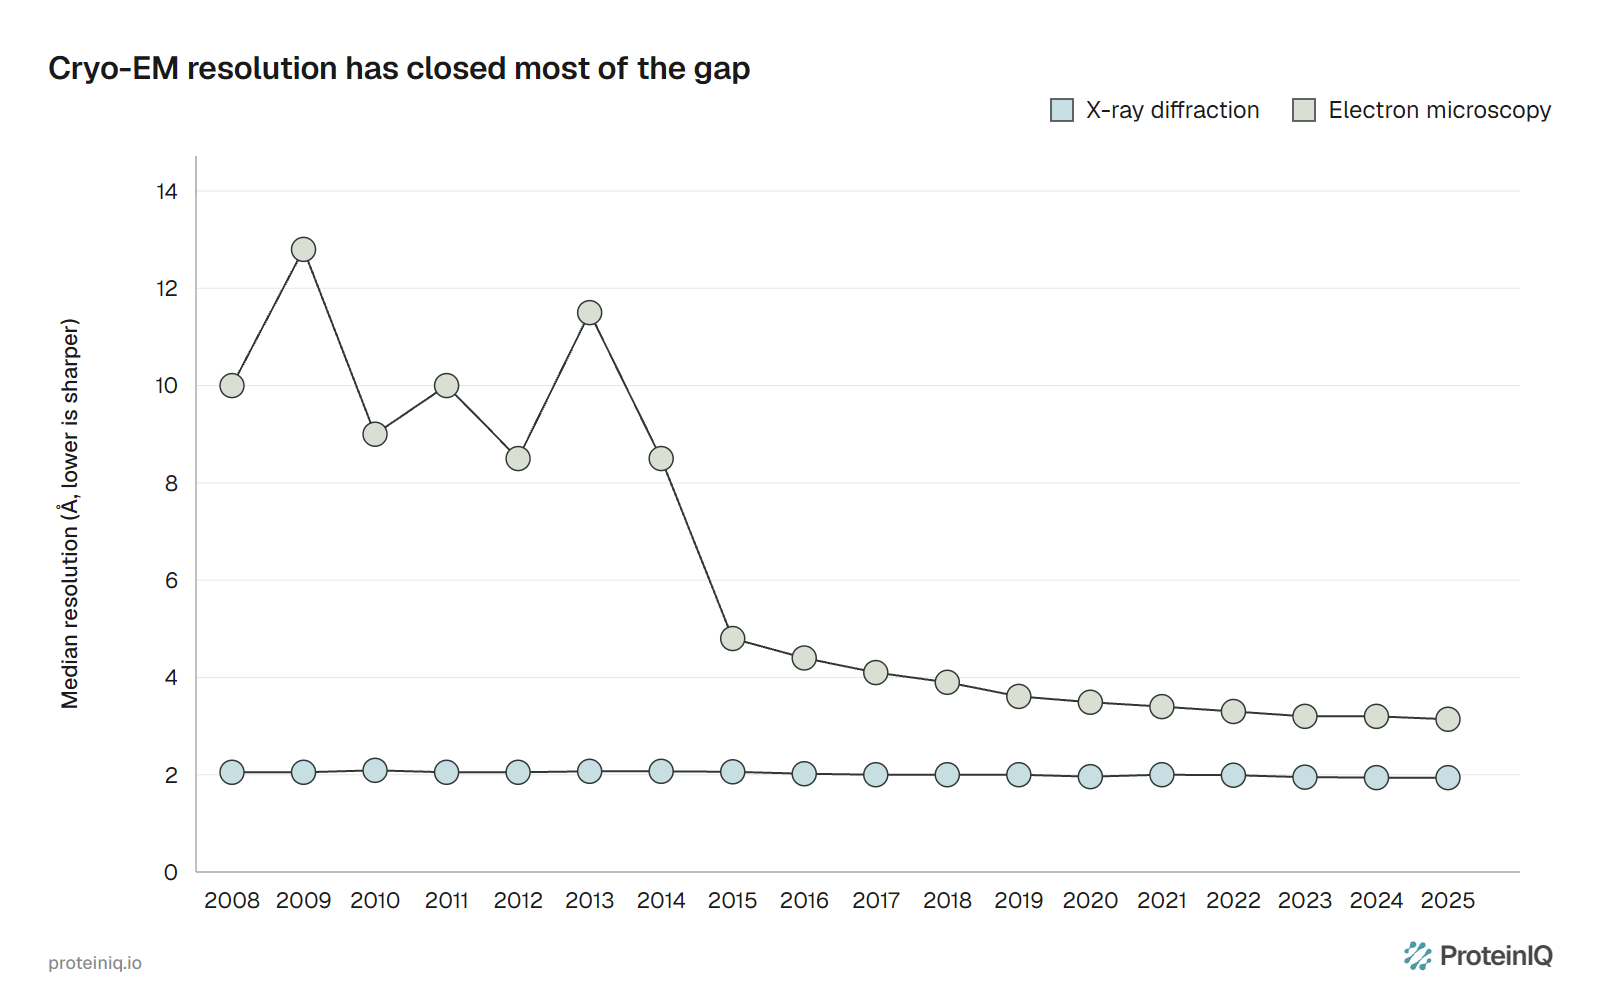
![Line chart of median resolution of PDB entries released each year, X-ray flat near 2 Å and electron microscopy falling from about 10 Å in 2008 to 3.14 Å in 2025](/images/charts/pdb-median-resolution-x-ray-vs-cryo-em.webp "**Figure 2. Median resolution of PDB entries by release year.** Median of the combined resolution field per method and year, lower is sharper. Cryo-EM years before 2013 hold 41 to 65 entries each. Source: RCSB PDB Search API, queried November 7, 2026.")

Table 2 puts numbers on the gap for entries released from 2021 to 2025. A little over half of crystal structures reach 2.0 Å or better, against 1.0% of cryo-EM structures, and 93.4% reach 3.0 Å against 35.6%. Only 6 cryo-EM entries in that period reach 1.5 Å, against 8,530 crystal structures.

  <caption><strong>Table 2. Resolution and size of PDB entries released from 2021 to 2025.</strong> Shares of each method's entries, calculated from RCSB Search API counts on November 7, 2026. Mass is the deposited model summed over all chains in the entry, not the mass of one protein.</caption>
  <thead>
    <tr>
      <th scope="col">Measure</th>
      <th scope="col">X-ray (47,953 entries)</th>
      <th scope="col">Cryo-EM (24,543 entries)</th>
      <th scope="col">NMR (1,416 entries)</th>
    </tr>
  </thead>
  <tbody>
    <tr>
      <td>Resolution 2.0 Å or better</td>
      <td>54.6%</td>
      <td>1.0%</td>
      <td>Not applicable</td>
    </tr>
    <tr>
      <td>Resolution 3.0 Å or better</td>
      <td>93.4%</td>
      <td>35.6%</td>
      <td>Not applicable</td>
    </tr>
    <tr>
      <td>Model under 30 kDa</td>
      <td>22.2%</td>
      <td>1.0%</td>
      <td>97.7%</td>
    </tr>
    <tr>
      <td>Model under 100 kDa</td>
      <td>76.6%</td>
      <td>11.4%</td>
      <td>99.6%</td>
    </tr>
    <tr>
      <td>Model 300 kDa or larger</td>
      <td>3.3%</td>
      <td>45.6%</td>
      <td>0%</td>
    </tr>
    <tr>
      <td>Median model mass, 2025 releases</td>
      <td>49 kDa</td>
      <td>244 kDa</td>
      <td>7.7 kDa</td>
    </tr>
  </tbody>

Size is the larger difference. Most cryo-EM entries describe assemblies, and only 2.9% of those released since 2021 have a model under 50 kDa. Small particles are hard because they give little contrast, though scaffolds help: the 64 kDa hemoglobin tetramer reached 3.2 Å with a phase plate, and the 19 kDa KRAS reached resolutions as good as 2.9 Å bound to a designed scaffold.

At the sharp end, cryo-EM now reaches atomic resolution on ideal samples. Mouse apoferritin was solved at 1.22 Å and 1.25 Å in two independent studies, good enough to see hydrogen atoms in difference maps. That is a benchmark sample, not a typical project; the median is still 3.14 Å.

In practice the sample chooses the method. A rigid 30 kDa enzyme that crystallizes belongs with crystallography, a 500 kDa complex that will not crystallize belongs with cryo-EM, and a small domain with a floppy tail belongs with NMR.

## Building a model into a cryo-EM map

A cryo-EM reconstruction is a density map, not a model, and something has to decide which atoms sit where. Jamali and colleagues note that experts can build atomic models with few errors at resolutions better than 3 Å, and they advise checking any automatic model by hand at resolutions worse than 3.5 to 4.0 Å.

[ModelAngelo](/app/modelangelo), from the Scheres group at the MRC Laboratory of Molecular Biology, places residues with a graph neural network, reads their identities from the map and, given sequences, fits them onto the built chains. On 177 test maps better than 4 Å, released after its training set, it built 77% of all 410,585 residues, and 85% once residues with deposited Q-scores below 0.4 were set aside.

Without sequences, ModelAngelo writes a profile for each chain that a sequence search can match to a proteome. In a phycobilisome and photosystem supercomplex, that identified all 6 chains the original authors had left unidentified.

[CryoAtom](/app/cryoatom) builds on the same idea with local attention and a 3D rotary position embedding. Its paper reports more complete models, a lower resolution requirement and faster modeling than ModelAngelo.

In the preprint of this work, backbone recall on 104 maps at 4 to 7 Å was 43.0% against 25.8% for ModelAngelo, with lower precision on high-resolution maps because it builds regions that the deposited model leaves out. The hosted CryoAtom2 adds DNA and RNA modeling, which the project README describes.

An AlphaFold model gives a second route to the same map. Terwilliger and colleagues docked a trimmed AlphaFold model into the density, rebuilt it and fed it back as a template. That raised the number of 25 cryo-EM structures with at least 90% of Cα atoms within 3 Å of the deposited model from 12 to 20.

On ProteinIQ, ModelAngelo built 549 residues of the Cas12m3 protein as one chain, with its guide RNA and target DNA, from a 2.4 Å map in five minutes. Both tools produce a first draft. Check its geometry with [MolProbity](/app/molprobity) and refine it against the map, because ModelAngelo ignores cofactors and neither tool sees what the map does not show.

## NMR: small proteins and the motion crystals freeze

NMR is the method for proteins that are small and moving. Of the 1,416 NMR entries released since 2021, 97.7% have a deposited model under 30 kDa, and the median 2025 entry is 7.7 kDa. Conventional amide-based NMR is generally limited to proteins of about 30 kDa or less, and methyl labeling of a deuterated protein pushes that limit toward 1 MDa.

The extension has a catch. Sprangers and Kay used methyl labeling to study the dynamics and binding of the 670 kDa 20S proteasome core particle, which is a different job from determining a new structure.

What NMR gives back is motion. Relaxation experiments show which residues move and how fast, and NMR has long been instrumental in characterizing intrinsically disordered proteins, whose regions crystals and cryo-EM maps usually fail to resolve. For a protein like calmodulin, below, that is the experiment that explains why the others disagree.

An NMR ensemble is not a movie, though. Its spread shows where the restraints do not fix the structure, which can be real motion or missing data. Fowler and Williamson found that NMR ensembles tend to be "too floppy" compared with the rigidity their own chemical shifts imply.

## AlphaFold vs experimental structure

AlphaFold learned from PDB structures released up to 30 April 2018, so it is built from the experiments rather than independent of them. In the CASP14 assessment its median backbone accuracy was 0.96 Å r.m.s.d.<sub>95</sub>, against 2.8 Å for the next best method. How close that puts it to experiment depends on which experiment you ask (Table 3).

  <caption><strong>Table 3. How close AlphaFold comes to each experimental method.</strong> Each row is a different study with its own population and metric, so the rows should not be compared with one another.</caption>
  <thead>
    <tr>
      <th scope="col">Method</th>
      <th scope="col">Study and population</th>
      <th scope="col">Result</th>
    </tr>
  </thead>
  <tbody>
    <tr>
      <td>X-ray crystallography</td>
      <td>215 crystal structures released after AlphaFold's training cutoff, predictions against deposited models and density maps</td>
      <td>Median Cα RMSD of 1.0 Å, against 0.6 Å between two crystal forms of the same protein. Mean map-model correlation of 0.56 for predictions and 0.86 for deposited models</td>
    </tr>
    <tr>
      <td>X-ray phasing</td>
      <td>34 CASP14 crystal structures, molecular replacement with AlphaFold2 models</td>
      <td>31 solved, 2 partly solved, 1 not solved</td>
    </tr>
    <tr>
      <td>NMR, chemical shifts</td>
      <td>904 human proteins with an AlphaFold Database model and an NMR structure</td>
      <td>AlphaFold ahead by 50 ANSURR points or more in 273 proteins (30%), NMR ahead by that much in 22 (2%)</td>
    </tr>
    <tr>
      <td>NMR, restraint fit</td>
      <td>9 blind targets of 70 to 108 residues</td>
      <td>For 8 of 9, backbone RMSD of 0.65 to 1.08 Å from the NMR medoid on well-defined residues</td>
    </tr>
    <tr>
      <td>Cryo-EM</td>
      <td>25 cryo-EM structures, prediction docked and rebuilt in the density</td>
      <td>Structures with at least 90% of Cα atoms within 3 Å of the deposit rose from 12 to 20</td>
    </tr>
    <tr>
      <td>Alternative conformations</td>
      <td>98 fold-switching proteins, five predictions each</td>
      <td>94% of predictions matched one known conformation but not the other</td>
    </tr>
    <tr>
      <td>Binding pockets</td>
      <td>225 proteins with known ligand-binding sites</td>
      <td>Pockets with mean pLDDT above 90 overlapped known sites like experimental pockets; low-confidence pockets generally did not</td>
    </tr>
  </tbody>

Against crystals the gap is small but measurable. The 1.0 Å median is about twice the 0.6 Å between crystal forms, and even among residues with pLDDT above 90 about 10% of Cα atoms were more than 2 Å from the deposit. Against NMR, AlphaFold often does as well as the deposited ensemble, which says something about the ensembles as well as the predictions.

The failures are about what the network was never asked. AlphaFold does not take ligands, covalent modifications or the environment into account, and it returns one conformation. For the 98 fold-switching proteins, 74% of residues had moderate to high confidence even though the prediction matched only one of the two states.

Used as a hypothesis, a prediction speeds up the experiment. That is the conclusion of Terwilliger and colleagues, who titled their paper that AlphaFold predictions are valuable hypotheses that accelerate but do not replace experimental structure determination.

Read the model's own scores first to see [whether a predicted structure is reliable](/guides/structure-prediction-confidence), starting with [pLDDT](/guides/plddt) for local confidence and [PAE](/guides/pae) for how the parts sit relative to each other.

## When the methods disagree: calmodulin

Calmodulin is a 148-residue calcium sensor made of two lobes joined by a central helix. In the 1.7 Å crystal structure of the free protein with calcium (PDB 1CLL) it is an extended dumbbell. With a peptide from a target enzyme (1CDL) the central helix unwinds and both lobes wrap around the peptide in a compact arrangement. NMR relaxation shows why: the middle of the central helix is mobile and the two lobes tumble almost independently.

We asked how a prediction fits that spread. We took the Cα atoms of 371 full-length calmodulin chains from the PDB (at least 95% identical to the human sequence, 187 from X-ray, 137 from cryo-EM and 47 from NMR), and fitted both lobes together on residues 6 to 65 and 85 to 147.

We measured the [RMSD](/guides/rmsd) of every pair of entries, using the first model of each, and did the same against the AlphaFold Database model AF-P0DP23-F1, version 6. The [script and results](/data/guides/cryo-em-vs-x-ray-nmr-alphafold/calmodulin_compare.py) reproduce the numbers.
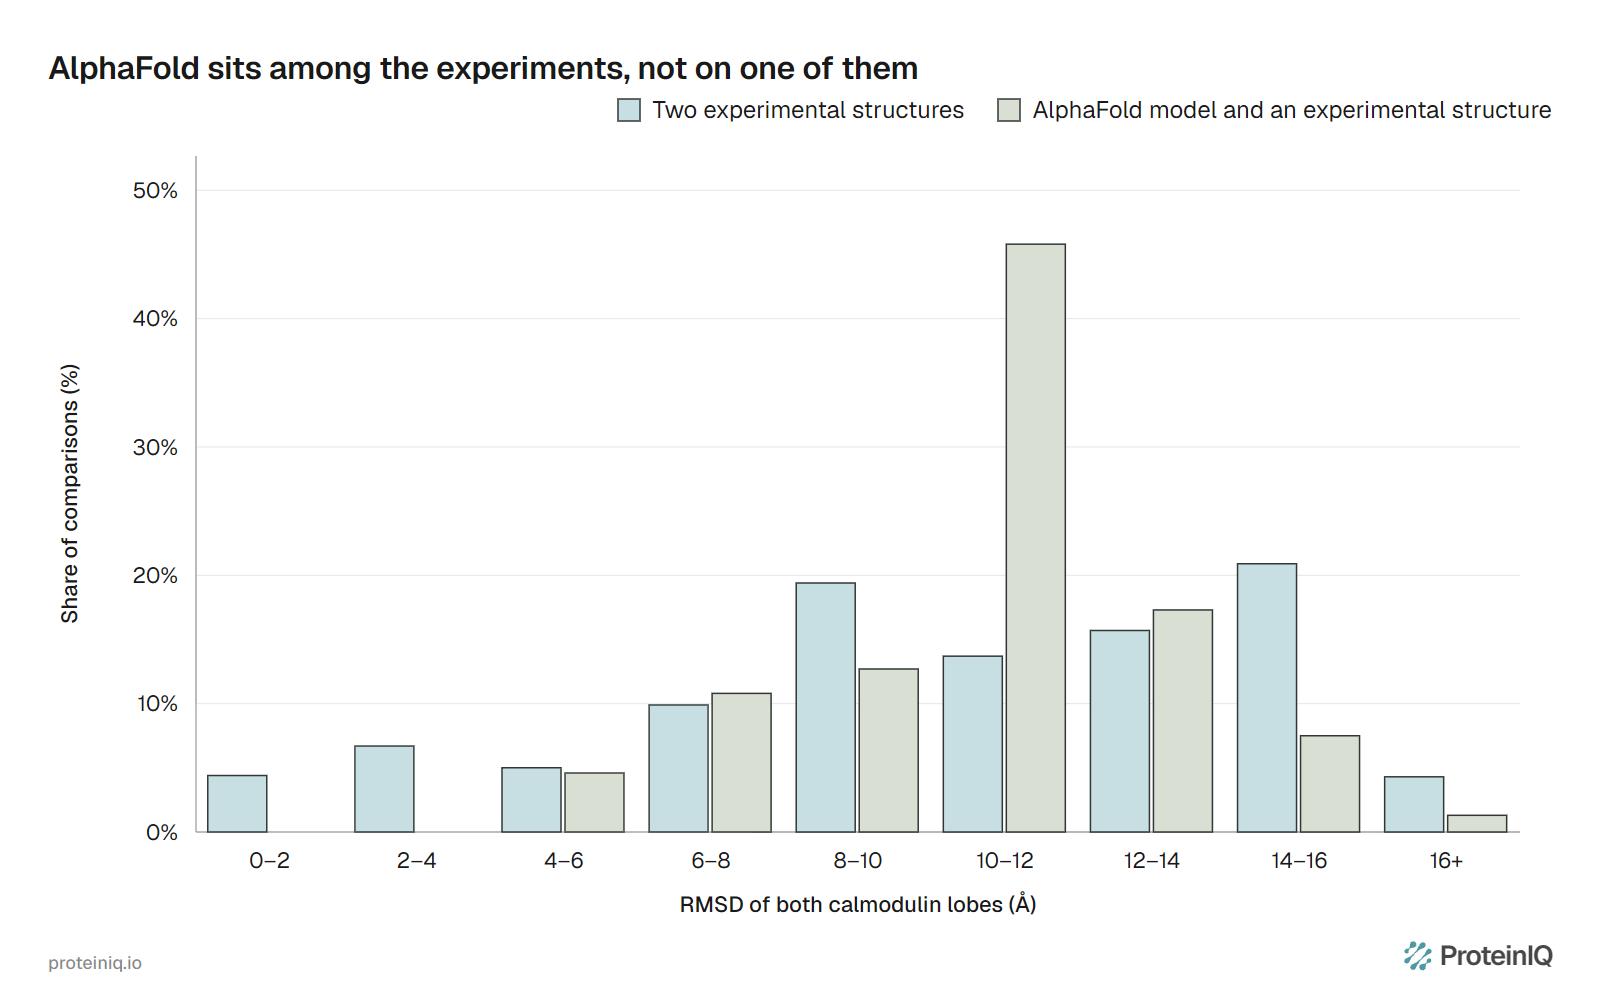
![Grouped bar chart of the share of comparisons by RMSD bin for pairs of experimental calmodulin structures and for the AlphaFold model against each experimental structure, with the AlphaFold distribution peaking at 10 to 12 angstroms](/images/charts/calmodulin-experiment-vs-alphafold-rmsd.webp "**Figure 3. Calmodulin entries against each other and against AlphaFold.** RMSD of both lobes fitted together on Cα atoms, first model of each of 371 PDB chains. The first series is the 68,632 pairs of experimental entries, the second the 371 comparisons with AlphaFold Database model AF-P0DP23-F1 (version 6). We calculated the values from RCSB model server coordinates.")

Two experimental entries differ by a median of 10.7 Å, with the middle 80% of pairs between 3.6 and 15.2 Å. The AlphaFold model differs from an experimental entry by a median of 11.4 Å, between 6.4 and 13.3 Å for the middle 80%. It is not an outlier, and it is not close to any single entry either: the nearest is 5.2 Å away, the crystal structure of calmodulin bound to a cardiac sodium channel peptide (5DBR).

Each lobe matches the crystal structure. Fitted on its own, the model superposes on the 1CLL crystal structure to 0.83 Å for the N-terminal lobe and 0.50 Å for the C-terminal lobe. The whole protein still differs by 6.0 Å, because after the N-terminal lobes are aligned the C-terminal lobe has to be rotated by 74° to match.

The pLDDT of about 85 hides this, and the [PAE](/guides/pae) between the lobes is what shows that the model has no confident opinion about it.

  <caption><strong>Table 4. Six experimental calmodulin entries against the AlphaFold model.</strong> Lobe distance is the distance between the centers of the Cα atoms of the two lobes. RMSD is for both lobes fitted together on the AlphaFold Database model. First model of each entry, except the NMR ensemble. We calculated the values from PDB coordinates.</caption>
  <thead>
    <tr>
      <th scope="col">Entry</th>
      <th scope="col">Method and state</th>
      <th scope="col">Lobe distance</th>
      <th scope="col">RMSD to AlphaFold model</th>
    </tr>
  </thead>
  <tbody>
    <tr>
      <td>AlphaFold Database model</td>
      <td>Prediction, no ligands</td>
      <td>38.8 Å</td>
      <td>Reference</td>
    </tr>
    <tr>
      <td>1CLL</td>
      <td>X-ray, free with calcium, extended</td>
      <td>40.0 Å</td>
      <td>6.0 Å</td>
    </tr>
    <tr>
      <td>1CDL</td>
      <td>X-ray, bound to a target peptide, compact</td>
      <td>22.8 Å</td>
      <td>11.5 Å</td>
    </tr>
    <tr>
      <td>2BBM</td>
      <td>NMR, bound to a target peptide, compact</td>
      <td>23.8 Å</td>
      <td>11.1 Å</td>
    </tr>
    <tr>
      <td>1CFC</td>
      <td>NMR, calcium-free, 20 models</td>
      <td>31.7 to 40.5 Å</td>
      <td>4.7 to 10.0 Å</td>
    </tr>
    <tr>
      <td>9ZN7</td>
      <td>Cryo-EM at 2.23 Å, bound to the ryanodine receptor RyR1</td>
      <td>41.8 Å</td>
      <td>6.3 Å</td>
    </tr>
    <tr>
      <td>7BYL</td>
      <td>Cryo-EM at 2.5 Å, bound to the KCNQ4 channel</td>
      <td>31.1 Å</td>
      <td>11.9 Å</td>
    </tr>
  </tbody>

Every row is a real state of the same protein. Crystal packing, a bound peptide and a bound channel each fix a different arrangement, and the 20 models of the calcium-free NMR ensemble span a range of lobe distances of their own. Across all 750 NMR models, only five come within 5 Å of the prediction, at 4.6 to 4.8 Å, and they come from three ensembles that each span many arrangements.

The lesson is about the question, not the method. A single calmodulin structure from any source answers where the lobes were under one set of conditions. To ask where they go, you need several experiments in different states, and the prediction is one more point to place among them.

## Choosing a method, or combining them

The practical choice follows the question, and several questions need more than one method (Table 5).

  <caption><strong>Table 5. Which method to start with, what to add and what to check.</strong> A decision aid based on the evidence above, not a ranking.</caption>
  <thead>
    <tr>
      <th scope="col">Question</th>
      <th scope="col">Start with</th>
      <th scope="col">Add</th>
      <th scope="col">Check</th>
    </tr>
  </thead>
  <tbody>
    <tr>
      <td>Atomic detail of a rigid protein that crystallizes</td>
      <td>X-ray crystallography</td>
      <td>An AlphaFold model as the molecular replacement search model</td>
      <td>Fit to the density map and the free R-factor of the final model</td>
    </tr>
    <tr>
      <td>Shape of a large complex or a protein that will not crystallize</td>
      <td>Cryo-EM</td>
      <td>ModelAngelo or CryoAtom for a first model, AlphaFold models of each subunit to dock</td>
      <td>Local resolution of each region and MolProbity geometry</td>
    </tr>
    <tr>
      <td>How a small domain or a disordered region moves</td>
      <td>NMR</td>
      <td>An AlphaFold model of the folded part as a reference</td>
      <td>Whether the ensemble spread reflects motion or missing restraints</td>
    </tr>
    <tr>
      <td>Which proteins are in a density map</td>
      <td>A cryo-EM map built without sequences</td>
      <td>A sequence search of the chain profiles against a proteome</td>
      <td>The E-value and the density behind each matched chain</td>
    </tr>
    <tr>
      <td>Whether a prediction is good enough for a question</td>
      <td>pLDDT and PAE</td>
      <td>Every experimental structure of the same protein</td>
      <td>Whether the prediction's domain arrangement matches any of them</td>
    </tr>
    <tr>
      <td>Which conformations a protein adopts</td>
      <td>Several experiments in different states</td>
      <td>The prediction as a reference point, not an answer</td>
      <td>Entry-to-entry r.m.s.d., as in Figure 3</td>
    </tr>
  </tbody>

Ask what condition each structure describes before comparing two of them. Treat a prediction's confidence as a reason to trust its folds and an invitation to test its arrangements, and compare it with every experimental structure of the same protein, because a single entry is a single state.

## Structure building and comparison tools on ProteinIQ

A project usually starts with a prediction, builds a model into a map when there is one, checks the geometry and then compares the result with what the PDB already holds.

  <caption><strong>Table 6. Prediction, model building, checking and comparison tools on ProteinIQ.</strong></caption>
  <thead>
    <tr>
      <th scope="col">Task</th>
      <th scope="col">Tool</th>
    </tr>
  </thead>
  <tbody>
    <tr>
      <td>Predict a protein structure from sequence</td>
      <td>[AlphaFold 2](/app/alphafold-2)</td>
    </tr>
    <tr>
      <td>Download a predicted model from the AlphaFold Database</td>
      <td>[AlphaFold Database Download](/app/alphafold-database-download)</td>
    </tr>
    <tr>
      <td>Download an experimental structure from the PDB</td>
      <td>[PDB Download](/app/pdb-download)</td>
    </tr>
    <tr>
      <td>Build an atomic model into a cryo-EM map, with or without sequences</td>
      <td>[ModelAngelo](/app/modelangelo)</td>
    </tr>
    <tr>
      <td>Build proteins, DNA and RNA into a map and identify chains against a sequence database</td>
      <td>[CryoAtom](/app/cryoatom)</td>
    </tr>
    <tr>
      <td>Check geometry, clashes and Ramachandran outliers</td>
      <td>[MolProbity](/app/molprobity)</td>
    </tr>
    <tr>
      <td>Superimpose two structures and measure the difference</td>
      <td>[US-align](/app/usalign), [RMSD calculator](/app/rmsd-calculator)</td>
    </tr>
    <tr>
      <td>Find experimental structures with a similar shape</td>
      <td>[Foldseek](/app/foldseek)</td>
    </tr>
  </tbody>

## Frequently asked questions

### Is cryo-EM better than X-ray crystallography?

Neither is better; they suit different samples. Of PDB entries released from 2021 to 2025, 45.6% of cryo-EM entries have a model of 300 kDa or more, against 3.3% of crystal structures, while 54.6% of crystal structures reach 2.0 Å or better, against 1.0% of cryo-EM structures. The median 2025 resolution is 1.94 Å for crystallography and 3.14 Å for cryo-EM.

### Can AlphaFold replace X-ray crystallography, cryo-EM or NMR?

No. On 215 crystal structures released after its training cutoff, AlphaFold predictions had a mean map-model correlation of 0.56, against 0.86 for deposited models, and the authors concluded that predictions are hypotheses that accelerate but do not replace experiments. It also does not model ligands and usually returns one conformation, matching only one state for 94% of 98 fold-switching proteins.

### How accurate is AlphaFold compared with experimental structures?

For well-folded proteins it is close. Median backbone accuracy in CASP14 was 0.96 Å r.m.s.d.<sub>95</sub>, and against 215 recent crystal structures the median Cα RMSD was 1.0 Å, with 0.6 Å between two crystal forms of the same protein. For a flexible protein such as calmodulin the model sits a median of 11.4 Å from experimental entries that are themselves 10.7 Å apart.

### What size can NMR and cryo-EM handle?

Conventional NMR is generally limited to proteins of about 30 kDa or less, and methyl labeling extends dynamics studies to complexes near 1 MDa. Typical cryo-EM entries are larger, with a median model of 244 kDa in 2025. Smaller targets need help, such as a scaffold for the 19 kDa KRAS or a phase plate for the 64 kDa hemoglobin.

### How do I build an atomic model into a cryo-EM map?

Use a program that traces the map and places residues, then check and refine the result. [ModelAngelo](/app/modelangelo) built 77% of the residues in 177 test maps better than 4 Å, and [CryoAtom](/app/cryoatom) aims to work at lower resolution. Both models are first drafts for [MolProbity](/app/molprobity) checks and real-space refinement.

### Which method should I use for a new protein?

Start with a prediction to see domains and confidence, then choose the experiment by sample: crystallography for a rigid protein that crystallizes, cryo-EM for a large or crystal-resistant assembly, NMR for a small or disordered protein. Compare the prediction with every experimental structure of that protein before relying on its domain arrangement.
